A COMPELLING VALUE PROPOSITION TSX: SGY - August, 2021 - Surge Energy Inc.
←
→
Page content transcription
If your browser does not render page correctly, please read the page content below
A COMPELLING VALUE
PROPOSITION

TSX: SGY

August, 2021
FIVE KEY REASONS TO OWN SURGE

 Surge has industry leading positive cash flow ‘torque’ to both rising oil prices and tight
 Canadian oil price differentials; as well as a very high quality, low cost, low risk,
 conventional crude oil asset base.

1. The Company has a proven management team with significant insider ownership
   and a history of providing investors compelling returns;
2. Crude oil is up >540% in the last 16 months(1), with many large brokerage firms are
   calling for $80+ WTI oil prices in 2H/2021 and beyond(2);
3. Surge will deliver >$235 million of adjusted funds flow(3) in 2022, generating $110
   million in free cash flow(3)(4);

4. Surge produces light and medium gravity crude oil from elite, large OOIP(5) crude oil
   assets, with some of the lowest full-cycle capital costs in Canada; and
5. All of Surge’s core operating areas independently rank in the top conventional oil plays
   in Canada(6), including the newly acquired SE Saskatchewan conventional light oil
   assets. Together Surge’s core areas have a deep, 13-year, low risk, development
   drilling inventory(7).
             (1) From WTI US$11.57 per barrel in April of 2020 to over WTI US$62.85 per barrel on August 20 th, 2021,
             (2) Brokerages include JP Morgan and Goldman Sachs.
             (3) See the non-GAAP financial measures as the back of this presentation.
             (4) Assumptions: US $70 WTI; WCS US $13.50; MSW US$5.00, FX $0.80, AECO $2.50.
             (5) See the Reserves in the Oil and Gas advisories section at the back of this presentation.
                                                                                                                               2
             (6) As per National Bank of Canada Thematic Research “Expanding on the Emerging Clearwater”, September 8, 2019.
             (7) See Drilling Locations in the Oil and Gas advisories section at the back of this presentation.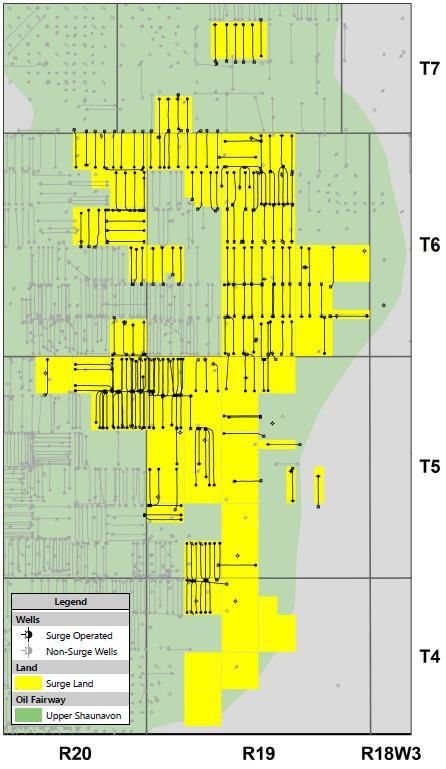
RECENT DEVELOPMENTS(1)
Strategic, light oil, accretive acquisition in SE Saskatchewan

▪ Surge Energy has successfully completed the previously announced
  acquisition of Astra Oil Corp (“Astra”).

▪ The assets include more than 4,100 boepd (90% liquids) of high netback,
  light oil production, focused primarily in SE Saskatchewan.

▪ Proforma, Surge has a high quality, 20,200 boepd (85% liquids), light and
  medium oil company with two strong growth core areas: SE Saskatchewan
  and the Sparky.

▪ In conjunction with the Astra acquisition, Surge negotiated a new $215
  million, single-tranche, first lien revolving credit facility; which has been
  extended to November 30, 2022.

              (1) For further information see both the July 29th and August 17th, 2021 press releases.
                                                                                                         3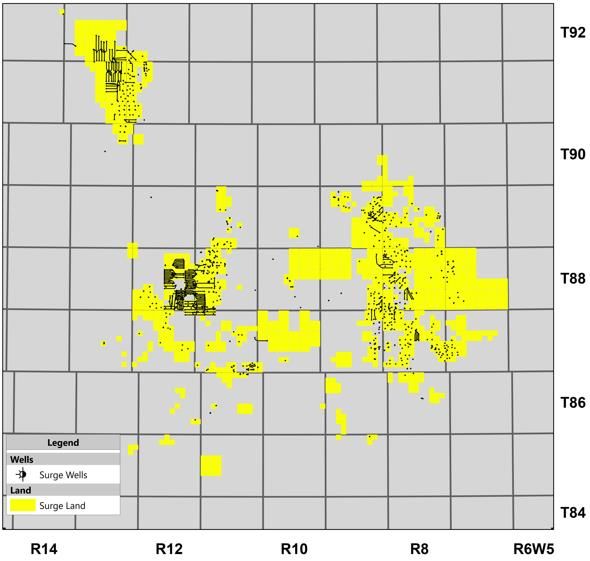
UPWARDLY REVISED 2021 EXIT & 2022 GUIDANCE
Proforma guidance reveals strong ‘torque’ to WTI pricing

     US $WTI per bbl                                           $65 WTI(1)                                              $70 WTI(1)        $75 WTI(1)

         Exit 2021(e) production                                                                           20,200 boepd (85% liquids)
          Average & exit 2022(e)
                                                                                                           20,200 boepd (85% liquids)
                    production
  2022(e) Adjusted funds flow(2)                               $210 million                                            $235 million     $265 million

         2022(e) Cash flow from
                                                               $195 million                                            $220 million     $250 million
                   operations(2)
     Total 2022(e) Exploration &
                                                                                                                         $110 million
            development capital

    Total 2022(e) Free cash flow                                $85 million                                            $110 million     $140 million

    2022(e) All-in payout ratio(3)                                    56%                                                   50%            44%
2022(e) Net debt(3) to annualized
     Q4/22 adjusted funds flow                                        1.0x                                                  0.8x           0.6x

                (1) All guided pricing scenarios include the following assumptions: WCS US $13.50; MSW US$5.00, FX $0.80, AECO $2.50.
                (2) Excludes realized gains / losses from financial derivatives.                                                                       4
                (3) See the non-GAAP financial measures as the back of this presentation.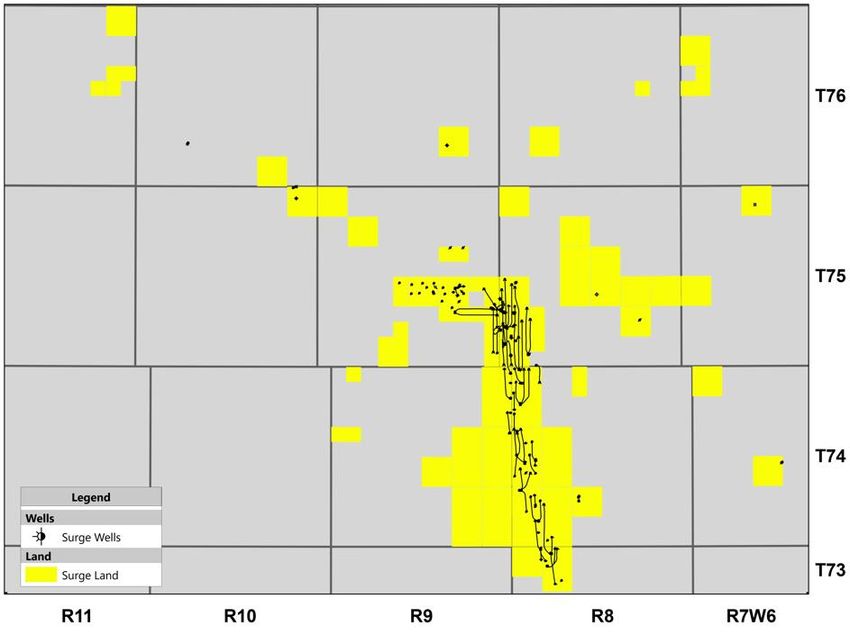
STRATEGIC FOCUS
Top-tier production efficiencies leading to sustainable asset development, strengthening of the
balance sheet, and continued emphasis on ESG initiatives

         Disciplined
                                          Financial                          ESG
           Capital
                                         Positioning                      Initiatives
         Allocation

    Undertake low cost, high        Focus on high return             Continued focus on
      impact, sustainable           projects and strategic         abandonment program
           projects.               business propositions to         driving a reduction in
                                    enhance the balance                   Corporate
                                  sheet and further improve       decommissioning liability.
                                           liquidity.

                                                                                                  5
ENVIRONMENTAL, SOCIAL, AND GOVERNACE
Surge is committed to being a leader in ESG within the Canadian peer group

▪ The company continues to execute on its abandonment program and has abandoned
  >300 total inactive wells over the last year;

▪ Surge has received more than $14 million in funding through the Government of
  Alberta’s Site Rehabilitation Program within the last year;

▪ Surge has several ongoing capital projects aimed at reducing GHG emissions,
  including a 45 km pipeline project to conserve natural gas from several operated fields
  in SE Saskatchewan, reducing flared gas by 95%.

▪ Surge employs a pro-active safety culture and is proud to be more than 5 years
  without a lost-time incident.

▪ Surge has established an internal ESG team to drive the Company’s ESG strategy
  and will be publishing's its inaugural ESG report in the fourth quarter of 2021.

                                                                                            6
OPERATIONS FOCUSED IN 5 CORE AREAS
Large OOIP pools in established conventional reservoir trends
Greater Sawn:
93% Oil & NGL’s
Average
Valhalla: 85% Oil & NGL’s
65% Oil & NGL’s
Sparky:
93% Oil & NGL’s
SE Saskatchewan
90% Oil & NGL’s
Minors:
50% Oil & NGL’s
Shaunavon
100% Oil & NGL’s
7
FOOTNOTES INCLUDED IN THE BACK AS ENDNOTESNET OOIP OF >2.5 BILLION BARRELS
Large OOIP, with low recovery factors - focused in conventional reservoirs
SGY Net CTD(3) Total Booked Net
Total Net drilling
Estimated Oil Independent Recovery
Core Area Formations Locations Avg. WI
Net OOIP (1) Recovery Factor P+P
(MMbbls) (Booked)(2) Factor (% OOIP)
Sparky Formation + >400
Sparky Core >800 92% 10.6% 13.6%
Mannville Group (152)
>70
Valhalla Doig / Montney >200 82% 5.5% 10.2%
(35)
>100
Greater Sawn Slave Point >600 89% 5.2% 7.8%
(62)
Shaunavon >125
Shaunavon >400 100% 2.1% 3.9%
(Upper & Lower) (77)
SE Sask. & Midale/Frobisher/ >120
>120 68% 4.0% 8.4%
Manitoba Lodgepole (~90)*
(4) >850
TOTALS : >2,500 89% 6.1% 8.5%
(433)
*SGY internally reviewed and anticipated booked locations for YE 2021 reserves
>2.5 Billion barrels of net internally estimated OOIP under ownership;
Current net recovery factor ~6.1%.
(1) See the Reserves section in the Oil & Gas Advisories section at the back of the presentation.
(2) See Drilling Locations in the Oil and Gas Advisories section at the back of this presentation.
(3) CTD means cumulative oil produced to date and is effective to December 31, 2020. 8
(4) Totals do not sum as minor properties have been included in the totals but have not been subcategorized in the table.
(5) See the Additional Metrics section of the Oil and Gas Advisories at the back of this presentationTARGETING CONVENTIONAL OIL RESERVOIRS
Surge focuses on high quality reservoirs at the conventional end of the permeability spectrum
Recovery factors, internal rates of return (IRR),
decline rate, and profit to investment ratio
(PIR)(1) improve as reservoir quality improves.
Ultimate Oil
Recovery
PIR
&
IRR
High Risk Low Risk
High Decline CAPITAL / BUSINESS / OPERATIONAL RISK
Low Decline
Unconventional
Conventional Reservoirs
Reservoirs
Extremely Tight Very Tight Tight Low Moderate High
SE Sask.
Bakken
Slave Point
Permian
Valhalla Doig
Montney Viking-Cardium Shaunavon
Duvernay
Resource Halo Sparky
0.0001 0.001 0.01 0.1 1 10 100
Source: Modified from US Department of Energy Study
Permeability (mD)
Average Surge Permeability
(1) See the Additional Metrics section of the Oil and Gas Advisories at the back of this presentation. 9SPARKY – POSITIONED FOR CONTINUED SUCCESS
Delivering sustainable production and cash flow growth
Surge controls a dominant position in its core Sparky medium/light oil asset; the
Sparky oil play is one of the top conventional crude oil growth plays in all of Canada,
possessing:
• >800 million barrels of net OOIP; and
• ~8,000 boepd of production (93% oil); and
• >$100MM of operating cash flow at US$65 WTI per bbl. oil pricing; and
• >400 low risk net Sparky drilling locations (>12 year drilling inventory).
Surge continues to demonstrate and unlock the potential of its Sparky play, having
grown production by over 550% in the last six years from 1,200 boepd to ~8,000
boepd today.
10
FOOTNOTES INCLUDED IN THE BACK AS ENDNOTESSPARKY: A DOMINANT POSITION
Low on-stream costs, year-round access = a premier Canadian medium/light oil growth play
▪ The Sparky is a large, well established, oil producing
AB SK formation in Western Canada.
>11 Billion Barrel ▪ Surge holds a dominant land position in the medium /
Trend light gravity oil window and is applying modern horizontal
One of Canada’s multi-stage fracturing technology.
Largest Accumulations
of Oil Key Sparky Value Drivers:
• Shallow depth (700-900m).
• Low-cost drilling (D,C&E at $1.2MM per well).
• Continually improving costs and efficiencies with the
implementation of pad drilling & year-round access.
Lloydminster • Low geological risk due to 3D seismic and thousands of
Edmonton vertical penetrations.
~60km • Focus on lighter oil gravity (23-31° API) = higher operating
netbacks.
• Proven waterflood potential (Wainwright pool at >35%
recovery factor(1)).
Medium / Light Gravity
Oil Window Sparky Formation Facts(1)
>20° API
First Production May 1922
Original Oil in Place > 11 Bbbls
Cum Production > 1 Bbbls
25 km
Recovery Factor 20,000
Hz Wells / Multi-Stage Hz /
Surge Drilled Multi-Stage Hz >750 / >280 / >165
(1) Data sourced from Canadian Discovery and GeoScout 11
FOOTNOTES INCLUDED IN THE BACK AS ENDNOTESSTRATEGIC RE-ENTRY INTO SE SASKATCHEWAN
Adding high netback light oil production and reserves
▪ Surge has targeted SE Saskatchewan, by way of Astra, as a new, light oil, core area
with the following benefits:
• >120MMbbl’s of net OOIP in low risk, proven conventional reservoirs; and
• ~4,100 boepd of predominantly light oil production (90% light oil and NGL’s); and
• >$58MM of operating cash flow at US$65 WTI per bbl oil pricing; and
• >120 low risk net drilling locations (>10 year drilling inventory); and
• Opportunities for continued growth organically and through strategic acquisitions.
▪ Management has a very strong track record of success in SE Saskatchewan and is
excited to demonstrate and unlock the potential of this new core area.
12
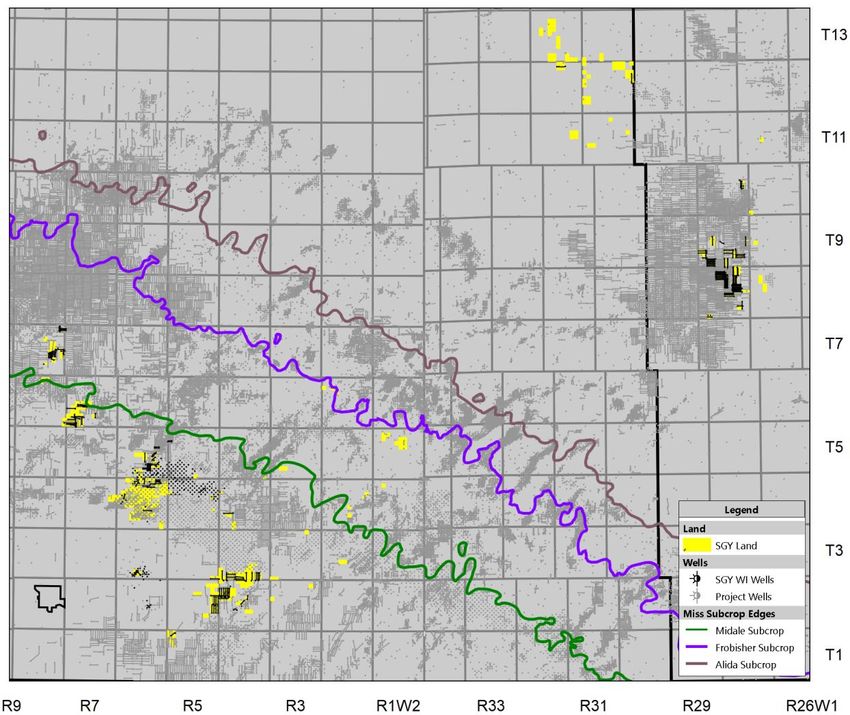
FOOTNOTES INCLUDED IN THE BACK AS ENDNOTESSOUTHEAST SASKATCHEWAN – ASSET OVERVIEW
High netback, low cost, conventional focused, light oil assets in the Williston Basin
SK MB ▪ Operations in SE Saskatchewan & Manitoba
• SE Sask ~3,300 boepd (82% Light Oil)
• Manitoba ~700 boepd (99% Light Oil)
Frobisher / Midale ▪ >120MM barrels of net OOIP with a 4%
Production Sinclair recovery factor to date.
▪ Organically grown assets with minimal
environmental liabilities.
Lodgepole / Bakken
Viewfield Production
▪ 80% average working interest, 90% operated:
Minard
• 250 Total Net WI Wellbores, Surge operates
224
Steelman
▪ Six operated multi-well batteries.
Pinto ▪ Greenhouse Gas Emission Reduction
Estevan
Program:
• 45km gas pipeline to tie in and conserve
natural gas from Steelman, Minard and
Viewfield.
13VALHALLA – STACKED PAY MULTI-ZONE POTENTIAL
Multiple large OOIP light oil reservoirs provide a sustainable drilling inventory and production base
▪ ~200MMbbls of net combined OOIP.
▪ Doig and Montney turbidite wells among the
most prolific oil producers in Western Canada.
▪ A previously drilled horizontal well into the
Company’s large OOIP Montney (turbidite) light
oil pool had initial production rates exceeding
1,400 bopd and has produced >280 mboe
Montney
(>225 mbbls of oil) in 15 months.
▪ Drilling inventory includes >45 net locations in
multiple horizons (35 net booked).
Doig ▪ Additional regional Montney inventory includes
32 net drilling locations (0 net booked).
▪ Light oil gravity (~40° API), extensive
infrastructure in the area and access to multiple
egress options = attractive operating netbacks.
Depth Net OOIP Capital IP 180(1) IP 180 Prod Eff(1)
Formation
(m) (MMbbl) ($MM/well) (boe/d) ($/boepd)
Doig 2050 >150 $4.2 450 $9,300
Montney 2200 >40 $4.0 370 $10,800
(1) See the Additional Metrics section of the Oil and Gas Advisories at the back of this presentation. 14GREATER SAWN - CONCENTRATED LIGHT OIL
>600 MMbbls net OOIP in concentrated Slave Point reservoirs
▪ Net OOIP of >600 MMbbls of light oil
(35-42° API).
Sawn
OOIP: >200 MMbbl net
▪ Development inventory of 100 net locations
Red Earth
OOIP: >250 MMbbl net
(62 net booked).
▪ Key Slave Point attributes:
• ~5% recovery to date.
Otter • 150 MMbbl net
• Production derived primarily from large multi-cycle
reef complexes (pay(1) thickness of up to 18
meters).
▪ Successful Slave Point waterfloods:
• Sawn
• Red Earth
• Evi/Otter
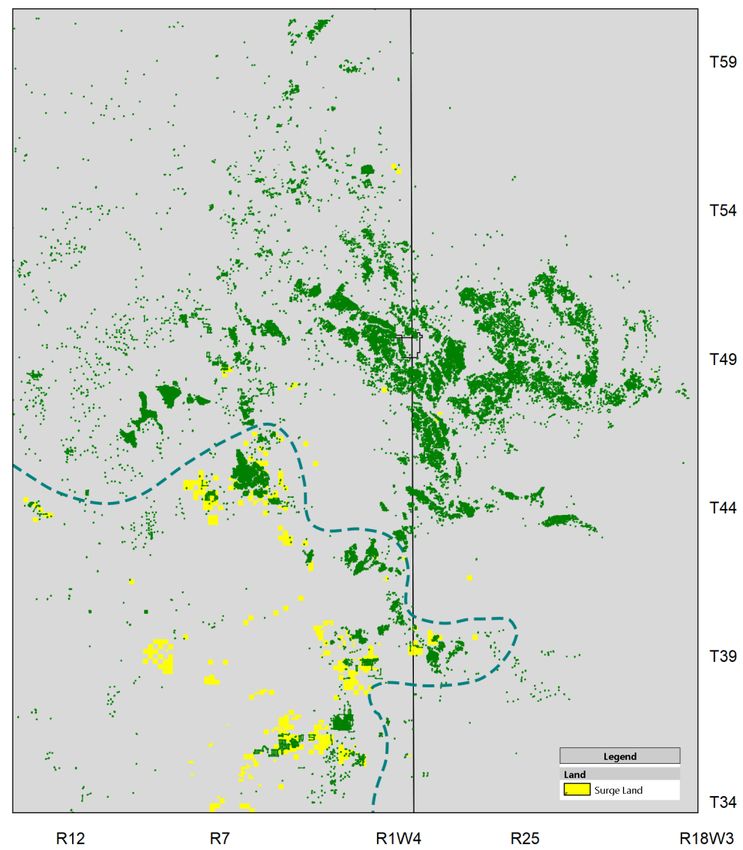
(1) See the Additional Metrics section of the Oil and Gas Advisories at the back of this presentation 15SHAUNAVON
>400 MMbbl net OOIP on Surge lands in the stacked Upper and Lower Shaunavon formations
▪ Shaunavon produces 100% low decline medium gravity
crude oil with high operating netbacks.
▪ Upper Shaunavon net OOIP is estimated to be
>200MMbbl.
• >65 net locations – (29 net booked).
• 10 horizontal wells converted to water injection.
• Current recovery in the Upper Shaunavon is ~1%
to date.
▪ Lower Shaunavon net OOIP is estimated to be
>200MMbbl.
• >70 net locations – (48 net booked).
• Surge drilled and completed 6 Lower Shaunavon
wells using cemented liner, plug and perf
methodology with 100% success rate.
• Current recovery in the Lower Shaunavon is ~3%
to date.
16APPENDIX
17OIL HEDGING
Qtr. 3 2021 Qtr. 4 2021 Qtr. 1 2022 Qtr. 2 2022 Qtr. 3 2022 Qtr. 4 2022
Avg. Floor
Price(1) $ 55.71 $ 57.50 $ 68.21 $76.06 $ 77.40 $ 76.84
(1) All USD-denominated WTI hedges have been converted to CAD at a rate of $0.79 USD/CAD in the above table.
18RISK MANAGEMENT / HEDGING
The Company has an on-going, risk management / hedging program. Below is a list of Surge’s current WTI, WCS
differential, and MSW differential hedges:
WTI Crude Oil Derivative Contracts(1)
WCS Oil Differential Hedges(1) MSW Oil Differential Hedges(1)
(1) All USD-denominated hedges have been converted to CAD at a rate of $0.79 USD/CAD.
(2) WTI 3-way hedges consist of a sold put, a bought put and a sold call. For example, if a WTI 3-way is priced $60/$72.50/$90, Surge
receives WTI+$12.50/bbl when WTI is at or below $60/bbl; Surge receives $72.50/bbl when WTI is between $60/bbl and 19
$72.50/bbl; Surge receives WTI when WTI is between $72.50/bbl and $90/bbl; and Surge receives $90/bbl when WTI is above
$90/bbl.RISK MANAGEMENT / HEDGING
The Company has an on-going, risk management / hedging program. Below is a list of Surge’s current AECO &
Chicago natural gas hedges and interest rate hedges(1):
Chicago & AECO Natural Gas Hedges
Interest Rate Hedge
Notional Amount Surge Surge
Type Term Fixed Rate Surge Pays
(CAD) Receives Pays
Semi-Annual Step Up
Fixed-to-Floating Rate Feb 2018 to Feb Floating • Beginning at 1.786%
$100,000,000 Fixed Rate
Swap 2023 Rate • Ending at 2.714%
• Averaging 2.479%
Fixed-to-Floating Rate July 2019 – June Floating
$50,000,000 Fixed Rate 1.7850%
Swap 2024 Rate
(1) All USD-denominated WTI hedges have been converted to CAD at a rate of $0.79 USD/CAD.
20ANALYST COVERAGE
Financial Institution Analyst Email Address
Acumen Capital Partners Trevor Reynolds treynolds@acumencapital.com
BMO Capital Markets Ray Kwan ray.kwan@bmo.com
Canaccord Genuity Anthony Petrucci apetrucci@canaccordgenuity.com
Clarus Securities Inc. Robert Pare rpare@clarussecurities.com
Cormark Securities Inc. Garett Ursu gursu@cormark.com
Laurentian Bank Securities Todd Kepler KeplerT@lb-securities.ca
National Bank Financial Dan Payne Dan.Payne@nbc.ca
Peters & Co. Limited Dan Grager dgrager@petersco.com
Raymond James Jeremy McCrea Jeremy.McCrea@raymondjames.ca
Schachter Energy Research Services Josef I. Schachter josef@schachterenergyreport.ca
Stifel FirstEnergy Robert Fitzmartyn rjfitzmartyn@stifel.com
Velocity Trade Capital Mark Heim Mark.Heim@velocitytradecapital.com
21CORPORATE PARTNERS
Advisors
National Bank of Canada
ATB Financial
Bank of Nova Scotia
Bank of Montreal
BDC Capital
Lending Syndicate: Canadian Imperial Bank of Commerce
Export Development Canada
Goldman Sachs
HSBC Bank Canada
Toronto-Dominion Bank
Auditor: KPMG LLP
Legal Counsel: McCarthy Tétrault
Evaluation Engineers: Sproule
Common Share Registrar & Transfer Agent: Odyssey Trust
Paul Colborne, President & CEO
Investor Contacts:
Jared Ducs, CFO
2100, 635 – 8th Ave. SW, Calgary Alberta T2P 3M3
T: 403.930.1010 F: 403.930.1011
www.surgeenergy.ca
22FORWARD-LOOKING STATEMENTS
FORWARD-LOOKING STATEMENTS
This presentation contains forward-looking statements. The use of any of the words “anticipate”, “continue”, “estimate”, “expect”, “may”, “will”, “project”, “should”, “believe” and
similar expressions are intended to identify forward-looking statements. These statements involve known and unknown risks, uncertainties and other factors that may cause actual
results or events to differ materially from those anticipated in such forward-looking statements.
More particularly, this presentation contains statements concerning: Surge’s declared focus and primary goals; management’s expectations and plans with respect to the
development of its assets and the timing thereof; Surge’s declared focus and primary goals; Surge’s planned drilling program for 2H/21 and the potential for revisions thereto;
Surge’s drilling inventory and locations; management’s expectations regarding commodity prices; Surge’s annual exploration and development capital expenditure program and
budget and its flexibility to make adjustments thereto; management’s expectations regarding production growth, 2021 average production; management’s expectations regarding
2021 estimated operating expenses, transportation expenses and general and administrative expenses; and Surge’s abandonment and reclamation program and management’s
expectations regarding reductions in Surge’s decommissioning liability.
The forward-looking statements are based on certain key expectations and assumptions made by Surge, including expectations and assumptions the performance of existing wells
and success obtained in drilling new wells; anticipated expenses, cash flow and capital expenditures; the application of regulatory and royalty regimes; prevailing commodity prices
and economic conditions; development and completion activities; the performance of new wells; the successful implementation of waterflood programs; the availability of and
performance of facilities and pipelines; the geological characteristics of Surge’s properties; the successful application of drilling, completion and seismic technology; the determination
of decommissioning liabilities; prevailing weather conditions; exchange rates; licensing requirements; the impact of completed facilities on operating costs; the availability and costs of
capital, labour and services; and the creditworthiness of industry partners.
Although Surge believes that the expectations and assumptions on which the forward-looking statements are based are reasonable, undue reliance should not be placed on the
forward-looking statements because Surge can give no assurance that they will prove to be correct. Since forward-looking statements address future events and conditions, by their
very nature they involve inherent risks and uncertainties. Actual results could differ materially from those currently anticipated due to a number of factors and risks. These include, but
are not limited to, risks associated with the condition of the global economy, including trade, public health (including the impact of COVID-19) and other geopolitical risks; risks
associated with the oil and gas industry in general (e.g., operational risks in development, exploration and production; delays or changes in plans with respect to exploration or
development projects or capital expenditures; the uncertainty of reserve estimates; the uncertainty of estimates and projections relating to production, costs and expenses, and
health, safety and environmental risks); commodity price and exchange rate fluctuations and constraint in the availability of services, adverse weather or break-up conditions;
uncertainties resulting from potential delays or changes in plans with respect to exploration or development projects or capital expenditures; and failure to obtain the continued
support of the lenders under Surge’s bank line. Certain of these risks are set out in more detail in Surge’s AIF dated March 9, 2021 and in Surge’s MD&A for the period ended
December 31, 2020, both of which have been filed on SEDAR and can be accessed at www.sedar.com.
The forward-looking statements contained in this presentation are made as of the date hereof and Surge undertakes no obligation to update publicly or revise any forward-looking
statements or information, whether as a result of new information, future events or otherwise, unless so required by applicable securities laws.
.
23OIL AND GAS ADVISORIES
The term “boe” means barrel of oil equivalent on the basis of 1 boe to 6,000 cubic feet of natural gas. Boe may be misleading, particularly if used in isolation. A boe conversion ratio of 1 boe for 6,000 cubic
feet of natural gas is based on an energy equivalency conversion method primarily applicable at the burner tip and does not represent a value equivalency at the wellhead. Given that the value ratio based on
the current price of crude oil as compared to natural gas is significantly different from the energy equivalency of 6:1, utilizing a conversion on a 6:1 basis may be misleading as an indication of value.
In this presentation: (i) mcf means thousand cubic feet; (ii) mcf/d means thousand cubic feet per day (iii) MMcf means million cubic feet; (iv) MMcf/d means million cubic feet per day; (v) bbls means barrels;
(vi) Mbbls means thousand barrels; (vii) MMbbls means million barrels; (viii) bbls/d means barrels per day; (ix) bcf means billion cubic feet; (x) Mboe means thousand barrels of oil equivalent; (xi) MMboe
means million barrels of oil equivalent; (xii) boe/d and boepd means barrels of oil equivalent per day; and (xiii) NGLs means natural gas liquids.
Reserves
This presentation contains certain oil and gas metrics and defined terms which do not have standardized meanings or standard methods of calculation and therefore such measures may not be comparable to
similar metrics/terms presented by other issuers and may differ by definition and application. All oil and gas metrics/terms used in this document are defined below:
Original Oil in Place (“OOIP”) means Discovered Petroleum Initially In Place (“DPIIP”). DPIIP is derived by Surge’s internal Qualified Reserve Evaluators (“QRE”) and prepared in accordance with National
Instrument 51-101 and the Canadian Oil and Gas Evaluations Handbook (“COGEH”). DPIIP, as defined in COGEH, is that quantity of petroleum that is estimated, as of a given date, to be contained in known
accumulations prior to production. The recoverable portion of DPIIP includes production, reserves and Resources Other Than Reserves (ROTR). OOIP/DPIIP and potential recovery rate estimates are based on
current recovery technologies. There is significant uncertainty as to the ultimate recoverability and commercial viability of any of the resource associated with OOIP/DPIIP, and as such a recovery project cannot
be defined for a volume of OOIP/DPIIP at this time. “Internally estimated” means an estimate that is derived by Surge’s internal QRE’s and prepared in accordance with National Instrument 51-101 - Standards of
Disclosure for Oil and Gas Activities. All internal estimates contained in this new release have been prepared effective as of Jan 1, 2021.
Drilling Locations
This presentation discloses drilling locations in two categories: (i) booked locations; and (ii) unbooked locations. Booked locations are proved locations and probable locations derived from an external evaluation
using standard practices as prescribed in the Canadian Oil and Gas Evaluations Handbook and account for drilling locations that have associated proved and/or probable reserves, as applicable.
Unbooked locations are internal estimates based on prospective acreage and assumptions as to the number of wells that can be drilled per section based on industry practice and internal review. Unbooked
locations do not have attributed reserves or resources. Unbooked locations have been identified by Surge’s internal certified Engineers and Geologists (who are also Qualified Reserve Evaluators) as an
estimation of our multi-year drilling activities based on evaluation of applicable geologic, seismic, engineering, production and reserves information. There is no certainty that the Company will drill all unbooked
drilling locations and if drilled there is no certainty that such locations will result in additional oil and gas reserves, resources or production. The drilling locations on which the Company actually drills wells will
ultimately depend upon the availability of capital, regulatory approvals, seasonal restrictions, oil and natural gas prices, costs, actual drilling results, additional reservoir information that is obtained and other
factors. While certain of the unbooked drilling locations have been de-risked by drilling existing wells in relative close proximity to such unbooked drilling locations, the majority of other unbooked drilling locations
are farther away from existing wells where management has less information about the characteristics of the reservoir and therefore there is more uncertainty whether wells will be drilled in such locations and if
drilled there is more uncertainty that such wells will result in additional oil and gas reserves, resources or production.
Net of Surge March 25, 2021 disposition, the pro forma Company (Surge + Astra) will have over >925 gross (>850 net) drilling locations identified herein, of these >450 gross (>400 net) are unbooked locations.
Of the 461 net booked locations identified herein, 347 net are Proved locations and 114 net are Probable locations based on Sproule’s 2020YE reserves. Assuming an average number of net wells drilled per
year of 65, Surge’s >925 net locations provide 13 years of drilling.
Surge’s internally developed type curves (for both Surge and Astra) were constructed using a representative, factual and balanced analog data set, as of Jan 1, 2021 for Surge type curves and April 15, 2021 for
Astra type curves. All locations were risked appropriately, and EUR’s were measured against OOIP estimates to ensure a reasonable recovery factor was being achieved based on the respective spacing
assumption. Other assumptions, such as capital, operating expenses, wellhead offsets, land encumbrances, working interests and NGL yields were all reviewed, updated and accounted for on a well by well
basis by Surge’s Qualified Reserve Evaluators. All type curves fully comply with Part 5.8 of the Companion Policy 51 – 101CP.
24NON-GAAP FINANCIAL MEASURES
Certain secondary financial measures in this presentation – namely, "adjusted funds flow", “free cash flow”, and “all-in payout ratio” are not prescribed by GAAP. These non-GAAP financial
measures are included because management uses the information to analyze business performance, cash flow generated from the business, leverage and liquidity, resulting from the
Company's principal business activities and it may be useful to investors on the same basis. None of these measures are used to enhance the Company's reported financial performance
or position. The non-GAAP measures do not have a standardized meaning prescribed by IFRS and therefore are unlikely to be comparable to similar measures presented by other issuers.
They are common in the reports of other companies but may differ by definition and application. All non-GAAP financial measures used in this document are defined below:
Adjusted Funds Flow
The Company adjusts cash flow from operating activities in calculating adjusted funds flow for changes in non-cash working capital, decommissioning expenditures and transaction costs.
Management believes the timing of collection, payment or incurrence of these items involves a high degree of discretion and as such may not be useful for evaluating Surge’s cash flows.
Changes in non-cash working capital are a result of the timing of cash flows related to accounts receivable and accounts payable, which management believes reduces comparability
between periods. Management views decommissioning expenditures predominately as a discretionary allocation of capital, with flexibility to determine the size and timing of
decommissioning programs to achieve greater capital efficiencies and as such, costs may vary between periods. Transaction costs represent expenditures associated with acquisitions,
which management believes do not reflect the ongoing cash flows of the business, and as such reduces comparability. Each of these expenditures, due to their nature, are not considered
principal business activities and vary between periods, which management believes reduces comparability.
All-in Payout Ratio
All-in payout ratio is calculated using the sum of total exploration and development capital divided by adjusted funds flow. This capital management measure is used by management to
analyze allocated capital in comparison to the cash being generated by the principal business activities. This measure is provided to allow readers to quantify the amount of adjusted funds
flow that is being used to deploy into the Company’s exploration and development program. A ratio of less than 100% indicates that a portion of the adjusted funds flow is being retained by
the Company and can be used to fund items such as asset abandonment, repayment of debt, fund acquisitions or the costs related thereto, withholding tax obligations on stock-based
compensation or other items.
Free Cash Flow
Free cash flow is calculated as cash flow from operating activities less exploration and development capital expenditures. Management uses free cash flow to determine the amount of
funds available to the Company for future capital allocation decisions.
Net Debt
There is no comparable measure in accordance with IFRS for net debt. Net debt is calculated as bank debt, term debt, dividends payable plus the liability component of the convertible
debentures plus or minus working capital, however, excluding the fair value of financial contracts, decommissioning obligations, and lease and other obligations.
25ADDITIONAL METRICS
Additional Metrics
This presentation contains additional metrics commonly used in the oil and natural gas industry. These terms have been calculated by Management and do not have a
standardized meaning. Management uses these oil and gas metrics to further analyze the performance of the Company over time and to compare the results of the
Company with others in the industry. Additional metrics used in this presentation are as follows:
•Net Present Value (NPV) is the present value of cash inflows less present value of cash outflows.
• Internal rate of return (IRR) is the discount rate that makes the NPV of all cash flows from a given project equal to zero.
• Profit to investment ratio (PIR) is calculated as the NPV from a project divided by the capital investment ascribed to that project.
• Recovery factor is defined as the percentage of hydrocarbons currently recovered or potentially recoverable from a known accumulation of such hydrocarbons.
•Pay, for the purpose of this presentation, is defined as hydrocarbons located in the subsurface as determined by Surge’s internal QRE. The overall interval in which
pay sections occur is the gross pay; the smaller portions of the gross pay that meet local criteria for pay (such as minimum porosity, permeability and hydrocarbon
saturation) are net pay.
•Production Efficiency is capital divided by production. IP180 production efficiencies is the capital costs of the well divided by the initial production over the first 180
days.
•References to initial production (IP) rates found in this presentation are useful for determining the presence of hydrocarbons. There is no assurance as to the length of
time that wells will produce at such rates, and consideration must be given to natural declines thereafter. As such, readers are cautioned when using these production
rates to aggregate Surge’s production.
26You can also read