A New Data-Focused Introductory Programming Course
←
→
Page content transcription
If your browser does not render page correctly, please read the page content below

A New Data-Focused Introductory Programming
                  Course

            Suraj Rampure

            Electrical Engineering and Computer Sciences
            University of California, Berkeley

            Technical Report No. UCB/EECS-2021-106
            http://www2.eecs.berkeley.edu/Pubs/TechRpts/2021/EECS-2021-106.html

            May 14, 2021
Copyright © 2021, by the author(s).
                            All rights reserved.

Permission to make digital or hard copies of all or part of this work for
personal or classroom use is granted without fee provided that copies are
not made or distributed for profit or commercial advantage and that copies
bear this notice and the full citation on the first page. To copy otherwise, to
republish, to post on servers or to redistribute to lists, requires prior specific
permission.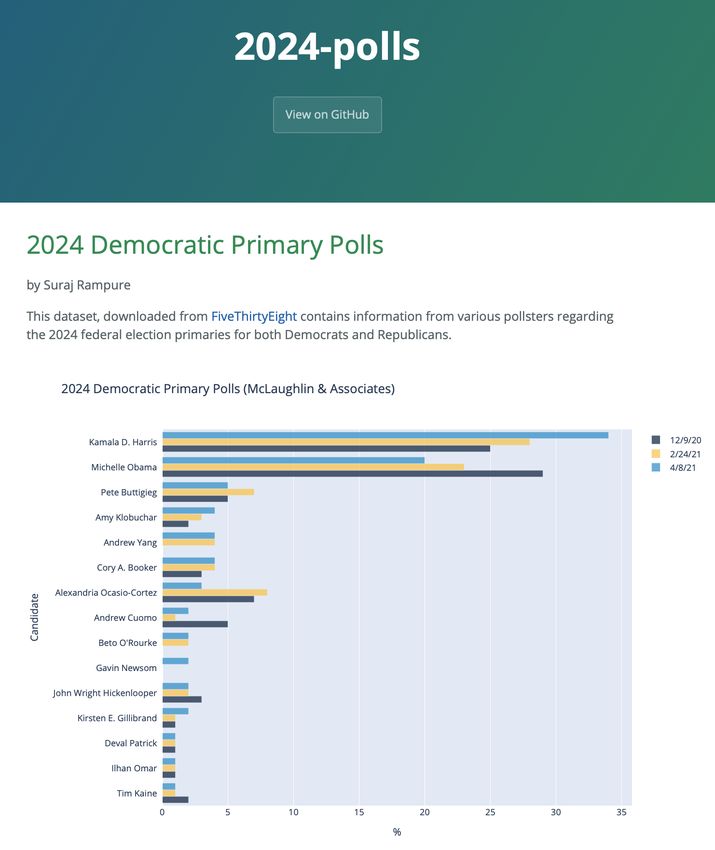
A New Data-Focused Introductory Programming Course

                                   by Suraj Rampure

                                   Research Project

Submitted to the Department of Electrical Engineering and Computer Sciences,
University of California at Berkeley, in partial satisfaction of the requirements for the
degree of Master of Science, Plan II.

Approval for the Report and Comprehensive Examination:

                                        Committee:

                                    Professor Josh Hug

                                     Research Advisor

                                       May 13, 2021
                                           (Date)

                                        * * * * * * *

                                  Professor Ani Adhikari

                                      Second Reader

                                       May 14, 2021
                                           (Date)
A New Data-Focused Introductory Programming
Course
Suraj Rampure
May 14th, 2021

  Many universities are creating undergraduate data science curriculum
  in order to fulfill increasing demand in industry for quantitative skills
  across disciplines. The first such course is often an "Introduction to
  Data Science" course that provides an introduction to computation
  and statistics in a single semester. At some schools – UC Berkeley in
  particular – this course can be quite large and consist of a student
  population with varying levels of prior experience in the field. Some
  students, particularly those without prior computing experience, can
  feel intimidated and hesitate to take such courses, even though they
  often are designed without any prerequisites.
     We identified an opportunity for a small-scale pre-introductory data
  science course focusing on computational thinking rather than data
  science as a whole, with the goal of encouraging students to pursue
  data science further while equipping them with the confidence and
  skills to do so. We designed and taught such a course in Spring 2021 at
  Berkeley to a class of 18 students. All 18 students reported being happy
  or very happy to have taken the course, and many plan on pursuing
  data science further in some capacity.

1 Introduction

Undergraduate data science programs and courses have exploded
in popularity over the past several years, complementing a longer-
term trend of increased demand for computer science coursework
[6]. While there have been some efforts to standardize how under-
graduate data science majors are structured [41], such programs vary
significantly between institutions based on a variety of factors – spon-
soring department, target audience, and program size, to name a few.
However, in most of these programs, the first course that students are
required to take is some sort of "Introduction to Data Science" course.

   As such courses courses exist to introduce students to the field of
data science as a whole, they generally serve as an introduction to
both computing and statistics. At many universities, including UC
Berkeley, such courses do not prevent students with prior experience
in either field from taking the course. Evidence shows that students
with prior programming experience tend to be more confident and
perform better in such courses compared to students without prior
programming experience [32, 43, 5], who can feel intimated by their
peers’ expertise on Day 1. To address this issue at Berkeley, we de-
signed and taught a new pre-introductory course that largely focused
a new data-focused introductory programming course                 2

on programming in the context of data science, rather than on core
"data science" content.

  This report is organized into four main sections.

• Section 2 discusses Data 8, Foundations of Data Science, the intro-
  ductory data science course at Berkeley.

• Section 3 details the design of Data 94, Introduction to Computa-
  tional Thinking with Data, a new course which serves as the basis
  for this report.

• Section 4 highlights the key differences between Data 94 and Data
  8.

• Section 5 shows the results of some preliminary analyses of stu-
  dent survey data from the pilot offering of Data 94.

2 Foundations of Data Science

Data 8 [12], Foundations of Data Science, is the introductory under-
graduate data science course at Berkeley. It was piloted in Fall 2015
[38] by a team of Statistics and Electrical Engineering and Computer
Sciences faculty, led by Ani Adhikari and John DeNero. It is designed
to introduce students to computational and inferential thinking in the
context of real-world examples. It has no prerequisites and is aimed
at a lower-division audience, though junior and senior students reg-
ularly take the course as well (see Figure 1). All students pursuing a
major or minor in Data Science must take Data 8.

2.1 Course Content
Data 8 is organized into three modules. This split is discussed at the
start of the semester in a regular offering of the course and is also
how the EdX offering of the course [19] is divided.                      Figure 1: Distribution of class
   In Table 1, we present an overview of the key topics covered each     standing in the Spring 2021
week, as of the Spring 2021 offering of the course. Non-summer           offering of Data 8.
Berkeley semesters are 15 weeks long; Week 10 is omitted due to
Spring Break. A more detailed syllabus can be found on the Data 8
website [12].
a new data-focused introductory programming course   3

 Module               Topics
                      • Week 1: Introduction
 Computation          • Week 2: Tables and Data Types
                      • Week 3: Scatter Plots, Line Plots, and Bar Plots
                      • Week 4: Histograms, Functions, Applying and Grouping
                      • Week 5: Pivoting and Joining
                      • Week 6: Iteration, Conditional Statements, Probability,
 Inference            and Sampling
                      • Week 7: Hypothesis Testing
                      • Week 8: Causality and Review (Midterm Week)
                      • Week 9: Confidence Intervals
                      • Week 11: Variance and Sampling Distributions
                      • Week 12: Correlation and Simple Linear Regression
 Prediction           • Week 13: Residuals and Regression Inference
                      • Week 14: Classification, k-Nearest Neighbors, Bayes’
                      Rule
                      • Week 14: Conclusion

                   Table 1: Topics covered in Data 8.

   Here, we focus on the first module as it is most relevant to the
current discussion. All of the programming in Data 8 is done in
Python in the Jupyter Notebook environment. The course teaches
using datascience [4], a library created by course staff specifically
for teaching tabular manipulation, instead of pandas, which is often
used in more advanced courses and in industry.
   Students are introduced to tables, the central data structure in
data science, as early as the third class session. While this is now
common in introductory data science courses [18, 44] (in large part
because of Data 8 itself), this is a markedly different approach than
more traditional introductory programming courses, where students
are introduced to more sophisticated data structures later on in the
course. This choice is well-justified – Data 8 is a data science course
first and foremost, and it’s quite difficult to talk about data science
without knowing how to look at data.
   In Data 8, core programming concepts are only brought up as
they are made relevant, rather than all at the start. For example, the
concept of defining a function does not appear until after students
have learned how to create visualizations; it is introduced in the
context of applying a procedure to every element of a column in a
table. Similarly, students are introduced to for loops at the same time
they are taught about statistical simulations, at the start of the second
module.
   A consequence of this approach is that only the programming con-
cepts that are absolutely necessary for basic tabular data analysis and
a new data-focused introductory programming course 4
inference are taught. While a traditional introductory programming
course would teach while loops, other data structures such as dictio-
naries, and recursion, Data 8 covers only what is necessary and saves
the remaining time for an in-depth treatment of inference.
Most of the computational foundations in the course are estab-
lished in the first module, with the exception of iteration, which is
introduced in the second module and used quite frequently through-
out the rest of the course.
2.2 Course Demographics
Despite being designed for students without programming and
statistics experience, a considerable fraction of students in Data 8
each semester have experience in either or both. Specifically:
• 813/1395 (58%) of students in the Spring 2021 offering reported
having taken a programming course before Data 8 (including high
Figure 2: Distribution of self-
school courses, such as AP Computer Science)
reported programming ability
• 553/1395 (40%) of students in the Spring 2021 offering reported at the start of the semester in
having taken both a programming course and a statistics course the Spring 2021 offering of Data
before Data 8 (including high school courses) 8.
Studies have shown [32, 43, 5] that students with prior program-
ming experience outperform students without prior programming
experience in introductory programming courses. This phenomenon
is relevant here even though Data 8 is not an introductory program-
ming course, rather, a course that introduces programming as part of
a broader goal.
We have evidence, provided in Section 5, that some subset of the
student population at Berkeley is interested in the course but hasn’t
considered enrolling due to its large size; recent semesters have seen
enrollments of over 1300 students. Given the existing landscape,
we hypothesized that a new, smaller-scale pre-introductory course
would benefit students without prior programming experience, who
otherwise would have struggled in or not have considered taking
Data 8. In more traditional introductory programming courses, this
approach has shown to be helpful in strengthening the confidence
and abilities of such students [37].
3 Course Design
In order to help prepare students for Data 8, we developed and
taught a new course, Introduction to Computational Thinking with Data,
listed as Data 94 [25] in Spring 2021. This section of the report details
the goals and design of this course.a new data-focused introductory programming course 5 3.1 Course Goals We designed Data 94 around two main goals: 1. Entice students to study data science further. 2. Prepare and build confidence in students for when they pursue further data science coursework. While developing course materials, a tangential goal arose – give students the tools they need to work on projects of their own without having to take any future coursework. Such a course could serve as an alternative for non-STEM students to CS 10 [9], Berkeley’s instantiation of The Beauty and Joy of Computing [20], and CS 61A [8], Structure and Interpretation of Computer Programs, Berkeley’s first required course for CS majors. The former is often recommended as preparation for the latter for students without prior programming experience. It should be noted that Introduction to Computational Thinking with Data was taught at Berkeley twice prior to our offering. In Summer 2017, the course was taught as Data 8R [13] by Henry Milner, as part of the Summer Bridge program for incoming freshmen [39]; materials from this offering can be found at http://data8r.org. In Summer 2020, the course was revived by a team led by Ian Castro, and was taught with the label Data 6 specifically for students in the SEED Scholars program, which supports STEM students from historically underrepresented backgrounds [23]. These prior offerings served largely the same purpose as our course, though they differed in their approach. While we developed content from the ground up, we referenced material from Data 6, Data 8, CS 61A, and CS 10 at Berkeley, as well as CS 106A: Program- ming Methodologies at Stanford [10] and CSE 160: Data Programming at the University of Washington [11]. 3.2 Syllabus As shown in Table 2, the course was divided into three main mod- ules, with a fourth "Special Topics" module at the end. This delin- eation was made explicit at the start of the semester and was revis- ited each time the course transitioned from one module to the next.
a new data-focused introductory programming course   6

 Module                Topics
                       • Week 1: Introduction and Arithmetic
 Python
                       • Week 2: Variables, Boolean Expressions, and Functions
 Fundamentals
                       • Week 3: Conditional Statements, While Loops, Lists, and
                       Strings
                       • Week 4: Review, Quiz 1
                       • Week 5: For Loops
                       • Week 6: Dictionaries, File Formats, and NumPy
 Table
                       • Week 7: Table Fundamentals
 Manipulation
                       • Week 8: Applying, Grouping, Pivoting, and Joining
                       • Week 9: Review, Quiz 2
                       • Week 11: Encodings, Bar Plots, and Histograms
 Visualization         • Week 12: Scatter Plots, Line Plots, and Maps
                       • Week 13: Review, Quiz 3
                       • Week 14: Randomness, Simulations, and Creating Web-
 Special Topics        sites
                       • Week 15: Human Context & Ethics, Conclusion

                  Table 2: Topics covered in Data 94.

3.3 Course Format
Most computing and data science courses at Berkeley, including Data
8, serve hundreds of students per semester. The pilot offering of Data
94 was much smaller; we set the enrollment cap to 30 students, and
had 18 students by the end of the semester. This allowed us to focus
our efforts on content and pedagogy without having to consider is-
sues of scale, while also providing students with a small, personable
learning environment that they wouldn’t have been able to experi-
ence in larger courses.
   Over the next few subsections, we’ll briefly discuss key compo-
nents of the course. A guiding design principle was the University of
California’s official guidance [2] that a course worth n units should
not take students more than 3n hours per week on average, including
class time. (This principle is not adhered to by many computing and
data science courses at Berkeley.) As our course was listed for 3 units,
we wanted students to spend no more than 9 hours per week on it on
average, and devised the following breakdown:

• 3 hours of lecture

• 1 hour of lab

• 5 hours of work on assignments, including time spent in office
  hours
a new data-focused introductory programming course 7 A more detailed description of each course component can be found at the student-facing syllabus, http://data94.org/syllabus/. • Lectures, active learning, and readings The course was developed during the COVID-19 pandemic, which gave us flexibility with how to structure the course. While we considered offering lectures asynchronously as a series of pre- recorded lecture videos with conceptual questions in between [22], we ultimately decided to deliver lectures synchronously. This gave us the flexibility to make changes to pace and content ad-hoc while building a stronger personal relationship with students than we may have otherwise, especially given the small class size. We delivered three 50 minute lectures each week. Most of the lecturing itself contained a mix of slides and live coding as is com- mon in other similar courses. In order to promote active learning Figure 3: Example Quick Check [30, 31], each lecture contained a few breaks for students to an- on EdStem (taken from Lecture swer short questions, called Quick Checks. These questions were 14). either short answer or multiple choice, and were graded on com- pleteness, not correctness. After giving students a few minutes to answer a question, we’d take up the solution by asking students for their approaches. We encouraged students to fill them out dur- ing the allocated time in class so that they could benefit more from the discussion, though there was no penalty for completing them afterwards; on average, 60%-70% of students filled them out in class. Quick Checks were hosted on the EdStem [17] platform (see Figure 3), and like lecture attendance, were as a whole worth 5% of students’ grades in the course. As the course contained a mix of traditionally covered in multiple courses, there was no single textbook that followed the course. Instead, we linked relevant readings whenever possible. The most common sources were https://inferentialthinking.com, the textbook for Data 8, and https://cs.stanford.edu/people/ nick/py/, the course notes for Stanford’s CS 106A (Programming Methodologies); the former was referenced for table methods and visualization, and the latter was often referenced for core Python fundamentals, as we felt that it provided an accessible treatment of the relevant material. • Lab sections To supplement lecture, we hosted a 50 minute lab section each week, held immediately after lectures on Friday. Unlike other sim- ilar courses at Berkeley, Data 94 had no "lab assignment" – rather, the goal of the lab section was to give students a head start on the
a new data-focused introductory programming course             8

  week’s homework assignment, which was generally released the
  day before lab.
  The first 20 minutes of lab consisted of the course TA walking
  through a practical demo using that week’s material; this was done
  to give students a second look at relevant concepts before they’d
  need to apply them on their own. In the final 30 minutes, students
  were put in breakout rooms with roughly 4 other students and a
  member of course staff. Here, students were encouraged to start
  working on the homework assignment and to ask any questions
  that arose to their peers and assigned helper. Breakout rooms were
  randomized each week.

3.4 Assignments
Students spent the majority of their time in the course in most weeks
completing homework assignments. Students accessed assignments
by clicking links on the course website that would bring them to
DataHub [42], a service that provides cloud-hosted Jupyter Notebook
servers for all members of the Berkeley community. Used by most
data science courses at Berkeley, DataHub allowed students to dive
right into writing code without needing to worry about environment
setup.
   Assignments consisted of a mix of programming problems (see
Figure 4) and written interpretation questions, as in Data 8 and other
similar courses. After completing an assignment, students would          Figure 4: Example program-
download their notebook as an .ipynb file and upload it to Grade-        ming problem (taken from
scope [15], where their code would be autograded (using public test      Homework 5).
cases) and their answers to written questions would be extracted into
a separate PDF for human grading. We used Otter-Grader [33] to
facilitate the autograding of these Jupyter Notebooks.
   9 homework assignments were released throughout the semester.
We released homeworks roughly once a week, but gave students
additional time to work on them during quiz weeks. A typical week
would see a homework released on Thursday and due the following
Thursday; such a homework would only include content from the
week in which it was released.
   In Table 3, we show a summary of the topics covered in each
homework, and the datasets used if applicable.
a new data-focused introductory programming course                     9

 HW #      Topics                                 Datasets
 1         Boolean Expressions and Func-          COVID cases
           tions
 2         If-Statements, While Loops, Lists,     N/A
           and Strings
 3         Review and For Loops                   Billboard music charts
 4         Dictionaries and NumPy Arrays          Google Maps API queries,
                                                  State of the Union ad-
                                                  dresses, and Images
 5         Table Fundamentals (Sorting and        2020 Berkeley Freshman
           Filtering)                             Admissions
 6         Grouping, Pivoting, and Joining        2020 Restaurant Ratings
 7         Bar Plots and Histograms               Antarctic Penguins [26]
 8         Scatter Plots, Line Plots, and Maps    SFO Flights
 9         Create a Website                       Bring-your-own-dataset

             Table 3: Homework assignments in Data 94.

   It should be noted that in Homeworks 1 through 4, students did
not yet know how to use tables. As such, the datasets served to ex-
pose students to core programming concepts in a way that was mo-
tivated by real data; see Section 4.1 for a detailed discussion of this
approach.
   Homework 9 was an outlier. Instead of answering questions about
preselected datasets, students followed a tutorial [24] to find a dataset
on their own, create a visualization from it, and host it on a website
(using GitHub Pages [21]) along with explanatory text.

3.5 Assessments
In lieu of a traditional midterm, we held a quiz at the end of each of
the first three modules, each worth 5% of students’ grades. As such,
Quiz 1 was designed to assess students’ understanding of the first
                                                                             Figure 5: Website created in
module. However, after covering while loops and lists, we realized
                                                                             the tutorial for Homework 9;
that we hadn’t allocated enough time in lecture for these concepts
                                                                             students created similar sites.
to really sink in with students, and decided to spend a few lectures
reviewing rather than covering more material before the quiz. As
a result, Quiz 1 only covered material through lists, and did not
include for loops, a topic in the first module.
   Quiz 1 was administered in the form of a Jupyter Notebook; this
was done to have students program in the environment they were
comfortable with [7, 28] from homeworks. Unlike homeworks, Quiz
1 had hidden tests that students were not shown while working.
After students submitted Quiz 1, we discovered a major flaw with
the format. Since students were still getting accustomed to Python
a new data-focused introductory programming course 10
syntax, most submissions contained multiple syntax errors which
rendered the autograder practically useless. As a result, we had to
manually grade all submissions in order to assign partial credit, and
decided to use a different format for assessments moving forward.
For Quiz 2, Quiz 3, and the Final Exam, we used Gradescope’s on-
line assignments functionality (see Figure 6). This enabled us to mix
multiple choice, short answer, and free response problems, allow-
ing us to ask both conceptual and programming questions. Though
the platform did not support code autograding, the limited scale of
the course made it possible for us to grade all submissions and pro-
vide feedback relatively quickly. Since the format was brand-new, we
provided students with "practice quizzes" before Quizzes 2 and 3 in
order to familiarize them with the format.
Quizzes were always held on Fridays during lecture, giving stu-
dents 50 minutes to complete them. On the Monday and Wednesday
before each quiz, we spent lecture reviewing relevant topics and,
when applicable, taking up the practice quiz. Since lab sections were
also on Fridays, we gave students a chance to debrief and discuss the Figure 6: Example problem
quiz in their breakout rooms afterwards. from Quiz 2, using Grade-
scope’s online assessments
4 Key Differences from Data 8 functionality.
While the topics in Data 94 overlapped with those in Data 8, there
was a noticeable difference in the order in which these topics were
introduced, and in many cases, the depth to which they were dis-
cussed. In addition, a sizeable amount of content in Data 94 is not
covered at all in Data 8, and vice versa – very little from the umbrel-
las of inference and prediction was covered in Data 94, save for two
special-topics lectures towards the end on randomness and simula-
tion.
In this section, we present some of the key differences between
the content of Data 94 and Data 8, with an emphasis on the ideas
that were covered in Data 94. In 4.4, we discuss why we believe the
content in Data 94 will complement – not replace or clash with – the
content in Data 8 for students who decide to take it afterwards.
There are several references to assignments and lectures; all con-
tent can be found on the aforementioned course website, and pub-
lic code links can be found at https://github.com/surajrampure/
data-94-sp21.
4.1 Placement of Tables
Perhaps the largest difference between Data 94 and Data 8 was the
placement of tables. In Data 8, tables are introduced in Week 2 [29],
at the same time that the anatomy of a function call is discussed.a new data-focused introductory programming course 11
In Data 94, tables were not touched at all until Week 7 [40], well
after students were introduced to other ideas in programming. We
spent the first module establishing more traditional fundamental
computing skills before transitioning to tabular manipulation, hoping
that students would grasp tabular manipulation more easily in this
manner. As evidenced in Section 5, by the end of the semester in the
pilot offering, students felt much more comfortable with tables than
they did with content from the first module.
However, this approach prohibited us from focusing on tabular
data early on, which made it challenging to motivate some of the
earlier ideas in the course given that students signed up to take a
"data science" course. There were a few solutions to this; here, we
discuss some of them in the context of homework assignments.
• Using visualizations
Occasionally, we would ask students to write a function that per-
formed some task that was not directly linked to any table or
visualization. After they implemented the necessary behavior, they
would run a pre-populated cell that loaded in a dataset and cre-
ated a visualization that was in some way related to the function
they just wrote.
There were a few of these examples in the very first homework
of the semester, Homework 1, where we thought it would be ex-
tremely important to capture students’ interests. One such exam-
ple had them compute an individual’s Body Mass Index (BMI)
given their height in inches and weight in pounds.
def bmi_from_in_lb(height_in, weight_lb):
# SOLUTION denotes a line that students had
# to write on their own
height_m = height_in * in_to_cm * cm_to_m # SOLUTION
mass_kg = weight_lb * lb_to_kg # SOLUTION
bmi = mass_kg / (height_m ** 2) # SOLUTION
return bmi
The interactive visualization created afterwards, shown in Fig-
ure 7, depicts the relationship between the weight, height, and
BMI of several individuals whose measurements we read in from
a CSV file. Students were not responsible for the mechanics of
loading in the data or creating the visualization at that point in Figure 7: Scatter plot shown
the course, though they became familiar with these steps later on. to students in Homework
They were, however, asked an interpretation question to the effect 1 after they implemented
of "as height increases, does BMI tend to increase or decrease?" bmi_from_in_lb.
Such questions are commonplace in data science coursework.a new data-focused introductory programming course 12
Another example in Homework 1 had students work towards
drawing a line graph of the number of COVID-19 cases in Sweden
in November 2020.
• Using interactivity
While the aforementioned visualizations supported some inter-
activity (e.g. hovering and dynamic resizing) by virtue of being
created using plotly [34], we also used ipywidgets [27] to create
engaging interfaces that used students’ functions.
For instance, in Homework 4, we asked students to create a dictio-
nary that mapped five specified keywords to emojis of their choice.
They then had to create a function that would take a string and
replace all instances of the specified keywords with their corre-
sponding emojis.
def emojify(message):
# This line ensures your code replaces correctly if any of
# the keys in fav_emojis appears in uppercase in the message
message = message.lower()
# BEGIN SOLUTION
for emoji in fav_emojis:
if emoji in message:
message = message.replace(emoji, fav_emojis[emoji])
# END SOLUTION
# Don't change this
return message
Afterwards, students ran a cell to generate an interactive text box
that dynamically applied their implementation of emojify to their
input text. The code that enabled this behavior was remarkably
short.
Figure 8: Interactive text box
def emojify_live(type_here): in Homework 4 shown to stu-
display(HTML('' + emojify(type_here) + '')) dents after they implemented
interact(emojify_live, type_here="I LOVE food"); emojify.
Figure 8 shows a snapshot of the final product. Another such ex-
ample, also in Homework 4, had students use np.dot and np.mean
to replicate popular image filters such as greyscale and sepia.
Through functionality enabled by ipywidgets, students were able
to upload their own images to see the results of their filters.
4.2 Additional Programming Constructs and Data Structures
In line with our course’s title, Introduction to Computational Thinking
with Data, we incorporated more traditional programming constructsa new data-focused introductory programming course 13
than are covered in Data 8, in order to build students’ computational
thinking skills.
Before covering tables, we introduced three key ideas that aren’t
covered or emphasized in Data 8.
• While loops
We covered while loops after covering basic control flow (i.e. if-
statements), as is done in a few other introductory computing
courses, including CS 61A [8] and Stanford’s CS 106A [10].
We used while loops as an opportunity to introduce the idea of
tracing code. Figure 9 shows the hand-written notes in class for
the following example.
def sum_first_n(n):
Figure 9: Screenshot of class
j = 1
notes in which we traced the
total = 0
execution of sum_first_n.
while ja new data-focused introductory programming course 14
In Data 94, lists were introduced well before NumPy arrays. In-
dexing and slicing were introduced as core list behavior. This
approach had a few benefits:
– When we introduced tables, the idea of selecting rows and
columns by their numerical index (e.g. extracting the first col-
umn of a table with tbl.column(0)) was not new, and rather a
natural extension of material that had been presented before.
This is opposed to Data 8, where zero-based indexing is only
introduced in the context of selecting a subset of rows.
– It enabled us to discuss string indexing, which was introduced
in the same lecture as lists. String indexing, and string meth-
ods more generally, appeared quite frequently throughout the
semester, especially in the context of data cleaning. Indexed-
based string methods, such as the example from Homework 2
below, do not appear in Data 8.
def extract(s, char):
# Check for the number of occurrences of char here
# BEGIN SOLUTION
if s.count(char) != 2:
return ''
# END SOLUTION
pos1 = s.index(char) # SOLUTION
pos2 = s.rfind(char) # SOLUTION
return s[pos1 + 1 : pos2] # SOLUTION
>>> extract('510-642-1000','-')
'642'
– It allowed us to discuss the differences between lists and NumPy
arrays in-depth. When discussing lists and loops, we covered
several examples involving applying some arithmetic procedure
to every element of a list. When introducing NumPy arrays,
then, we were able to highlight the power of NumPy arrays
for such tasks. The example below is taken from the lecture in
which NumPy arrays were introduced.
c_temps = [17, 18, 22, -4.5, 15, 9, 0, 3, 8]
# Using vanilla lists:
f_temps = []
for c in c_temps:
f = (9 / 5) * c + 32
f_temps.append(f)
# Using arrays: no for loop!
f_temps_arr = (9 / 5) * np.array(c_temps) + 32a new data-focused introductory programming course 15
Furthermore, in Data 8, students create new NumPy arrays
using the function make_array built into datascience. Its imple-
mentation [14] is shown below.
def make_array(*elements):
return np.array(elements)
This function largely exists to circumvent the fact that instan-
tiating NumPy arrays normally requires code of the form
np.array([...]), which may appear foreign to students due
to the double brackets. In Data 94, we explicitly addressed this
issue; see Figure 10.
Students found array operations to be more straightforward
than list operations, likely because the latter required iteration.
Figure 10: Slide from lecture
By the end of the semester, students did not have issues with
in which NumPy arrays were
the syntax for creating and interfacing with both lists and arrays
introduced, explaining how
(and, by extension, strings).
new NumPy arrays are created
• Dictionaries from lists.
Like while loops, dictionaries are not touched at all in Data 8. In
Data 94, they appeared during a transitory week where we were
moving from core Python constructs to explicitly data-centric pro-
gramming. The inclusion of dictionaries also had several benefits:
– Dictionaries allowed us to have meaningful discussions compar-
ing index-based and key-based data structures, which we found
to be valuable in progressing towards our goal of building com-
putational thinking skills. We hoped that this would make the
transition to tables smooth, as tables are also key-based data
structures (though we did not introduce tables with that exact
terminology).
– Dictionaries also served as a host for a variety of engaging ex-
amples; in addition to the emojify example from Figure 8, we
used real data in multiple dictionary examples. The example
shown in Figure 11, taken from the lecture introducing dictio-
naries, involved converting a dictionary containing mappings
from area codes to states to a dictionary with mappings from
states to lists of area codes.
– Lastly, the coverage of dictionaries enabled us to discuss differ- Figure 11: Screenshot from
ent forms of stored data. In a lecture dedicated to file formats, lecture video covering "Area
we introduced both the CSV and JSON formats, and stated that Codes", a rich application of
while the vast majority of data we will deal with is tabular in dictionaries using real data.
nature and stored as a CSV, JSON is also a common file format The video can be found at
and is intimately tied to the dictionary data structure that we https://www.youtube.com/
covered earlier. We used the example of a family tree to illus- watch?v=9Buj7RslMno.
trate hierarchical data.a new data-focused introductory programming course 16
The corresponding homework assignment had students load
in a JSON file generated by a call to the Google Maps API, and
index into its dictionary representation to extract the latitude of
a business.
4.3 Placement of Visualization
In Data 8, visualization techniques are introduced alongside core
table manipulation techniques. Students are taught how to sort and
filter tables, then taught to create select visualizations, and finally are
taught about applying, grouping, pivoting, and joining (see Figure
12, which shows a few chapters of Data 8’s textbook, which Data 8
follows directly). Some of the latter ideas are introduced in the visu-
alization unit and are reinforced until later. The motivation for this
is clear – in practice, visualization complements table manipulation
when performing exploratory data analysis. Furthermore, visual-
ization is engaging, as students can see the results of their work in
satisfying ways.
Data 94 followed a different approach. Our second module con-
sisted solely of table manipulation, with the goal being to build stu-
dents’ familiarity with table methods before moving to visualization.
As such, we used the visualization module as a way to reinforce sev-
eral table methods, rather than introduce them for the first time. As
is discussed in Section 5, students found the visualization module to
be the easiest of the three core modules in the course, by far. Notable
differences between Data 94 and Data 8 with regards to visualization
Figure 12: Index of
are enumerated below.
Chapters 6 through 8 of
• Different order inferentialthinking.com,
the textbook for Data 8.
While we largely covered the same specific visualization tech-
niques that are taught in Data 8 – bar plots, histograms, scatter
plots, and line plots – we introduced them in a slightly different
order.
In Data 8, scatter plots and line plots are introduced before bar
plots and histograms. In this approach, students are introduced
to multiple plots they are likely more familiar with from earlier
schooling before they are introduced to histograms, which have
far more nuance. We tried a different approach – we covered bar
plots, then histograms, and then scatter and line plots, with the in-
tention of discussing single variable distributions before discussing
relationships between two variables. This approach was influenced
by Data 100 [35], the followup course to Data 8.
• Lighter treatment of histogramsa new data-focused introductory programming course 17 We did not cover histograms in as much detail as Data 8 does. Specifically, we only covered frequency-based histograms, while Data 8 teaches density-based histograms. We did this to avoid calculations that students often find challenging in Data 8, specifi- cally, thinking about proportions as areas and, by extension, areas under curves. We told students that they would study histograms in more detail in Data 8; we felt that this trade-off was worthwhile, as most histograms in the real-world are frequency-based. • plotly instead of matplotlib The datascience module recently built in support for plotly, which we used instead of the historical default matplotlib. This allowed us to create rich, interactive visualizations that we be- lieved would excite students more than the static plots created by the matplotlib. However, to call the standard visualization meth- ods built into datascience – .barh, .hist, .scatter, and .plot – students did not need to know any specifics about how their vi- sualizations were created, since these methods worked directly on their tables. We spent time talking about the differences between plotly and matplotlib to make them aware of the technology underpinning their work. We also dedicated a lecture to using plotly directly, allowing us to expose students to visualization techniques that aren’t built into datascience (such as pie charts and animated scatter plots). In previous semesters, we were part of the team that taught Data 100. Then, we hesitated to move to plotly, as plotly visualiza- tions don’t appear in the automatically-generated PDFs of stu- dents’ written work that are created by existing infrastructure, meaning that they could not be manually graded. However, we were able to create a lightweight solution that doesn’t involve changing any infrastructure, and we recommend others use it moving forward. • Maps The datascience package now supports mapping functionality through a folium backend. In Data 8, mapping is covered in the Figure 13: Example map cre- textbook and used for an example in lecture, though it does not ated in lecture, describing the currently appear in any assignments. In Data 94, we dedicated an year in which each Walmart in entire lecture to creating maps with various markers (see Figure California was opened. 13 for an example), and students created multiple maps in Home- work 8, the second homework dedicated to visualization.
a new data-focused introductory programming course   18

4.4 Relationship to Data 8
In Data 94, we presented many ideas that are also presented in Data
8 but with a different approach, and covered topics that don’t appear
in Data 8 at all. This is not because we disapproved of Data 8 and
wanted to replace it, but rather because our course was designed
to serve different goals than Data 8, one of which was essentially to
prepare students for Data 8 itself. As such, we believe that our choice
and presentation of content will benefit students if and when they
take Data 8.
   Most of the Python fundamentals, table manipulation, and visu-
alization introduced in the first module of Data 8 will be review for
Data 94 students; even though we covered this material in a differ-
ent order than Data 8 does, the actual coverage of the overlapping
content from lecture to lecture was similar. This would allow stu-
dents who go on from Data 94 to Data 8 to focus on details in the
first module of Data 8 that we omitted in Data 94, such as interpret-
ing data in the context of the real-world and a detailed coverage of
histograms, without getting lost in syntax. By starting off strong in
Data 8, these students will ideally gain confidence in their ability to
succeed in Data 8 and beyond.
   Starting Week 6 in Data 8, almost all of the material will be new
to Data 94 students. From that point forward, they will be more
experienced programmers than they otherwise would have been, and
will be able to spend their time developing a deep understanding
of the inference and prediction that is presented rather than still
discovering the nuances of Python. This is especially important as the
material from the latter two modules of Data 8 is heavily relied on by
more advanced courses that require Data 8 as a prerequisite.
   Students will still be introduced to new programming paradigms
from Week 6 of Data 8 onwards, and their experiences from Data 94
will only help them. For example, a common use of for loops in Data
8 is to create a NumPy array storing the results of many simulations
of some process – for example, bootstrap resampling and computing
a statistic for each bootstrapped sample. While we did not cover
this specific process in Data 94, we covered several other instances
of the accumulator pattern [3], which students will be able to draw
parallels to. More broadly, the additional computational thinking
experience will allow students to decompose problems and identify
logical errors in their code more easily.
   It’s worth noting that none of the content in Data 94 "clashed" with
content in Data 8. There are two examples where we covered specific
ideas in a markedly different way than Data 8:

• Histograms – students were told that they will see a different,
a new data-focused introductory programming course   19

  more sophisticated version of histograms in Data 8. Many of the
  high-level ideas from Data 94’s treatment of histograms remain
  the same, such as the concept of binning and the fact that the
  distribution within a bin is unknown when looking at a histogram.
  We believe that the Data 8 treatment of histograms will not feel
  foreign, but rather like a natural extension of what students are
  already familiar with.

• Creating arrays – as was discussed in Section 4.2, students were
  shown to create NumPy arrays using np.array([...]) instead
  of make_array(...), which is used heavily in Data 8. We believe
  that students will not struggle with moving from the former to the
  latter as they studied how the former works in depth, and will see
  that the latter is simply a shortcut. Furthermore, they can simply
  use the former in place of the latter.

   In both examples, we covered an idea from Data 8, just with more
or less detail. This means that students moving from Data 94 to Data
8 will still be able to leverage their prior experience when seeing
these ideas again in Data 8.
   The additional computing content in Data 94 that doesn’t appear
in Data 8 – while loops, lists (in detail), dictionaries, file formats,
creating websites – will not hinder students’ ability to understand
concepts in Data 8, but will broaden their perspectives on what the
field of data science entails as a whole.
   It should be noted that neither of our two primary goals intro-
duced in Section 3.1 mentioned programming or computing. While
we could’ve created a pre-introductory data science course that fo-
cused on inference and prediction rather than computation, our
impression was that students feel like the most intimidating and
challenging aspect of Data 8 is the programming, not the inference
and prediction.

5 Survey Analysis

Alongside each homework assignment, we released a survey that
asked students to indicate their level of familiarity with the latest
lecture content and to give feedback on the current homework; reg-
ular surveys have been shown to provide insightful information in
previous studies [36]. In surveys following a quiz, we also asked for
their feedback on the length and difficulty of the quiz they had just
completed. The final survey of the semester was due right before the
final exam and asked students for their comfort level with each of the
key topics in the course.
   In this section, we will use the data from the above surveys along
a new data-focused introductory programming course   20

with the enrollment application for the course to assess the progress
we made towards achieving our design goals and identify areas for
improvement in future offerings. There are a few notable limita-
tions of our analysis – namely, we don’t have information on what
students did and how they performed in subsequent courses after
Data 94, nor do we have their final exam scores and hence their let-
ter grades in Data 94. This is due to the timeline of this project; this
report was largely written before the final exam for the course.

5.1 Enrollment
In order to receive a spot in the pilot offering of the course, students
had to fill out an application. The application asked students to an-
swer the following questions, as well as to provide their transcripts:

• Have you ever programmed before? If yes, please elaborate.

• What is your expected graduation semester?

• Why do you want to take this class? (Answer in two sentences or
  less.)

   Only the first two questions factored into whether or not students
were accepted. The first question was asked to ensure that only stu-
dents without prior programming experience were in the course,
as this was our target audience. As one of the overarching goals of
the course was to encourage students to pursue more data science
coursework, Data 8 in particular, we reserved 22 of the 30 seats in the
course for non-seniors, who we filtered via the second question. (This
constraint ended up being irrelevant as fewer than 30 students ended
up in the course.) Students who met the criteria were admitted on a
first-come-first-serve basis.
   Overall, 62 students applied to enroll in the course. Of those, 21
had prior experience of some sort (through a course or self-study)
and were denied. All 41 other students were offered a seat; roughly
25 were in the class by the first week, and 18 were in the class for the
final exam.
   Below, we present a few of the responses to the question "Why do
you want to take this class? (Answer in two sentences or less.)" by
students who finished the course.

• "Studying primarily humanities, I wanted to gain experience in
  another fairly unrelated sector (like coding) to help with potential
  careers, but was apprehensive about taking a large course like
  Data 8. Since I have no experience I was worried I would fail Data
  8, thus this course seems much more doable and supportive."
a new data-focused introductory programming course                 21

• "I have always wanted to learn Python and other programming
  languages, but I did not want to struggle in a class full of expert
  programmers where I lacked the basic knowledge to even pass.
  This class allows me to actually learn CS in a setting where the
  teachers understand that I am starting from ground zero."

• "I really need the small learning environment that Data 94 pro-
  vides in order to learn the basics of coding to succeed at higher
  level classes required for the Data Science Major while also being
  able to ask questions and be more involved in class."

   Of the 18 students who finished the course, 10 explicitly men-
tioned the small class size of the course as a draw in their applica-
tion. Though these numbers are relatively small on Berkeley’s scale,
we believe that there is a need for a course like Data 94 in the Berke-
ley data science ecosystem, and perhaps at other institutions with          Figure 14: Distribution of "ma-
similar programs as well.                                                   jor categories" amongst stu-
   Figure 14 shows the distribution of "major categories" of enrolled       dents enrolled in Data 94 in
students. To compute this distribution, we categorized all declared         Spring 2021.
students’ majors as being either STEM or non-STEM; we cannot show
specific majors for privacy reasons. Only 3 out of 18 students had
declared a STEM major prior to taking the course.
   As is depicted in Figure 15, 12 of the 18 enrolled students were
juniors or seniors. This is likely a consequence of how the course was
marketed; we advertised the course to the major advisors of many
non-STEM disciplines, and students who received communications
from major advisors are likely to be declared (explaining Figure 14)
and hence older.
   While older students still benefited from taking the course, they
were less likely to pursue further coursework in data science, as was
indicated by many older students in the final survey of the semester.
In the future, we’d market more to undeclared first-year and sopho-
more students.
   It is worth noting that the course was quite gender-balanced, with       Figure 15: Distribution of class
roughly 50% of students identifying as female and male, respectively.       standing amongst students
                                                                            enrolled in Data 94 in Spring
                                                                            2021.
5.2 Understanding of Content
In the final survey of the semester, students were asked to answer the
question "How well do you feel like you understand each of the top-
ics presented in class, as of right now?" in a grid consisting of 17 core
topics. Possible answers were "Don’t understand at all" (1), "Barely
understand" (2), "Understand somewhat" (3), "Understand well" (4),
and "Understand very well" (5). For the purposes of creating Figure
16, we computed the mean response per question.
a new data-focused introductory programming course 22
Figure 16: Mean self-reported
While students were generally comfortable with most topics by the level of understanding per core
end of the semester, there were a few clear trends. For one, students topic. Only topics in the first
seemed to be much more confident in their table manipulation and three modules were included.
visualization skills than they were in their core Python skills.
This is likely due to a confluence of factors.
• Over the last two months of the course, table methods were em-
phasized far more than core Python concepts were. Of note, itera-
tion did not appear very frequently; for loops appeared more often
than while loops.
• The pace of the course at the start was much quicker than the pace
after the first few weeks; it took us a while to get calibrated to the
students’ level of comfort.
• Students expressed that table methods and visualization felt "eas-
ier" since they were able to see a graphical representation of their
work at each stage.
• Students were simply more experienced programmers by the time
they reached the later topics.
However, students did not feel that the material at the start of
the semester was unimportant. In the final survey, several studentsa new data-focused introductory programming course 23
remarked that they recognized the importance of iteration in the
course and wished more time was dedicated to it.
5.3 Difficulty and Enjoyment of Assignments
As mentioned earlier, students were polled on the difficulty (on a
scale of 1 to 5) and amount of time spent on each homework assign-
ment right when they submitted it. As such, the results in Figure 17
do not reflect end-of-semester self-reflection, unlike Figure 16. Home-
work 9 is not included in these figures as it was in a different format
than the first 8 homework assignments and was significantly shorter.
It appears that students found homework assignments to be easier
as the semester progressed, which corroborates the findings in the
previous subsection. However, there is a notable outlier, Homework
6, which students spent by far the most time on and found to be the
most difficult homework, on average.
Interestingly, Homework 6 covered applying, grouping, pivoting, Figure 17: Mean reported dif-
and joining, ideas which students reported being quite comfort- ficulty and time spent per
able with by the end of the semester. Homework 6, more so than homework assignment, as per
any other assignment, pushed students outside of the boundaries of regular surveys.
what was covered in the corresponding lectures. One question asked
students to join two tables on multiple columns, when only single-
column joining was covered in lecture; though we provided several
hints, including telling students to provide a list as the first argu-
ment to .join, many students struggled with this problem. Another
paradigm that appeared multiple times in Homework 6 that did not
appear in lecture was the idea of grouping to determine categories
that satisfy certain criteria, then filtering only those categories from
the table. This is the behavior of df.filter in pandas though there is
no direct analogue in datascience. Code for one of these problems is
given below.
common_segments = chains_growth.group('Segment_Category') \
.where('count', are.above_or_equal_to(10)) \
.column('Segment_Category') # SOLUTION
common_chains = chains_growth.where('Segment_Category',
are.contained_in(common_segments)) # SOLUTION
We believe that Homework 6 positively contributed to students’
understanding of these topics, despite being perceived as more diffi-
cult on average than the other homeworks.
The bottom graph in Figure 17 shows that on average, students
spent around 4-5 hours per week on homework assignments. This
means that we largely adhered to our target of having students spend
roughly 9 hours per week on the course (see Section 3.3). In the end-a new data-focused introductory programming course 24
of-semester survey, the majority of students reported spending 7-9
hours per week on the course on average.
The end-of-semester survey also asked students for their favorite
and least favorite homework assignments of the semester. For fa-
vorite, 12 of the 15 students who answered the question answered
either Homework 4 or Homework 9, neither of which focused on
table manipulation (see Table 3). For least favorite, 6 of 15 students
answered either Homework 2 or Homework 6; Homework 6 was
discussed in detail above, and Homework 2 (a local maximum with
regards to self-reported difficulty and time spent) introduced while
loops, a known challenging topic. 7 of 15 students didn’t specify a
least favorite homework; some of these students stated that they en-
joyed all homeworks, and some stated that they didn’t enjoy many of
the earlier assignments.
5.4 Future Plans
The final survey also asked students whether they planned on pur-
suing data science further, and if so, in what capacity. As shown in
Figure 18, not many students planned on pursuing a major or minor
in Data Science at Berkeley, however the majority of students in the
course were in the second half of their undergraduate studies coming
into the course; in an open-ended question, most students noted that
they felt that they didn’t have enough time to complete either the ma-
jor or minor before graduating. However, all students reported some
interest in learning more about data science in some capacity, and
many indicated that they’d be taking domain-specific data science
courses as part of their existing field of study.
6 Conclusion
6.1 Future Work Figure 18: Distribution of the
responses to the question
Throughout this report, we identified a few areas of improvement
"Which of the following are
for future offerings. Most notably, we would spend more time on
you likely to take or pursue in
initial topics, particularly iteration, and reintroduce these ideas more
the future?" for several potential
frequently throughout the semester. To attract younger students who
pathways.
are more likely to pursue majors or minors in data science, we would
advertise the course more broadly. We also believe a more thorough
integration of ethics and social sciences content would make the
course more engaging and responsible.
While other similarly-purposed courses are offered at much larger
scales (for instance, CS 10 had 138 students in Spring 2021 [1]), and
it is logistically feasible to offer Data 94 at a much larger scale, we
believe that the small size is what enticed students to enroll in thea new data-focused introductory programming course 25 course in the first place. One possible model for scaling if the de- mand exists is to offer many smaller lecture sections of approxi- mately 30 students. This model is not common in Data Science at Berkeley, but is in practice at other institutions, including Johns Hop- kins University [16]. We hope that this report will help future instructors of the course at Berkeley understand our design decisions and the student-perceived effectiveness of our pilot offering. We also hope that instructors at other institutions with courses similar to Data 8 will use this report to identify if there is a need for a course similar to Data 94 in their school’s data science curriculum, and if so, what components from Data 94 could be adopted. All materials are available for public use; contact the author for more details. 6.2 Parting Thoughts We created Data 94, Introduction to Computational Thinking with Data, to serve as an introductory-level course that would encourage stu- dents to study data science further while preparing them to do so and instilling a level of confidence in them if they chose to. Due to the timeline of this project, we are unable to conclude how effectively we prepared students for future work in data science. However, students seem to be content with the course. On a scale of 1-5, all 18 students responded either 4 or 5 to both "How much do you feel you learned in Data 94, in terms of new ideas and skills?" and "How happy are you about your decision to take Data 94?", with a mean response of 4.95 for both. Acknowledgements While this project spanned just semester and a half, it would not have been possible without the mentorship I was privileged to receive over the course of my five years at Berkeley. I would like to thank: • Josh Hug, my advisor, without whom I would not have been pre- pared to develop this course, let alone for a career in teaching. • Ani Adhikari, my second reader, for thinking of me when this op- portunity arose, providing invaluable feedback on early drafts of this report, and for generally pushing me to be better throughout the years. • John DeNero, Fernando Pérez, Allen Shen, and the numerous others I’ve had the great fortune to teach with and learn from.
You can also read