A new decade for social changes - Vol. 28, 2022 - www.techniumscience.com
←
→
Page content transcription
If your browser does not render page correctly, please read the page content below
Vol. 28, 2022

 A new decade
for social changes

 ISSN 2668-7798

 www.techniumscience.com
 9 772668 779000
Technium Social Sciences Journal
 Vol. 28, 522-538, February, 2022
 ISSN: 2668-7798
 www.techniumscience.com

Indonesian Generation Z Consumer Ethnocentrism on Food
and Beverage Product

 Reny Andriyanty1, Dodi Wahab2
 Institut Bisnis dan Informatika (IBI) Kosgoro 1957 Jakarta Indonesia

 reny_andriyanty@ibi-k57.ac.id, Dodiwahab66@gmail.com

 Abstract. Generation Z is a huge potential in Indonesia economy. They hold important role in
 the domestic product consumption. The research objective to determine the consumer
 ethnocentrism of Indonesian generation Z attitude towards consumption of domestic food and
 beverage products in terms of economic, individual, lifestyle, pro-social motivation, threat
 perception, and buying inertia. This study used a quantitative descriptive method with 431
 samples. The data were analyzed with mutlivariance equations through structural equation
 modeling. The results showed that economic factors have a significant and positive direct effect
 to the lifestyle of Generation Z in Indonesia. Individual factors had also a significant and positive
 direct effect to the lifestyle. Lifestyle had a significant and positive direct effect to the consumer
 ethnocentrism. Economic variables and individual variables through the mediation of lifestyle
 had a significant influence on the ethnocentrism of Generation Z in Indonesia.

 Keywords. Ethnocentrime consumer, Generation Z, Lifestyle, Domestic Products

1. The Introduction
Demographically, Generation Z is the generation that born between 1996 and 2017. It is
estimated that the population of this generation will reach 2.3 billion people worldwide. Data
in Indonesia, according to data from the Central Bureau of Statistics, declared that this
generation has the largest number compared to the number in other generations [1]. Detailed
data regarding Indonesia's population by generation can be seen in the following figure:

 Post Gen Z 29,170,000

 Gen Z 74,930,000

 Milenial 69,380,000

 Gen X 58,650,000

 Baby Boomer 31,010,000

 Pre-Boomer 5,030,000

 - 20,000,000 40,000,000 60,000,000 80,000,000

 Figure 1. Total population of Indonesia by generation
 Source: Indonesian Population Census BPS 2021.

 522
Technium Social Sciences Journal
 Vol. 28, 522-538, February, 2022
 ISSN: 2668-7798
 www.techniumscience.com

 The large number of this generation represents a huge potential in the Indonesian
economy. At least on the role of consumption of domestic products. However, this generation
is unique because it is the first generation that is connected to the internet, multi-tasking, has a
strong preference for individual desires and know exactly what they want, in terms of
consumption, production, work, environment and life. They will behave independently of their
own decisions but are also socially vulnerable. Verbal communication of this generation tends
to be low, egocentric, individualistic, impatient, all-instant and less appreciative of the process
[2]. This behavior is influenced by globalization and their ability to access digital information
technology at young age without being followed by proper social control. So their vulnerability
impact on the domestic product consumption. Sanlier et al also stated that globalization will
bring significant changes to the consumption behavior of food and beverage products,
especially in developing countries [3].
 Ethnocentrism in a cultural perspective is an attitude that considers its culture better than
other countries and tends to reject the idea of a different culture [4][5]. In the case of
ethnocentrism consumers, it becomes an identity, a feeling of belonging, a purpose and an
understanding of what consumers will accept or not accept in their group [6]. It is actually
important as an attitude of patriotism in maintaining the economic resilience and defense of a
nation [7][8] especially in developing countries [9][10]. The results of Korui and Khemakem's
research regarding ethnocentrism in Tunisia, concluded that the population of developing
countries had low level (11). There is a results of research on consumer perceptions of dietary
supplement products originating from developed countries conducted in Lithuania, showing
that consumers who have an ethnocentrism attitude tend to have low incomes [12]. This
contradicts the results of Andriyanty and Wahab's research, that generation Z has a tendency to
buy local products if their income is higher [13].
 Guo and Lin calculated the level of ethnocentrism (on a scale of 1-7) of consumers in five
major countries. The results show that the average value in the United States was 3.60; China
was 3.74; India was 3.88; South Korea was 3.71 and Russia average 3.12 [14]. The Bandara’s
research showed that in the Chechen Republic, ethnocentrism of local consumers was
negatively correlated with foreign beer brands [15]. Ramadania, Gunawan and Rustam
conducted a study on the ethnocentrism of Indonesian consumers towards Malaysian products
which was carried out on Indonesian consumers at the border between Indonesia and Malaysia.
The results of this study indicated that ethnocentrism had a strong and negative effect on
consumer attitudes towards foreign products in a sample group of Indonesian consumers who
do not have cultural similarities with Malaysia [16]. Ramdhan's research on the ethnocentrism
of Brado shoe consumers was significant on consumer attitudes towards local products [17].
This is in line with the statement that Generation Z consumers have a preference for consuming
local products [13]. However, Suhailni and Mulyono's research on the ethnocentrism of
Indonesian television consumers among 400 mall visitors in Lombok, showed that this attitude
did not cause negative perceptions of television made in other countries [18]. So based on the
above informations, it is necessary to analyze the consumer ethnocentrism of Indonesian
Generation Z towards their domestic food and beverage products. The purpose of this study
determined whether Indonesian Generation Z has an ethnocentrism attitude towards
consumption of food and beverage products in the country in terms of economic, individual,
lifestyle, pro-social motivation, threat perception, and buying inertia.

 523
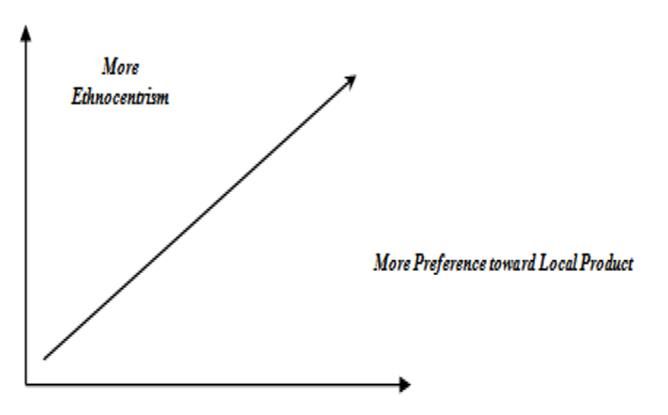
Technium Social Sciences Journal
 Vol. 28, 522-538, February, 2022
 ISSN: 2668-7798
 www.techniumscience.com

2. Literature Review
The first concept of entocentrism was proposed by Sumner in 1910. The review is based on the
concepts of sociology and psychology of social groups. Sumner defines it as the sentiment of
the in-group towards the out-group. Sumner believes that it arises as a need of a group to an
outside group in the interest of survival [19]. While entocentrism from the perspective of
marketing and consumer behavior was reviewed by Shimp and Sharma related to patriotism in
US consumers. The results of their research showed that ethnocentrism had a negative
correlation with American consumers' attitudes towards foreign products and the lower the
ethnocentrism, the higher the desire to buy local products [6]
 Most studies found that consumer ethnocentrism was an important factor that can
determine behavior in consumer decision making when they decide to buy local or foreign
products. Ethnocentric consumers shows a high preference for domestic products over foreign
products even when the quality is lower and the price is higher for reasons of nationalism [20].
Consumers who are highly ethnocentric will prefer domestic products to foreign products, while
consumers who are slightly ethnocentric tend to buy foreign products. The above statement can
be explained according to the graph below:

 Figure 2. The concept of consumer ethnocentrism.
 Source: (21)

There are four main antecedents that can influence ethnocentric consumers. They are socio-
psychological, political, economic and demographic [20].
 The role of consumer ethnocentrism becomes important in global marketing. Ethnocentric
consumers are proven to have an effect on consumer purchasing decisions for all types of
products. Consumer decision making includes at least four stages. The first stage is the
evaluation of the needs, the second stage is determining the attitude towards the product, the
third stage is the intention to buy and the final stage is the actual buying activity. And the
concept of ethnocentrism spreads into all stages of consumer decision making. Marketers
should explore the influence of consumer ethnosetrism as the main phenomenon, at various
stages of the consumer decision-making process for domestic products. So they can find the
most innovative strategies, gain market share and become the market leader in the domestic or
global competitive environment [22].
 Marketing communication program will be better if ethnocentrism can be combined with
demographic factors and consumer lifestyle. Ethnocentrism is also influenced by
socioeconomic factors, the absence of norms conditions and emphasis on personal decisions

 524
Technium Social Sciences Journal
 Vol. 28, 522-538, February, 2022
 ISSN: 2668-7798
 www.techniumscience.com

[23][24]. Jin et al research concluded that there was an economic relationship in the form of
consumerism and the country of origin of the product to ethnocentrism [25]. Ethnocentrism has
a correlation with economic factors in purchasing decisions [20][26][27][28]. The relationship
between ethnocentrism and individual characteristics was explained by Olufson. Things such
as ethnicity, age and consumer character were significant to ethnocentrism attitudes [29].
Studies that explain the relationship between lifestyle and ethnocentrism, showed that the two
things were correlated [30][31][32][33]. Research on the lifestyle model of the love of domestic
products by Andriyanty and Yunaz concluded that economic and social motives can affect it
(34). The “love of domestic product” lifestyle could be formed through attitudes, self-concept
and knowledge of a product in the younger generation [35].
 In the current economic turbulence environment, creating of uncertainty conditions. That
circumstances force consumers decide their purchase not all at once. Factors that influence
consumer purchases are price factors, choice and technological change (36). Different types of
economic environment create different types of preferences for imported goods. There are two
general types of economic environments. First, when a country is still developing and needs
more support from its consumers to buy homemade products to boost the domestic economy.
Second, when the local economy is strong enough to offer a wide choice of products and can
compete with imported products while improving the quality of domestic products [37].
Economic motives basically affect the lifestyle of the younger generation [38][39][40][41].
Based on the above discussion, the research hypotheses were formulated:
H1 : Economic factors have a significant direct relationship to the lifestyle of Generation Z in
Indonesia.
 The self-concept factor can affect the “love of domestic product” lifestyle [35]. Consumer
demographic factors play an important role in ethnocentrism consumers [42][21][43]. The study
of ethocentrim consumers in France stated that international marketers should focus on
demographic factors, especially consumer age, gender, and education level. In this demographic
segment, young consumers and women with high levels of ethnocentrism must be handled
differently [44][22]. Shankarmahesh's research results also suggest that future research can
focus on the antecedents of individual factors and consequences of consumer ethnocentrism
[37]. One of the factors related to individual consumers that influences ethnocentrism is the
existence of the country of origin of the producer of goods [45][11]. Based on above
information, the following hypothesis is proposed:
H2: Individual factors have a significant direct relationship to the lifestyle of Generation Z in
Indonesia.
 The results of research conducted in Serbia show that the lifestyle factors of consumers
through the personality traits of the respondents, rational and practical buying behavior, and
awareness have a significant influence on the ethnocentrism of the respondents' consumers. The
results of this study provide scientific and managerial implications, the results were practically
useful because they allowed managers to create marketing strategies for the domestic market
according to lifestyle factors [46]. Then formed the third hypothesis as follows:
H3 : Lifestyle has a significant direct relationship to the ethnocentrism of Generation Z in
Indonesia.
 Open-mindedness to the global is basically not related to the desire to buy foreign
products, but the assessment of domestic products had a significant moderating role on the
relationship between “worldmindedness” and consumer willingness to buy foreign products
[47] . Economic factors and individual factors have an influence on consumer ethnocentrism
[34]. Ethnocentrism thrives in areas with strong egalitarianism. The definition of egalitarianism

 525
Technium Social Sciences Journal
 Vol. 28, 522-538, February, 2022
 ISSN: 2668-7798
 www.techniumscience.com

is a credence that tends to think that every human being should be treated equally on the
religious, political, economic, social, or cultural dimensions [48]. Then the fourth hypothesis is
proposed, namely:
H4 : Economic factors, individual factors through the mediation of lifestyle factors have a
significant influence on the ethnocentrism of Generation Z in Indonesia.

3. Research Method
This research applied quantitative descriptive method. Research locations were Jakarta, Bogor,
Depok, Tangerang and Bekasi. Data sources were primary and secondary. Primary data were
obtained from a sample of Generation Z aged between 17 and 27 years. The number of samples
was 431 respondents and was accidental sampling. the questionnaire developed in this study,
was adopted and adapted from the research of Shimp & Sharma and Shankarmahesh (6)(37).
The type of data used primary data. The data measured the level of perception of respondents.
It is designed with a positive Linkert scale. Respondents were asked to rate their perceptions
based on research questionnaires. The lowest value was given a value of 1, and the highest was
given a value of 5. The data tabulated and analyzed by the multivariance analysis through
structural equation modeling. The path analysis equation consists of the outer and inner models,
with the mathematical equations for the inner model as follows:
 = 1 1 + 2 2 + 3 3 + ƫ1
Note: η = Indonesian Generation Z ethnocentrism; τ1= economic factor coefficient; ξ1=
economic factor; τ2=individual factor coefficient; ξ2= individual factor; τ3= consumer lifestyle
factor coefficient; ξ3= consumer lifestyle factor; ƫ1= error term of exogenous latent variable.
The outer model is formed by the following mathematical equation:
Exogenous latent variables:
x11 = Perception of income = λx1ξ1 + δ1
x12 = Capitalism = λx2ξ2 + δ2
x13 = Perception of National economic improvement = λx3ξ3 + δ3
x21 = Age = λx4ξ4 + δ4
x22 = Gender= λx5ξ5 + δ5
x23 = Education level= λx6ξ6 + δ6
x31 = Country of origin=λx7ξ7 + δ7
x32 = Consumer experience =λx8ξ8 + δ8
x33 = Self perception = λx9ξ9 + δ9
x34 = Attitude of “love for domestic products” = λx1ξ10 + δ10
y01= Obligation of ethnocentrism = λx11ξ11 + δ11
y02= The sloth of imported product purchasing = λx12ξ12 + δ12
y11= The preservation of national identity = λx15ξ15 + δ15
y12= Moral duty as a nation = λx16ξ16 + δ16
y13= Patriotism = λx17ξ17 + δ17
y31= Unemployment = λx18ξ18 + δ18
y32= Economic threat = λx19ξ19 + δ19
y51= Familiarity with domestic products = λx20ξ20 + δ21
y52= intergenerational to buy domestic products = λx21ξ21 + δ21
Endogenous latent variables “
x1 = Economic = λx1η1 + ε1
x2 = Individual = λx2η2 + ε2

 526
Technium Social Sciences Journal
 Vol. 28, 522-538, February, 2022
 ISSN: 2668-7798
 www.techniumscience.com

x3 = Lifestyle= λx3η3 + ε3
y0 = Ethnocentrism = λy4η4 + ε4
y1 = Pro-social Motivation = λy5η5 + ε5
y3 = threat perception = λy6η6 + ε6
y5 = Buying inersia = λy7η7 + ε7

The built model shown in the following graph:

 Figure 3.
 Research model.

All instruments declared valid. Their factor loading value were above 0.6 (the value of each
instrument can be seen in Figure 3). All variables were also declared valid and reliable, because
the results of the composite reliability test and the average variance extracted value which were
above 0.6.

 Table 1. Validity and reliability test results
 Cronbach's rho_A Composite Average Variance
 Alpha Reliability Extracted (AVE)
 Buying inertia 0.595 0.644 0.827 0.707
 Economic 0.708 0.708 0.837 0.631
 Ethnocentrism 0.610 0.611 0.837 0.720
 Individual 0.780 0.780 0.858 0.603
 Lifestyle 0.669 0.701 0.817 0.600
 Pro Social Motivation 0.781 0.800 0.871 0.693

 527
Technium Social Sciences Journal
 Vol. 28, 522-538, February, 2022
 ISSN: 2668-7798
 www.techniumscience.com

 Threat Perception 0.784 0.832 0.901 0.820
Source: Primary data processed (2022).

4. Result and Discussion
4.1. Respondents Demographics
The research data amounted to 431 respondents of generation Z. Respondents were sought who
came from lower middle income family group. Based on gender, respondents were dominated
by women and in the age group 19 to 22 years. Detailed data regarding the demographics of
respondents can be seen in the following table:

 Table 2. Respondents demographics datas.
 Type Frequency Percent
 Gender Male 201 46,6
 Female 230 53,4
 Total 431 100,0
 Age group 15-18 63 14,6
 19-22 286 66,4
 > 23 82 19.0
 Total 431 100,0
Sumber: Data primer diolah (2022).

 The results of the crosstab test between gender data and the respondent's ethnocentrism
level showed that the ethnocentrism level ranged from 10 to 40 percent and the range from 50
to 65 percent tended to be dominated by women. In the 70 to 85 percent range, 87 to 100 are
male-dominated. Detailed data can be seen in the following graph:

 60

 50

 40

 30

 20

 10

 0
 100,00
 40,00

 87,00
 10,00

 30,00

 35,00

 50,00

 55,00

 60,00

 65,00

 70,00

 75,00

 78,00

 80,00

 85,00

 90,00

 95,00

 99,00

 Ethnocentrism

 Gender Male Gender Female

 Figure 4. Crosstab gender by level of ethnocentrism
 Source: Primary data processed (2022).

 528
Technium Social Sciences Journal
 Vol. 28, 522-538, February, 2022
 ISSN: 2668-7798
 www.techniumscience.com

On average, the male ethnocentrism level was higher than the female group. It showed on the
folowing figure :

 69

 Ethnocentrism

 71

 69 69 70 70 71 71

 Gender Female Gender Male

 Figure 5. Crosstab gender by level of ethnocentrism
 Source: Primary data processed (2022).

 The results of the crosstab between the respondent’s age and the ethnocentrism level,
showed that at the ethnocentrism level of 10 percent, 30 percent, 35 percent, 40 percent and 50
percent; the dominant age group is in the age group of more than 23 years. At the level of
ethnocentrism 55 percent, 75 percent, 78 percent, 87 percent and 99 percent evenly distributed
in the age range 19-22 and the age range of more than 23 years. At the ethnocentrism level of
60 percent, 65 percent, 70 percent, 80 percent 90 percent, 95 percent and 100 percent; dominated
by the age group of more than 23 years. Detailed data can be seen in the following graph:

 90
 80
 70
 60
 50
 40
 30
 20
 10
 0

 Age Range 15-18 Age Range 19-22 Age Range >23

 Figure 6. Crosstab of respondents' age range with ethnocentrism level
 Source: Primary data processed (2022).

 529
Technium Social Sciences Journal
 Vol. 28, 522-538, February, 2022
 ISSN: 2668-7798
 www.techniumscience.com

On average, it can be stated that the age range of 19-22 years and those aged over 23 years have
an ethnocentrism rate of 70 percent. Meanwhile, the 15-18 year age group has an ethnocentrism
level of 69. Detailed data regarding this can be seen in the following figure:

 >23 70

 19-22 70

 15-18 69

 68.4 68.6 68.8 69 69.2 69.4 69.6 69.8 70 70.2

 Figure 7. Crosstab of the age range of respondents with the level of ethnocentrism.
 Source: Primary data processed (2022).

4.2. Research result
The data descriptive analysis of this study shown in the following table:

 Table 3. Descriptive data
 Descriptive Statistics
 N Minimum Maximum Mean Std. Deviation
 Ethnocentrism 431 10,00 100,00 70,0742 17,60613
 Usia 431 15,00 27,00 20,8515 2,09234
 x1 431 1,00 5,00 3,9582 ,83143
 x10 431 1,00 5,00 3,8608 ,84859
 x2 431 2,00 5,00 4,2181 ,74318
 x3 431 1,00 5,00 3,8979 ,95419
 x4 431 1,00 5,00 3,7401 ,94117
 x5 431 2,00 5,00 3,9327 ,75798
 x6 431 1,00 5,00 3,9838 ,79077
 x7 431 1,00 6,00 3,8445 ,84988
 x8 431 1,00 5,00 4,1624 ,86351
 x9 431 1,00 5,00 3,8817 ,81407
 Y01 431 1,00 5,00 3,3875 ,97443
 Y02 431 1,00 5,00 3,8608 ,84859
 Y03 431 1,00 5,00 3,3921 ,98917
 Y11 431 1,00 5,00 3,3921 ,98917
 Y12 431 1,00 5,00 3,7703 1,01873
 Y13 431 1,00 5,00 3,6218 ,97092

 530
Technium Social Sciences Journal
 Vol. 28, 522-538, February, 2022
 ISSN: 2668-7798
 www.techniumscience.com

 Y31 431 1,00 5,00 3,6961 1,08605
 Y32 431 1,00 5,00 3,3155 1,00358
 Y51 431 1,00 5,00 3,6195 ,89390
 Y52 431 1,00 5,00 3,7425 ,87659
 Valid N (listwise) 431

Source: Primary data processed (2022).

 The fit model test analyzed by the adjusted R Square test. Based on the results for the
endogenous ethnocentrime model, the R2 value is 0.847. It shows that all exogenous latent
variables are substantial and able to explain the ethnocentrime variable by 84.7 percent. In the
endogenous lifestyle model test results obtained R2 value of 0.583. This shows that 58.3 percent
of all exogenous latent variables are substantial and able to explain lifestyle variables.

 Table 4. R Square test result
 R Square R Square Adjusted
 Ethnocentrism 0.847 0.845
 Lifestyle 0.583 0.581
Source: Primary data processed (2022).

The value of f square shows that all exogenous latent variables are significant to the endogenous
structural arrangement of the lifestyle model. In the endogenous ethnocentrime model, all
exogenous latent variables are significant except for the buying inertia variable. Detailed data
on the f square value can be seen in the following table:

 Table 5. F test result.
 Ethnocentrism Lifestyle Conclusion
 Buying inertia 0.017 not supported
 Economic 0.005 0.210 supported
 Individual 0.045 0.168 supported
 Lifestyle 0.340 supported
 Pro Social Motivation 1.667 supported
 Threat Perception 0.022 supported
Source: Primary data processed (2022).

To state that the latent variables are statistically different from each other, it was tested with a
discriminant validity test. All latent variables were stated to be statistically different because all
values were below 1. This indication is in line with the research of Benitez et al which states
the same thing [49]. This can be seen in the following table:

 Table 6. discriminant validity.
 Ethno- Pro Social
 Buying Lifestyl Threat
 Economic centris Individual Motivatio
 inertia e Perception
 m n
 Buying inertia 0.841
 Economic 0.461 0.794

 531
Technium Social Sciences Journal
 Vol. 28, 522-538, February, 2022
 ISSN: 2668-7798
 www.techniumscience.com

 Ethnocentrism 0.395 0.572 0.848
 Individual 0.540 0.730 0.523 0.776
 Lifestyle 0.437 0.716 0.758 0.704 0.775
 Pro Social Motivation 0.382 0.603 0.888 0.569 0.686 0.832
 Threat Perception 0.348 0.511 0.480 0.499 0.529 0.562 0.905
Source: Primary data processed (2022).

The value of the model fit criteria can also be seen from the standardized RMR value [50].
Based on the results of testing the SRMR value, the criteria for the fit of the model have been
moderate fulfilled. Accordance by the opinion of Schermelleh-Engel et al which states that a
smaller SRMR value of 0.10 can be interpreted as acceptable [51]. Meanwhile, MacCallum et
al stated that the standardized root mean error value between 0.08-0.10 was included as
mediocre fit category [52].
 The intervariables analysis in this research model approached by path analysis. Based on
the results, it was shown that all exogenous latent variables in the ethnocentrism model and
lifestyle model were significant. In the endogenous ethnocentrism model, the pro-social
motivation variable and the tendency to refuse the imported-product purchasing (buying inertia)
had a positive correlation with ethnocentrism. It showed that the better the pro-social motivation
and buying inertia, the higher the ethnocentrism of Generation Z. Meanwhile, threat perception
has a negative corellation with ethnocentrism. It indicated that the more negative respondents'
perceptions of the unemployment, pressure and the economy threat, the higher the
ethnocentrism will be. In lifestyle modeling, economic factor and individual variables have a
positive correlation. It indicated that the better the economic factor and individual quality of
generation Z in Indonesia, the” love of domestic product” lifestyle will be better. Detailed data
of path analysis test results can be seen in the following table:

 Table 7. Path analysis.
 Original Sample Standard
 T P
 Sample Mean Deviation Conclusiom
 Statistics Values
 (O) (M) (STDEV)
 Pro Social Motivation ->
 0.745 0.744 0.023 32.091 0.000 Supported
 Ethnocentrism
 Threat Perception -> Ethnocentrism -0.074 -0.074 0.024 3.014 0.003 Supported
 Buying inertia -> Ethnocentrism 0.062 0.062 0.024 2.588 0.010 Supported
 Lifestyle -> Ethnocentrism 0.389 0.389 0.033 11.900 0.000 Supported
 Economic -> Lifestyle 0.433 0.437 0.044 9.830 0.000 Supported
 Individual -> Lifestyle 0.388 0.384 0.050 7.731 0.000 Supported

Source: Primary data processed (2022).

The analysis of the total indirect effect showed that economic factor and individual variables
have an indirect relationship to generation Z ethnocentrism through lifestyle. The variables that
tend to influence it are economic factors. Detailed data regarding the indirect effect test can be
seen in the following table:

 532
Technium Social Sciences Journal
 Vol. 28, 522-538, February, 2022
 ISSN: 2668-7798
 www.techniumscience.com

 Table 8. Spesific Total Indirect Effect Result
 Original Sample Standard
 T P
 Sample Mean Deviation Conclusion
 Statistics Values
 (O) (M) (STDEV)

 Economic -> Lifestyle -> Ethnocentrism 0.169 0.168 0.022 7.578 0.000 Supported
 Individual -> Lifestyle -> Ethnocentrism 0.151 0.151 0.023 6.476 0.000 Supported
Source: Primary data processed (2022).

 The results of the analysis between the manifest variables and the latent variables,
showed that all variables were significant. The correlation value ranges from 0.674 to 0.939. In
the economic variable, the most influencing factor was the perception that buying foreign
products will benefit only the capital owner. The individual variables, the important determining
factor was the education of Generation Z in Indonesia. It concluded that the better the education,
the “love domestic products” lifestyle among generation Z will be better. It supported by
research in Turkey. The results showed that all respondents with low levels of education and
income tend to have low levels of ethnocentrism [53]. The lifestyle variable, the 'love domestic
products' attidtude had the strongest influence. When it associated with ethnocentrism, it will
also be very influential. This result supported by research in Zimbabwe regarding consumer
ethnocentrism of imported meat products which was linked to consumer attitudes. Consumer
attitude refered to the tendency to behave in a consistently favorable or unfavorable manner
towards a given object. This research implied that ethnocentrism consumers had a less favorable
attitude towards imported poultry meat, while less ethnocentric consumers prefered attitudes
towards imported poultry meat products. The findings expanded the analysis of growing
consumer behavior and the international marketing literature, which suggested that consumer
ethnocentrism had a negative effect through attitudes toward imported products [54].
 Analysis of the manifest variable on the ethnocentrism variable, The most influential
factor was the sloth factor in buying imported products. The pro-social motivation variable was
strongly influenced by the fact that Generation Z in Indonesia perceives ethnocentrism to be
their moral duty. In the threat perception variable, the unemployment became the most
important influenced factor. Meanwhile, the main factor that effected buying inertia is the
familiarity of generation Z to their domestic products. The parents (intergeneration pass) held
the main role for familiarizing domestic products with their children. This statement is in line
with Ferrín et al's research in Spain on university students regarding the role of parents on the
level of ethnocentrism of their children [55]. Other research also supported that the role of
parents in their children's lifestyle [56]. The results of factor analysis can be seen in the
following table:
 Table 9. Outter loading result
 Original Standard
 Sample T P
 Sample Deviation Conclusion
 Mean (M) Statistics Values
 (O) (STDEV)

 0.796 0.796 0.020 39.671 0.000 Supported
 perception of income
Technium Social Sciences Journal
 Vol. 28, 522-538, February, 2022
 ISSN: 2668-7798
 www.techniumscience.com

 Gender perception
Technium Social Sciences Journal
 Vol. 28, 522-538, February, 2022
 ISSN: 2668-7798
 www.techniumscience.com

References
[1]. BPS R. Hasil Sensus Penduduk 2020: Berita Resmi Statistik No.7/01/Th.XXIV, 21
Januari 2021. 2021.
[2]. Hadion W, Indrawan I, Cahyono Y, Handoko AL, Santamoko R. Generasi Z &
Revolusi Industri 4.0 Penulis [Internet]. 2020. 95 p. Available from:
https://www.researchgate.net/publication/343416519_Generasi_Z_Revolusi_Industri_40
[3]. Sanlier N, Sezgin AC, Sahin G, Yassibas E. A study about the young consumers’
consumption behaviors of street foods. Cienc e Saude Coletiva. 2018;23(5):1647–56.
[4]. Keith KD. Ethnocentrism Contemporary Perspective. 2013.
[5]. Nganga M. Cultural Ethnocentrism in Europe. Vol. 23529, MOI University. 2008.
[6]. Shimp TA, Sharma S. Consumer Validation Construction Ethnocentrism : of the. J
Mark Res [Internet]. 1987;24(3):280–9. Available from: http://www.jstor.org/stable/3151638 .
[7]. Schnettler A. Revista de la Facultad de Ciencias Agrarias “Country of origin” effect
and ethnocentrism in food purchase in Southern Chile Revista de la Facultad de. Ciencias Agrar
[Internet]. 2017;49:243–67. Available from:
http://www.redalyc.org/articulo.oa?id=382853527018
[8]. Bizumic B, Duckitt J. What Is and Is Not Ethnocentrism? A Conceptual Analysis and
Political Implications. Polit Psychol. 2012;33(6):887–909.
[9]. Anselme M-M. Ethnocentrism and Nation. Reflection on Blocking Factors the Birth
of the African Subject. Open J Philos. 2018;08(05):594–613.
[10]. Jafari A. Reflections on Young Iranians’ Ethnocentric Behaviours: Evidence from
Consumer Culture Forthcoming. J Socio-Cultural Chang. 2014;1(1):128–52.
[11]. Karoui S, Khemakhem R. Consumer ethnocentrism in developing countries. Eur Res
Manag Bus Econ [Internet]. 2019;25(2):63–71. Available from:
https://doi.org/10.1016/j.iedeen.2019.04.002
[12]. Šmaižienė I, Vaitkienė R. Consumer Ethnocentrism and Behavior in a Market of
Dietary Supplements. Procedia - Soc Behav Sci. 2014;156(April):463–7.
[13]. Andriyanty R, Wahab D. Preferensi Konsumen Generasi Z Terhadap Konsumsi
Produk Dalam Negeri. ETHOS (Jurnal Penelit dan Pengabdian). 2019;7(2):280–96.
[14]. Guo G, Lin Q. Consumers Become More or Less Ethnocentric? A Meta-Analysis on
Level of Consumer Ethnocentrism. Int J Bus Manag. 2017;12(2):145.
[15]. Bandara, Wanninayake WMC, Chovancova M. Consumer Ethnocentrism and
Attitudes Towards Foreign Beer Brands: With Evidence from Zlin Region in the Czech
Republic. J Compet. 2012;4(2):3–19.
[16]. Ramadania, Gunawan S, Rustam M. Cultural Similarity, Consumer Ethnocentrism and
Product Necessity in Evaluation of Malaysian Products: Indonesian Consumer Perspective.
Procedia - Soc Behav Sci. 2015;211:533–40.
[17]. Ramadhan AR. Consumer Ethnocentrism Sebagai Penggerak Sikap Terhadap Merek
Lokal dalam Membentuk Brand Loyalty. Vol. 1. Indonesia Banking School; 2016.
[18]. Sulhaini, Mulyono LEH. The Effect of Ethnocentrism and Image of Asian
Industrialised Countries on Perceived Relative Quality. Int Res J Bus Stud. 2014;7(3):165–77.
[19]. Sumner WG. Folkways: A Study of the Sociological Importance of Usages, Manners,
Customs Mores, and Morals. First. Boston: Ginn and Company; 1906. 712 p.
[20]. Alshammari E, Williams M, Morgan N. Integrative Review: Factors Effecting
Consumer Ethnocentrism (CET). Int Rev Manag Bus Res. 2017;6(3):579–94.
[21]. Alsughayir A. Consumer Ethnocentrism : A Literature Review. Int J Bus Manag Invent
[Internet]. 2013;2(5):50–4. Available from: http://www.ijbmi.org/papers/Vol(2)5/version-

 535
Technium Social Sciences Journal
 Vol. 28, 522-538, February, 2022
 ISSN: 2668-7798
 www.techniumscience.com

2/H255054.pdf
[22]. Frančič EVA. Consumer Ethnocentrism and Its Effects on the French Buying
Behaviour. University Of Ljubljana; 2015.
[23]. Heydari A, Teymoori A, Haghish EF, Mohamadi B. Influential factors on
ethnocentrism: The effect of socioeconomic status, anomie, and authoritarianism. Soc Sci Inf.
2014;53(2):240–54.
[24]. Eren SS. Young Consumers’ Attitudes toward American products. Procedia - Soc
Behav Sci. 2013;99:489–95.
[25]. Jin Z, Lynch R, Attia S, Chansarkar B, Gülsoy T, Lapoule P, et al. The relationship
between consumer ethnocentrism, cosmopolitanism and product country image among younger
generation consumers: The moderating role of country development status. Int Bus Rev.
2015;24(3):380–93.
[26]. Rahmawati NA, Muflikhati I. Effect of Consumer Ethnocentrism and Perceived
Quality of Product on Buying Behavior of Domestic and Foreign Food Products: A Case Study
in Pekanbaru, Riau, Indonesia. J Consum Sci. 2016;1(1):1.
[27]. Giang NT, Khoi ND. The Impact of Consumer Animosity and Consumer
Ethnocentrism on Intention to Purchase Foreign Products: The Case of Chinese Branded
Household Appliances in Vietnam Market. J Econ Behav Stud. 2015;7(4):22–36.
[28]. Renko N, Crnjak Karanović B, Matić M. Influence of Consumer Ethnocentrism on
Purchase Intentions: Case of Croatia. Ekon misao i praksa časopis Sveučilista u Dubrovniku.
2012;XXI(2):529–44.
[29]. Olufson LC. An Investigation of Ethnocentrism, Its Elements, Factors Affecting Its
Intensity, and Implications for Cross-Cultural Activities. Vol. 1, A Thesis of Oregon State
University. 1989.
[30]. Aguilar-Rodríguez IE, Arias-Bolzmann LG. The relationship of consumer
ethnocentrism, purchase intention, and lifestyle in first-generation bicultural ethnic groups. J
Small Bus Strateg. 2021;31(1):20–38.
[31]. Haryanto B, Febrianto A, Cahyono E. Lifestyle and Consumer Preferences in
Choosing Local or Foreign Brands: a Study of Consumer Behavior in Surakarta – Indonesia. J
Manaj dan Kewirausahaan. 2019;21(1):74–88.
[32]. Amri S, Prihandono D. INFLUENCE LIFESTYLE, CONSUMER
ETHNOCENTRISM, PRODUCT QUALITY ON PURCHASE DECISION THROUGH
PURCHASE INTENTION. Manag Anal J. 2019;8(1):25–38.
[33]. Spillan JE, Kang Z, Barat S. Amulti-country study exploring relationships of lifestyles
to ethnocentrism. J Transnatl Manag. 2011;16(2):62–83.
[34]. Andriyanty R, Yunaz H. Model Gaya Hidup Konsumen Dalam Memilih Produk
Makanan Dalam Negeri. J iImiah Manaj Dan Bisnisurnal iImiah Manaj Dan Bisnis.
2020;21(1):82–95.
[35]. Andriyanty R, Dewi DU. Faktor-Faktor Sosial Yang Mempengaruhi Kesadaran Gaya
Hidup Cinta Produk Dalam Negeri Generasi Muda Di Indonesia. Sosio Inf. 2021;7(1):31–45.
[36]. Earl P. Lifestyle Economics : Consumer Behaviour in a Turbulent World. 1st ed.
Wheatsheaf Books LTD; 1986. 1–328 p.
[37]. Shankarmahesh MN. Consumer ethnocentrism: An integrative review of its
antecedents and consequences. Int Mark Rev. 2006;23(2):146–72.
[38]. Gvozdanović A, Ilišin V, Adamović M, Potočnik D, Baketa N, Kovačić M. Youth
Study Croatia 2018/2019 [Internet]. Bonn; 2019. Available from: https://remote-
lib.ui.ac.id:2078/docview/232006495/fulltextPDF/BAFCB97B243C4186PQ/4?accountid=172

 536
Technium Social Sciences Journal
 Vol. 28, 522-538, February, 2022
 ISSN: 2668-7798
 www.techniumscience.com

42
[39]. Santisi G, Platania S, Hichy Z. A lifestyle analysis of young consumers: A study in
Italian context. Young Consum. 2014;15(1):94–104.
[40]. Lin L-Y, Shih H-Y. The Relationship of University Student’s Lifestyle, Money
Attitude, Personal Value and their Purchase Decision. Int J Res Manag. 2012;1(2001):19–37.
[41]. Soininen M, Merisuo-Storm T. The life style of the youth, their every day life and
relationships in Finland. Procedia - Soc Behav Sci [Internet]. 2010;2(2):1665–9. Available
from: http://dx.doi.org/10.1016/j.sbspro.2010.03.255
[42]. Ma J, Yang J, Yoo B. The moderating role of personal cultural values on consumer
ethnocentrism in developing countries: The case of Brazil and Russia. J Bus Res [Internet].
2020;108(December 2019):375–89. Available from:
https://doi.org/10.1016/j.jbusres.2019.12.031
[43]. Meeusen C, de Vroome T, Hooghe M. How does education have an impact on
ethnocentrism? A structural equation analysis of cognitive, occupational status and network
mechanisms. Int J Intercult Relations [Internet]. 2013;37(5):507–22. Available from:
http://dx.doi.org/10.1016/j.ijintrel.2013.07.002
[44]. Rašković M, Ding Z, Hirose M, Žabkar V, Fam KS. Segmenting young-adult
consumers in East Asia and Central and Eastern Europe – The role of consumer ethnocentrism
and decision-making styles. J Bus Res [Internet]. 2020;108(May 2019):496–507. Available
from: https://doi.org/10.1016/j.jbusres.2019.04.013
[45]. Huddleston P, Good LK, Stoel L. Consumer ethnocentrism, product necessity and
quality perceptions of russian consumers. Int J Phytoremediation. 2000;21(1):167–81.
[46]. Gašević D, Vranješ M, Tomašević D. The influence of consumer lifestyle in the
Republic of Serbia on consumer ethnocentrism. Sk biznisa. 2019;14(2):78–94.
[47]. Topçu UC, Kaplan M. Willingness to Buy Foreign Products in Relation to
Ethnocentric Tendencies and Worldminded Attitudes of Consumers. Procedia - Soc Behav Sci
[Internet]. 2015;207:157–64. Available from: http://dx.doi.org/10.1016/j.sbspro.2015.10.166
[48]. Balabanis G, Theofania Siamagka N. A Meta-Analysis of Consumer Ethnocentrism
Across 57 Countries. Int J Res Mark [Internet]. 2021;(xxxx). Available from:
https://doi.org/10.1016/j.ijresmar.2021.12.002
[49]. Benitez J, Henseler J, Castillo A, Schuberth F. How to perform and report an impactful
analysis using partial least squares: Guidelines for confirmatory and explanatory IS research.
Inf Manag [Internet]. 2020;57(2):103168. Available from:
https://doi.org/10.1016/j.im.2019.05.003
[50]. Parry S. Fit Indices commonly reported for CFA and SEM. Cornell Univ Cornell Stat
Consult Unit [Internet]. 2020;2. Available from: www.cscu.cornell.edu/news/handouts.php
[51]. Schermelleh-Engel K, Moosbrugger H, Müller H. Evaluating the fit of structural
equation models: Tests of significance and descriptive goodness-of-fit measures. MPR-online.
2003;8(May):23–74.
[52]. MacCallum RC, Browne MW, Sugawara HM. Power analysis and determination of
sample size for covariance structure modeling. Psychol Methods. 1996;1(2):130–49.
[53]. Erdogan BZ, Uzkurt C. Effects of ethnocentric tendency on consumers’ perception of
product attitudes for foreign and domestic products. Cross Cult Manag. 2010;17(4):393–406.
[54]. Makanyeza C, Du Toit F. Consumer ethnocentrism in developing countries:
Application of a model in Zimbabwe. Acta Commer - Indep Reseacrh J Manag Sci.
2017;17(1):1–9.
[55]. Fernández-Ferrín P, Bande B, Galán-Ladero MM. La influencia parental en los niveles

 537
Technium Social Sciences Journal
 Vol. 28, 522-538, February, 2022
 ISSN: 2668-7798
 www.techniumscience.com

de etnocentrismo regional de los jóvenes: un análisis exploratorio. Spanish J Mark - ESIC
[Internet]. 2017;21(1):52–62. Available from: http://dx.doi.org/10.1016/j.sjme.2016.11.001
[56]. Spilková J, Dzúrová D. Life Style Changes and Risk Behavior among Czech
Teenagers. Procedia - Soc Behav Sci. 2012;50(July):614–22.

 538
You can also read