A STATISTICAL PROFILE 2020 2018 - UCC Files
←
→
Page content transcription
If your browser does not render page correctly, please read the page content below

1   9
                                                                                                       20
                                                                         1 8
                                                                   2   0

                      A STATISTICAL PROFILE 2020
                      WITH RE FLEC TI O N/D I SCUSS I O N QU ESTI O N S FO R C H U RC H LE ADE RS
                      R E S E A R C H F R O M T H E U CC C E N T E R F O R A N A LY T I C S , R E S E A R C H & D E V E L O PM E N T, A N D DATA (C A R D D)

700 PROSPECT AVENUE
CLEVELAND, OH 44115
UCC.ORG
QUICK SUMMARY OF UCC STATISTICS
MEMBERSHIP AND PARTICIPATION                                                             RACE/ETHNICITY BY CONGREGATION
CONGREGATIONS: 4,852                                                                     WHITE/EURO-AMERICAN: 83.8%
MEMBERS: 802,356                                                                         BLACK/AFRICAN-AMERICAN: 4.9%
AVERAGE MEMBERSHIP: 167*                                                                 ASIAN/PACIFIC ISLANDER: 3.9%
MEDIAN MEMBERSHIP: 105                                                                   HISPANIC/LATINO: 0.4%                                                                        Visit our webpages for statistics, reports and other resources
AVERAGE WORSHIP ATTENDANCE: 67                                                           NATIVE AMERICAN: 0.6%                                                                                                               www.ucc.org/research
MEDIAN WORSHIP ATTENDANCE: 47                                                            BI-RACIAL/MULTI-RACIAL AND OTHER: 6.0%
                                                                                                                                                                                                                    www.ucc.org/assessment_resources
AVERAGE CONFIRMATIONS: 1.4                                                               OTHER: 0.4%
                                                                                                                                                                                                                  www.ucc.org/research_archived-reports
AVERAGE CONFESSIONS: 1.4
AVERAGE TRANSFERS IN: 1.7                                                                STEWARDSHIP AND FINANCES**                                                                                           www.ucc.org/research_statistics-and-reports
AVERAGE REAFFIRMATIONS: 2.3                                                              AVERAGE BASIC SUPPORT: $3,962

AVERAGE DEATHS: 3.6                                                                      AVERAGE OTHER UCC GIVING: $2,364**

AVERAGE TRANSFERS OUT: 1.4                                                               AVERAGE TOTAL OCWM: $6,326
                                                                                                                                                                                                   Follow our Blog “Vital Signs and Statistics”
AVERAGE CHILD BAPTISMS: 1.7                                                              AVERAGE ONE GREAT HOUR OF SHARING: $389
                                                                                                                                                                                                                       https://carducc.wordpress.com/
AVERAGE ADULT BAPTISMS: 0.4                                                              AVERAGE NEIGHBORS IN NEED: $234

OPEN AND AFFIRMING: 32.6%                                                                AVERAGE CHRISTMAS FUND: $278
                                                                                         AVERAGE STRENGTHEN THE CHURCH: $128
                                                                                                                                                                                          View the online Yearbook & Directory—Access UCC
ACCESSIBLE: 85.6%
WEB PRESENCE: 67.5%                                                                      5 FOR 5 CHURCHES: 32.7%
                                                                                         AVERAGE OTHER GIFTS: $12,399                                                                   Send an email to accessucc@ucc.org to get your 60-day free trial!
                                                                                         AVERAGE OPERATING EXPENSES: $183,852                                                                                                     accessucc.org
                                                                                         AVERAGE TOTAL INCOME: $235,245

*Unlike in the Yearbook, this number reflects the average only among churches with reported membership numbers as compared to the average across all churches. As a result, the
denominator for this calculation is slightly lower, resulting in a slightly higher average.
**Other UCC Giving is a 2017 data collection name and process change formerly known as Special Support. Prior to 2017, this data was primarily reported by conferences on behalf
of their churches with the churches reporting only UCC Special Support (giving that was given directly to UCC agencies and organization). In 2017, this was shifted and churches
reported the bulk of this giving with the conferences reporting only the four Special Mission Offerings.                                                                                  C E N T E R F O R A N A LY T I C S , R E S E A R C H & D E V E L O PM E N T, A N D DATA (C A R D D)
Note: Calculations of church quick stats have changed since last year. Previously, the averages were calculated only among churches that reported non-zero numbers of confirma-                      7 0 0 P R O S P E C T AV E N U E E A S T, C L E V E L A N D, O H 4 4115 -110 0
tions, confessions, etc. This year’s calculations include churches that reported a “0” for the averages in order to more closely represent these figures across all churches. Other
Gifts, Operating Expenses and Total Income do not include $0 in the computation of their averages.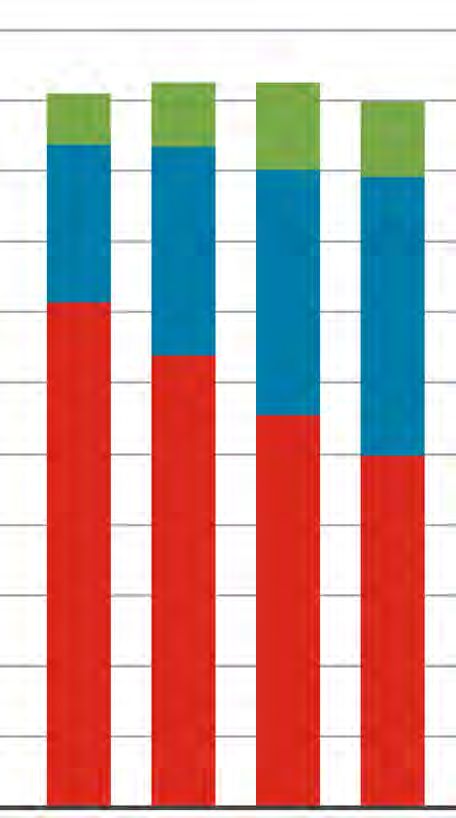
TABLE OF CONTENTS
INTRODUCTION.  .  .  .  .  .  .  .  .  .  .  .  .  .  .  .  .  .  .  .  .  .  .  .  .  .  .  .  .  .  .  .  .  .  .  .  .  .  .  .  .  .  .  .  .  .  .  .  .  .  .  .  .  .  .  .  .  .  .  .  .  .  .  .  .  .  .  .  .  .  .  .  .  .  .  .  .  .  .  .  .  .  .  .  .  .  .  .  .  .  .  .  .  .  .  .  .  .  .  .  .  .  .  .  .  .  .  .  .  .  .  .  .  .  . 3

CONGREGATIONAL STATISTICS
                     CONGREGATIONS AND MEMBERS.  .  .  .  .  .  .  .  .  .  .  .  .  .  .  .  .  .  .  .  .  .  .  .  .  .  .  .  .  .  .  .  .  .  .  .  .  .  .  .  .  .  .  .  .  .  .  .  .  .  .  .  .  .  .  .  .  .  .  .  .  .  .  .  .  .  .  .  .  .  .  .  .  .  .  .  .  .  .  .  .  .  .  .  .  .  .  .  .  .  .  .  .  .  .  . 4–5

                     GROWTH AND DECLINE .  .  .  .  .  .  .  .  .  .  .  .  .  .  .  .  .  .  .  .  .  .  .  .  .  .  .  .  .  .  .  .  .  .  .  .  .  .  .  .  .  .  .  .  .  .  .  .  .  .  .  .  .  .  .  .  .  .  .  .  .  .  .  .  .  .  .  .  .  .  .  .  .  .  .  .  .  .  .  .  .  .  .  .  .  .  .  .  .  .  .  .  .  .  .  .  .  .  .  .  .  .  .  .  .  .  . 6

                     MEMBERSHIP GROWTH AND DECLINE .  .  .  .  .  .  .  .  .  .  .  .  .  .  .  .  .  .  .  .  .  .  .  .  .  .  .  .  .  .  .  .  .  .  .  .  .  .  .  .  .  .  .  .  .  .  .  .  .  .  .  .  .  .  .  .  .  .  .  .  .  .  .  .  .  .  .  .  .  .  .  .  .  .  .  .  .  .  .  .  .  .  .  .  .  .  .  .  .  .  .  .  .  .  . 7

                     CONGREGATIONS BY RACE/ETHNICITY.  .  .  .  .  .  .  .  .  .  .  .  .  .  .  .  .  .  .  .  .  .  .  .  .  .  .  .  .  .  .  .  .  .  .  .  .  .  .  .  .  .  .  .  .  .  .  .  .  .  .  .  .  .  .  .  .  .  .  .  .  .  .  .  .  .  .  .  .  .  .  .  .  .  .  .  .  .  .  .  .  .  .  .  .  .  .  .  .  .  .  .  .  . 8

                     CONGREGATIONS BY DATE OF ORGANIZATION .  .  .  .  .  .  .  .  .  .  .  .  .  .  .  .  .  .  .  .  .  .  .  .  .  .  .  .  .  .  .  .  .  .  .  .  .  .  .  .  .  .  .  .  .  .  .  .  .  .  .  .  .  .  .  .  .  .  .  .  .  .  .  .  .  .  .  .  .  .  .  .  .  .  .  .  .  .  .  .  .  .  .  .  .  . 9

                     CONGREGATION SIZE BY MEMBERSHIP.  .  .  .  .  .  .  .  .  .  .  .  .  .  .  .  .  .  .  .  .  .  .  .  .  .  .  .  .  .  .  .  .  .  .  .  .  .  .  .  .  .  .  .  .  .  .  .  .  .  .  .  .  .  .  .  .  .  .  .  .  .  .  .  .  .  .  .  .  .  .  .  .  .  .  .  .  .  .  .  .  .  .  .  .  .  .  .  .  .  .  .  .  . 10

                     WORSHIP ATTENDANCE .  .  .  .  .  .  .  .  .  .  .  .  .  .  .  .  .  .  .  .  .  .  .  .  .  .  .  .  .  .  .  .  .  .  .  .  .  .  .  .  .  .  .  .  .  .  .  .  .  .  .  .  .  .  .  .  .  .  .  .  .  .  .  .  .  .  .  .  .  .  .  .  .  .  .  .  .  .  .  .  .  .  .  .  .  .  .  .  .  .  .  .  .  .  .  .  .  .  .  .  .  .  .  .  .  . 11

                     WORSHIP ATTENDANCE AND MEMBERSHIP. .  .  .  .  .  .  .  .  .  .  .  .  .  .  .  .  .  .  .  .  .  .  .  .  .  .  .  .  .  .  .  .  .  .  .  .  .  .  .  .  .  .  .  .  .  .  .  .  .  .  .  .  .  .  .  .  .  .  .  .  .  .  .  .  .  .  .  .  .  .  .  .  .  .  .  .  .  .  .  .  .  .  .  .  .  .  .  .  . 12

                     CONGREGATIONAL DESIGNATIONS.  .  .  .  .  .  .  .  .  .  .  .  .  .  .  .  .  .  .  .  .  .  .  .  .  .  .  .  .  .  .  .  .  .  .  .  .  .  .  .  .  .  .  .  .  .  .  .  .  .  .  .  .  .  .  .  .  .  .  .  .  .  .  .  .  .  .  .  .  .  .  .  .  .  .  .  .  .  .  .  .  .  .  .  .  .  .  .  .  .  .  .  .  .  .  . 13

                     CHRISTIAN EDUCATION/FAITH FORMATION. .  .  .  .  .  .  .  .  .  .  .  .  .  .  .  .  .  .  .  .  .  .  .  .  .  .  .  .  .  .  .  .  .  .  .  .  .  .  .  .  .  .  .  .  .  .  .  .  .  .  .  .  .  .  .  .  .  .  .  .  .  .  .  .  .  .  .  .  .  .  .  .  .  .  .  .  .  .  .  .  .  .  .  .  . 14–15

                     CONGREGATIONAL OUTREACH .  .  .  .  .  .  .  .  .  .  .  .  .  .  .  .  .  .  .  .  .  .  .  .  .  .  .  .  .  .  .  .  .  .  .  .  .  .  .  .  .  .  .  .  .  .  .  .  .  .  .  .  .  .  .  .  .  .  .  .  .  .  .  .  .  .  .  .  .  .  .  .  .  .  .  .  .  .  .  .  .  .  .  .  .  .  .  .  .  .  .  .  .  .  .  .  .  .  . 16

                     MISSION/IMMERSION/SERVICE TRIPS .  .  .  .  .  .  .  .  .  .  .  .  .  .  .  .  .  .  .  .  .  .  .  .  .  .  .  .  .  .  .  .  .  .  .  .  .  .  .  .  .  .  .  .  .  .  .  .  .  .  .  .  .  .  .  .  .  .  .  .  .  .  .  .  .  .  .  .  .  .  .  .  .  .  .  .  .  .  .  .  .  .  .  .  .  .  .  .  .  .  .  .  .  .  .  . 17

FINANCIAL STATISTICS
                     LOCAL CHURCH FINANCIAL TRENDS.  .  .  .  .  .  .  .  .  .  .  .  .  .  .  .  .  .  .  .  .  .  .  .  .  .  .  .  .  .  .  .  .  .  .  .  .  .  .  .  .  .  .  .  .  .  .  .  .  .  .  .  .  .  .  .  .  .  .  .  .  .  .  .  .  .  .  .  .  .  .  .  .  .  .  .  .  .  .  .  .  .  .  .  .  .  .  .  .  .  .  .  .  .  . 18

                     THE CHURCH DOLLAR.  .  .  .  .  .  .  .  .  .  .  .  .  .  .  .  .  .  .  .  .  .  .  .  .  .  .  .  .  .  .  .  .  .  .  .  .  .  .  .  .  .  .  .  .  .  .  .  .  .  .  .  .  .  .  .  .  .  .  .  .  .  .  .  .  .  .  .  .  .  .  .  .  .  .  .  .  .  .  .  .  .  .  .  .  .  .  .  .  .  .  .  .  .  .  .  .  .  .  .  .  .  .  .  .  .  .  . 19

                     STEWARDSHIP AND MISSION SUPPORT .  .  .  .  .  .  .  .  .  .  .  .  .  .  .  .  .  .  .  .  .  .  .  .  .  .  .  .  .  .  .  .  .  .  .  .  .  .  .  .  .  .  .  .  .  .  .  .  .  .  .  .  .  .  .  .  .  .  .  .  .  .  .  .  .  .  .  .  .  .  .  .  .  .  .  .  .  .  .  .  .  .  .  .  .  .  .  .  .  . 20–21

MINISTERIAL STATISTICS
                     SUMMARY OF UCC AUTHORIZED MINISTERS .  .  .  .  .  .  .  .  .  .  .  .  .  .  .  .  .  .  .  .  .  .  .  .  .  .  .  .  .  .  .  .  .  .  .  .  .  .  .  .  .  .  .  .  .  .  .  .  .  .  .  .  .  .  .  .  .  .  .  .  .  .  .  .  .  .  .  .  .  .  .  .  .  .  .  .  .  .  .  .  .  .  .  .  .  .  .  . 22

                     SUMMARY OF UCC ORDAINED MINISTERS.  .  .  .  .  .  .  .  .  .  .  .  .  .  .  .  .  .  .  .  .  .  .  .  .  .  .  .  .  .  .  .  .  .  .  .  .  .  .  .  .  .  .  .  .  .  .  .  .  .  .  .  .  .  .  .  .  .  .  .  .  .  .  .  .  .  .  .  .  .  .  .  .  .  .  .  .  .  .  .  .  .  .  .  .  .  .  .  .  .  . 23

                     TRENDS IN ORDAINED MINISTRY OVER TIME .  .  .  .  .  .  .  .  .  .  .  .  .  .  .  .  .  .  .  .  .  .  .  .  .  .  .  .  .  .  .  .  .  .  .  .  .  .  .  .  .  .  .  .  .  .  .  .  .  .  .  .  .  .  .  .  .  .  .  .  .  .  .  .  .  .  .  .  .  .  .  .  .  .  .  .  .  .  .  .  .  .  .  .  .  .  .  . 24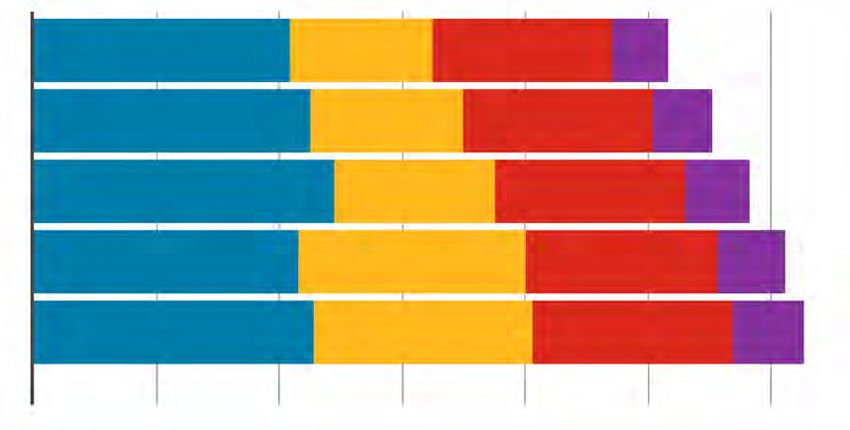
AUTHORIZED MINISTERS BY AGE.  .  .  .  .  .  .  .  .  .  .  .  .  .  .  .  .  .  .  .  .  .  .  .  .  .  .  .  .  .  .  .  .  .  .  .  .  .  .  .  .  .  .  .  .  .  .  .  .  .  .  .  .  .  .  .  .  .  .  .  .  .  .  .  .  .  .  .  .  .  .  .  .  .  .  .  .  .  .  .  .  .  .  .  .  .  .  .  .  .  .  .  .  .  .  .  .  .  . 25

    AUTHORIZED MINISTERS BY RACE/ETHNICITY.  .  .  .  .  .  .  .  .  .  .  .  .  .  .  .  .  .  .  .  .  .  .  .  .  .  .  .  .  .  .  .  .  .  .  .  .  .  .  .  .  .  .  .  .  .  .  .  .  .  .  .  .  .  .  .  .  .  .  .  .  .  .  .  .  .  .  .  .  .  .  .  .  .  .  .  .  .  .  .  .  .  .  .  .  .  . 26

    ORDAINED MINISTERS IN LOCAL CHURCHES BY RACE/ETHNICITY .  .  .  .  .  .  .  .  .  .  .  .  .  .  .  .  .  .  .  .  .  .  .  .  .  .  .  .  .  .  .  .  .  .  .  .  .  .  .  .  .  .  .  .  .  .  .  .  .  .  .  .  .  .  .  .  .  .  .  .  .  .  .  .  .  .  .  .  . 27

    AUTHORIZED MINISTERS BY GENDER.  .  .  .  .  .  .  .  .  .  .  .  .  .  .  .  .  .  .  .  .  .  .  .  .  .  .  .  .  .  .  .  .  .  .  .  .  .  .  .  .  .  .  .  .  .  .  .  .  .  .  .  .  .  .  .  .  .  .  .  .  .  .  .  .  .  .  .  .  .  .  .  .  .  .  .  .  .  .  .  .  .  .  .  .  .  .  .  .  .  .  .  .  .  . 28

    ORDAINED MINISTERS IN LOCAL CHURCHES BY GENDER .  .  .  .  .  .  .  .  .  .  .  .  .  .  .  .  .  .  .  .  .  .  .  .  .  .  .  .  .  .  .  .  .  .  .  .  .  .  .  .  .  .  .  .  .  .  .  .  .  .  .  .  .  .  .  .  .  .  .  .  .  .  .  .  .  .  .  .  .  .  .  .  .  .  .  .  . 29

    ORDINATIONS AND MEMBERS IN DISCERNMENT.  .  .  .  .  .  .  .  .  .  .  .  .  .  .  .  .  .  .  .  .  .  .  .  .  .  .  .  .  .  .  .  .  .  .  .  .  .  .  .  .  .  .  .  .  .  .  .  .  .  .  .  .  .  .  .  .  .  .  .  .  .  .  .  .  .  .  .  .  .  .  .  .  .  .  .  .  .  .  .  .  .  .  .  . 30

SPECIAL REPORTS
    OUR WHOLE LIVES/SEXUALITY AND OUR FAITH .  .  .  .  .  .  .  .  .  .  .  .  .  .  .  .  .  .  .  .  .  .  .  .  .  .  .  .  .  .  .  .  .  .  .  .  .  .  .  .  .  .  .  .  .  .  .  .  .  .  .  .  .  .  .  .  .  .  .  .  .  .  .  .  .  .  .  .  .  .  .  .  .  .  .  .  .  .  .  .  .  .  .  .  . 31

    UCC CONGREGATIONS AND THEIR BUILDINGS.  .  .  .  .  .  .  .  .  .  .  .  .  .  .  .  .  .  .  .  .  .  .  .  .  .  .  .  .  .  .  .  .  .  .  .  .  .  .  .  .  .  .  .  .  .  .  .  .  .  .  .  .  .  .  .  .  .  .  .  .  .  .  .  .  .  .  .  .  .  .  .  .  .  .  .  .  .  .  .  .  .  . 32–33

    DATA HIGHLIGHTS ON THE COUNCIL FOR HEALTH AND HUMAN SERVICE MINISTRIES (CHHSM).  .  .  .  .  .  .  .  .  .  .  .  .  .  .  .  .  .  .  .  .  .  .  .  .  .  .  .  .  .  .  .  .  .  .  .  .  .  . 34–35

    GLOBAL MINISTRIES CHILD AND ELDER SPONSORSHIP PROGRAM.  .  .  .  .  .  .  .  .  .  .  .  .  .  .  .  .  .  .  .  .  .  .  .  .  .  .  .  .  .  .  .  .  .  .  .  .  .  .  .  .  .  .  .  .  .  .  .  .  .  .  .  .  .  .  .  .  .  .  .  .  .  .  .  .  .  . 36–37

    OPEN AND AFFIRMING COALITION PARTNER PRIORITIES. .  .  .  .  .  .  .  .  .  .  .  .  .  .  .  .  .  .  .  .  .  .  .  .  .  .  .  .  .  .  .  .  .  .  .  .  .  .  .  .  .  .  .  .  .  .  .  .  .  .  .  .  .  .  .  .  .  .  .  .  .  .  .  .  .  .  .  .  .  .  .  .  .  .  .  .  . 38

    PEOPLE-TO-PEOPLE PILGRIMAGE PROGRAM.  .  .  .  .  .  .  .  .  .  .  .  .  .  .  .  .  .  .  .  .  .  .  .  .  .  .  .  .  .  .  .  .  .  .  .  .  .  .  .  .  .  .  .  .  .  .  .  .  .  .  .  .  .  .  .  .  .  .  .  .  .  .  .  .  .  .  .  .  .  .  .  .  .  .  .  .  .  .  .  .  .  .  .  .  .  .  .  .  . 39
    THE PENSION BOARDS PARTNERS WITH THE NATIONAL SETTING TO STRENGTHEN FAITHFUL AND FRUITFUL MINISTRY .  .  .  .  .  .  .  .  .  .  .  .  .  .  .  .  .  .  .  .  . 40

    THE UCC 3 GREAT LOVES INITIATIVE.  .  .  .  .  .  .  .  .  .  .  .  .  .  .  .  .  .  .  .  .  .  .  .  .  .  .  .  .  .  .  .  .  .  .  .  .  .  .  .  .  .  .  .  .  .  .  .  .  .  .  .  .  .  .  .  .  .  .  .  .  .  .  .  .  .  .  .  .  .  .  .  .  .  .  .  .  .  .  .  .  .  .  .  .  .  .  .  .  .  .  .  .  .  .  . 41

    TOGETHER IN HOPE: SOUTHERN ASIA INITIATIVE 2019-2020 .  .  .  .  .  .  .  .  .  .  .  .  .  .  .  .  .  .  .  .  .  .  .  .  .  .  .  .  .  .  .  .  .  .  .  .  .  .  .  .  .  .  .  .  .  .  .  .  .  .  .  .  .  .  .  .  .  .  .  .  .  .  .  .  .  .  .  .  .  .  .  . 42–43

    2019 DOMESTIC ACTION ALERT ISSUES.  .  .  .  .  .  .  .  .  .  .  .  .  .  .  .  .  .  .  .  .  .  .  .  .  .  .  .  .  .  .  .  .  .  .  .  .  .  .  .  .  .  .  .  .  .  .  .  .  .  .  .  .  .  .  .  .  .  .  .  .  .  .  .  .  .  .  .  .  .  .  .  .  .  .  .  .  .  .  .  .  .  .  .  .  .  .  .  .  .  .  .  .  . 44

    GLOBAL MINISTRIES PARTNER PRIORITIES: 2019 ACTION ALERT .  .  .  .  .  .  .  .  .  .  .  .  .  .  .  .  .  .  .  .  .  .  .  .  .  .  .  .  .  .  .  .  .  .  .  .  .  .  .  .  .  .  .  .  .  .  .  .  .  .  .  .  .  .  .  .  .  .  .  .  .  .  .  .  .  .  .  .  .  .  .  . 45

    THE UCC AS A GREEN DENOMINATION FULL OF POTENTIAL .  .  .  .  .  .  .  .  .  .  .  .  .  .  .  .  .  .  .  .  .  .  .  .  .  .  .  .  .  .  .  .  .  .  .  .  .  .  .  .  .  .  .  .  .  .  .  .  .  .  .  .  .  .  .  .  .  .  .  .  .  .  .  .  .  .  .  .  .  . 46–47

    GLOBAL MINISTRIES: PEOPLE IN MISSION.  .  .  .  .  .  .  .  .  .  .  .  .  .  .  .  .  .  .  .  .  .  .  .  .  .  .  .  .  .  .  .  .  .  .  .  .  .  .  .  .  .  .  .  .  .  .  .  .  .  .  .  .  .  .  .  .  .  .  .  .  .  .  .  .  .  .  .  .  .  .  .  .  .  .  .  .  .  .  .  .  .  .  .  .  .  .  . 48–49

    OTHER FORMS OF STANDING IN THE UCC .  .  .  .  .  .  .  .  .  .  .  .  .  .  .  .  .  .  .  .  .  .  .  .  .  .  .  .  .  .  .  .  .  .  .  .  .  .  .  .  .  .  .  .  .  .  .  .  .  .  .  .  .  .  .  .  .  .  .  .  .  .  .  .  .  .  .  .  .  .  .  .  .  .  .  .  .  .  .  .  .  .  .  .  .  .  . 50–51

    VITAL SIGNS & STATISTICS .  .  .  .  .  .  .  .  .  .  .  .  .  .  .  .  .  .  .  .  .  .  .  .  .  .  .  .  .  .  .  .  .  .  .  .  .  .  .  .  .  .  .  .  .  .  .  .  .  .  .  .  .  .  .  .  .  .  .  .  .  .  .  .  .  .  .  .  .  .  .  .  .  .  .  .  .  .  .  .  .  .  .  .  .  .  .  .  .  .  .  .  .  .  .  .  .  .  .  .  .  .  .  .  . 52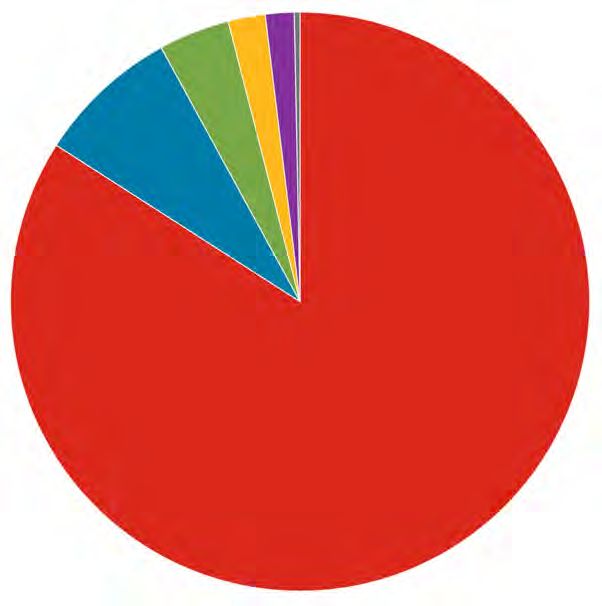
INTRODUCTION

  Who are the people, churches, and communities that are part of the United Church of Christ (UCC)? The answer to this question
  has changed over time and remains vibrant and evolving. This resource is an attempt to bear witness to that evolving vibrancy
  by providing a thorough sliver of the broader landscape that makes up the various contexts of the UCC. You’ll encounter fasci-
  nating trends and patterns that aim to capture who and how we are in this particular timeframe.

  Throughout the profile, you can find “Reflections,” which are questions to assist local church leaders in applying this data in
  their specific contexts. They can help facilitate conversations for the purpose of visioning future possibilities.

  Statistics, for some, are a foreign language. For others, they’re familiar and comforting, even. Whether you’re at either edge
  or somewhere in between, we hope the statistical tidbits presented here will provide a general overview of the denomination
  and assist us in illuminating the past, realizing the present, and envisioning the future. In addition, there are 15 Special Reports
  highlighting various areas of ministry within the United Church of Christ.

  Information for the profile primarily comes from data reported through the UCC Data Hub annually to produce the UCC Yearbook
  & Directory. We hope you enjoy this edition!

  THE CENTER FOR ANALYTICS, RESEARCH & DEVELOPMENT, AND DATA (CARDD)
  UNITED CHURCH OF CHRIST

                                                                                                                       INTRODUCTION | 3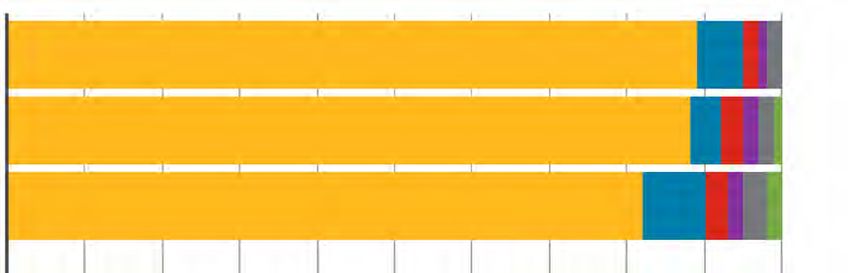
2020 | UNITED CHURCH OF CHRIST STATISTICAL PROFILE

CONGREGATIONS AND MEMBERS
At the end of 2019, there were 4,852 congregations in the United Church of Christ with a total of 802,356 members. Overall, the
membership of the UCC represented about half of one percent (0.53%) of total U.S. religious adherents and about 0.23% of the U.S.
population.* UCC membership is concentrated in the Great Lakes, Middle Atlantic, and New England regions of the country.

*2010 U.S. Religion Census http://www.usreligioncensus.org/

UCC CONGREGATIONS AND MEMBERS BY REGION

                                                                                             REGION            CHURCHES         % OF UCC      MEMBERS        % OF UCC
       REGION          CHURCHES         % OF UCC        MEMBERS         % OF UCC             West Central         681              14.0        107,257          13.4
        Western           632              13.0           74,753           9.3
                                                                                                    REGION           CHURCHES        % OF UCC    MEMBERS         % OF UCC
                                                                                                   Great Lakes          1,141          23.5        245,643         30.6

                                                                                                        REGION          CHURCHES       % OF UCC     MEMBERS        % OF UCC
                                                                                                       New England        1,009           20.8       156,035          19.4

                                                                                                    REGION           CHURCHES        % OF UCC    MEMBERS         % OF UCC
                                                                                                  Middle Atlantic       975             20.1      157,824           19.7

       REGION          CHURCHES         % OF UCC       MEMBERS          % OF UCC                    REGION           CHURCHES        % OF UCC     MEMBERS        % OF UCC
        Southern          393              8.1           59,966            7.5                    Non-Geographic        21              0.4         878             0.1

    Part of Virginia is included in Southern conferences and part of West Virginia is included in the Middle Atlantic conferences.
    States highlighted for illustration purposes only; regional numbers are calculated by conference.

4 | CONGREGATIONAL STATISTICS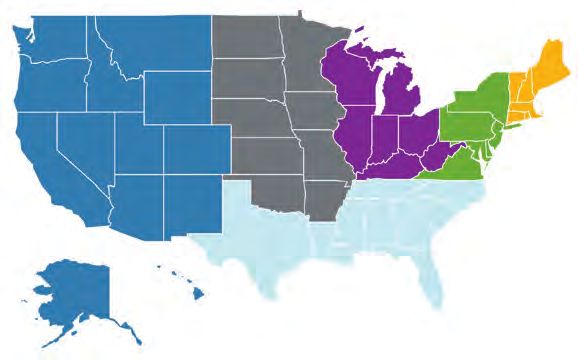
UNITED CHURCH OF CHRIST STATISTICAL PROFILE | 2020

TOP FIVE STATES: UCC CONGREGATIONS                                                In examining the distribution of congregations by state, 11.7% of all
                                                                                  UCC congregations were located in Pennsylvania, which reported
                 STATE                         PERCENTAGE (NUMBER)                the greatest number of congregations. In total, the top five states
                                                                                  with the most congregations contained over one-third (37.4%) of all
               Pennsylvania                              11.7 (570)               UCC congregations.

              Massachusetts                               7.2 (347)               Membership, as with congregations, was concentrated largely in the
                  Ohio                                    6.8 (329)               Middle Atlantic, Great Lakes, and New England states. Nearly half of
                                                                                  UCC members (47.1%) reside in the top five states by membership.
                 Illinois                                 6.6 (320)               Notably, the states with the highest number of churches are not
                California                                5.1 (246)               necessarily the churches with the highest number of members.
                                                                                  For example, Connecticut only has 4.7% of UCC churches, but has
                                                                                  6.9% of UCC members, while California has 5.1% of UCC churches
                                                                                  but only 3.6% of UCC members. This indicates that churches in
TOP FIVE STATES: UCC MEMBERSHIP                                                   Connecticut, on average, have a larger membership than churches
                                                                                  in California.
                 STATE                         PERCENTAGE (NUMBER)

               Pennsylvania                            13.4 (107,360)

                  Illinois                              10.2 (81,584)

                   Ohio                                  9.6 (77,138)

              Massachusetts                             7.0 (56,440)
                                                                                    REFLECTIONS
               Connecticut                              6.9 (55,465)                  What is “membership” anyway? Does it encompass all the ways
                                                                                      people connect with your church? How are individuals interacting
A detailed list of congregations and membership statistics by Conference can be       with your church who would not be included in the membership
found in the 2020 UCC Yearbook & Directory, p. 6.                                     figures? How might you measure these people’s participation in
                                                                                      ways that better reflect how people engage with your church? What
                                                                                      could be a useful method for capturing how the people in your
                                                                                      community are directly or indirectly connected to or impacted by
                                                                                      your church?

                                                                                                                         CONGREGATIONAL STATISTICS | 5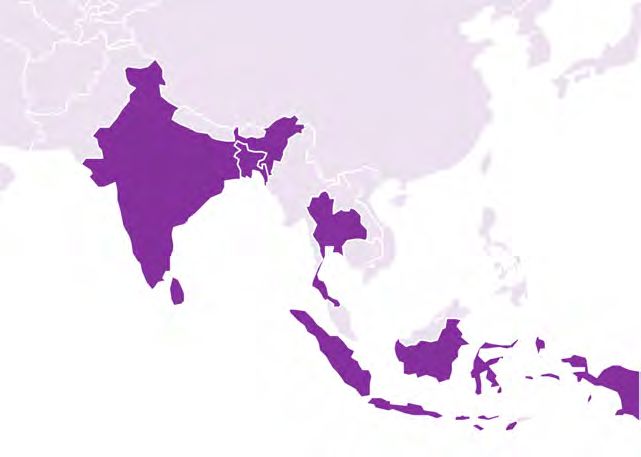
2020 | UNITED CHURCH OF CHRIST STATISTICAL PROFILE

GROWTH AND DECLINE                                                UCC CONGREGATION AND MEMBERSHIP
                                                                  CHANGES BY DECADE (1959–2019)*
Similar to other Protestant denominations, the UCC has experi-
enced a decline in the numbers of congregations and members
in recent decades. From 2009 to 2019 alone, the UCC encoun-              8,253
tered a net loss of 435 congregations and 277,843 members.          8K                                                                        2.4M
Some of this decline, however, began prior to the formation        2,229,178
of the denomination in 1957 as the number of congregations          7K                 6,803                                                  2.1M
steadily decreased despite membership increases in the UCC’s                                   6,467 6,338
early years.                                                               1,997,898
                                                                    6K                                            5,961                       1.8M

In 2019, 43 congregations were removed from denominational                           1,745,533                              5,287
records. This was a 49% decrease from 2018. From 2005 through       5K                         1,625,985                             4,852 1.5M
2007, the UCC experienced a loss of nearly three congregations
                                                                                                        1,401,682
per week on average (mostly as a result of General Synod’s
                                                                    4K                                                                        1.2M
resolution regarding same-sex marriage). In the past year, how-
ever, the loss rate has been less than one (.83) congregation                                                     1,080,199
removed from denominational records per week on average.            3K                                                                        0.9M

                                                                                                                                  802,356
Over the past year, 14 congregations have been added to de-         2K                                                                        0.6M
nominational records (this includes churches that received
standing, affiliated, or merged with another congregation). In
                                                                    1K                                                                        0.3M
total, 82 congregations received standing and were added to
the UCC over the last five years, which is equivalent to a new
congregation being added about every three weeks.                   0                                                                            0
                                                                          1959      1969*      1979     1989     1999      2009      2019

                                                                                    CONGREGATIONS                 MEMBERSHIP
                                                                   *The significant decrease in congregations between 1955 and 1965 was due
                                                                   largely to the decisions of 1,000 Congregational Christian Churches not to
                                                                   unite with the United Church of Christ. During this same period, however, UCC
                                                                   congregations experienced an increase in membership, which is not reflected in
                                                                   this table. A detailed statistical summary by year can be found in the 2020 UCC
                                                                   Yearbook & Directory, pp. 10–11.

6 | CONGREGATIONAL STATISTICS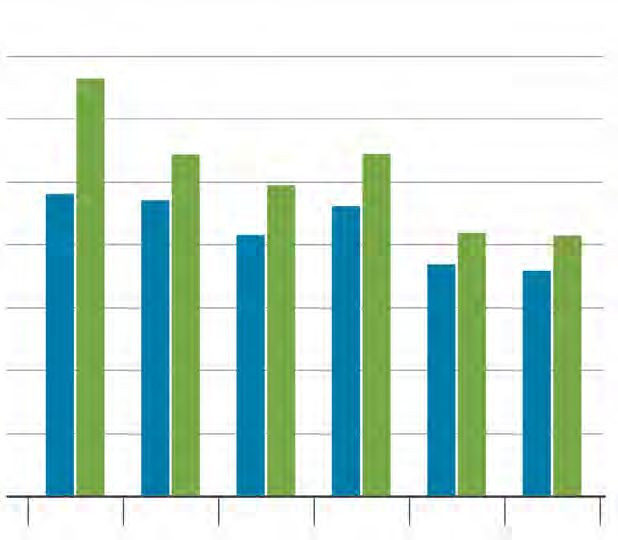
UNITED CHURCH OF CHRIST STATISTICAL PROFILE | 2020

MEMBERSHIP ADDITIONS AND REMOVALS OVER                                                             MEMBERSHIP GROWTH AND
TIME (1965–2019)*                                                                                  DECLINE
                                                                                                   In general, the number of members removed each year exceeds the
 140,000
              128,988
                                                                                                   number of members added for that same time period. Members are
 130,000                                                                                           removed from denominational records for a number of reasons in-
                    126,849
           127,903
 120,000                                                                                           cluding death, transfer of membership to another denomination, or
 110,000                                                                                           updating of local church membership records.
                                  106,453
 100,000
            95,023            94,921                                                               The net difference between UCC members added and removed
  90,000         89,443                89,267                                                      from congregational membership rolls has continued to decline as
                     82,637     87,093
  80,000                                    78,591                                                 total membership has decreased. In 2019, there was a net removal
                          76,765
  70,000                       71,569
                                                                                                   of 12,341 members, which was smaller than in any of the most
                                               65,516
                                                    62,235                                         recent years: 2018 had a net removal of 16,302 members and in
  60,000                           59,562
                                                                                                   2017, 16,600. Looking further back, in 2015, there was a net loss of
                                                        52,714                      46,830
  50,000                                                                                           19,625 members and in 2010, 18,435 members. (Note that net loss
  40,000                                                       40,720     42,349                   figures represented here are different than figures represented in
                                                                            30,822                 the UCC Yearbook & Directory, which are based on total member-
  30,000                                                              28,395
                                                                          22,724
                                                                                                   ship.)
  20,000
                                                                            18,481
  10,000
                                   1980

                                          1985

                                                 1990

                                                        1995
             1965

                    1970

                           1975

                                                               2000

                                                                      2005

                                                                             2010

                                                                                     2015

                                                                                            2019

                                                                                                     REFLECTIONS
                           ADDED                   REMOVED
                                                                                                       How has your church’s membership and worship attendance
                                                                                                       changed over the last decade? What trends in the last 10 years
  *Addition and removal numbers reflect current congregational changes for a                           have you noticed at other churches in your community? Have some
  particular year; they do not include additions for congregations that joined the                     churches closed, merged, or changed denominational affiliation?
  UCC or removals for congregations that closed, merged, or disaffiliated from the                     Have new churches opened in your area? How do these closed,
  denomination.
                                                                                                       merged, changed affiliation, and new churches compare to the ex-
                                                                                                       isting churches? What trends have you noticed in non-church orga-
                                                                                                       nizations in your community, such as schools and nonprofits?

                                                                                                                                          CONGREGATIONAL STATISTICS | 7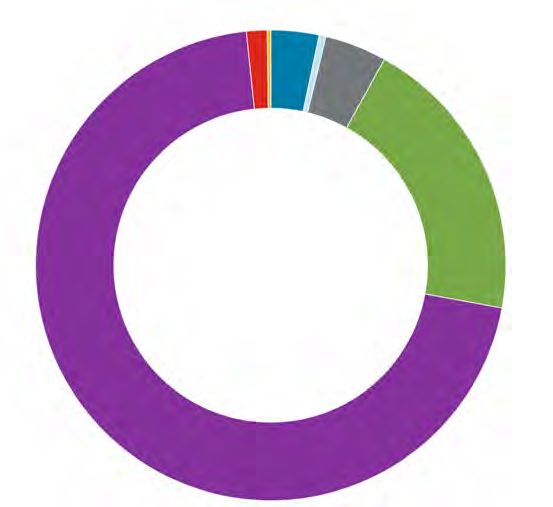
2020 | UNITED CHURCH OF CHRIST STATISTICAL PROFILE

CONGREGATIONS BY                                                                       UCC CONGREGATIONS BY RACIAL/ETHNIC
RACE/ETHNICITY                                                                         SELF-IDENTIFICATION (PERCENTAGE)

A substantial majority of congregations in the UCC self-identify as                      100

                                                                                               90.2
White/Euro-American (meaning that most members of a congre-

                                                                                                                                         83.9
                                                                                         90
gation belong to that particular racial/ethnic group). Over time,
however, the UCC as a whole is becoming more racially/ethnically                         80

diverse. Over the last decade, the percentage of self-reported pri-                      70
marily White/Euro-American congregations decreased from 90.2% in
                                                                                         60
2009 to 83.9% in 2019. During this same time frame, the percentage
of Bi-Racial/Multi-Racial and Other congregations increased from                         50
1.5% in 2009 to 6.4% in 2019.* In addition, the percentage of Black/
                                                                                         40
African American and Asian/Pacific Islander congregations both in-
creased by 0.6% during this time period, from 4.3% to 4.9% and 3.3%                      30

to 3.9% respectively. The proportion of Native American congrega-                        20
tions also increased slightly, from 0.4% to 0.6%. One cause of these
                                                                                         10

                                                                                                                                                                         6.4
shifts over time may be due to the fact that the majority of con-

                                                                                                                                                4.9
                                                                                                      4.3

                                                                                                                                                      3.9
                                                                                                            3.3

                                                                                                                               1.5

                                                                                                                                                                   0.6
                                                                                                                  0.4
                                                                                                                         0.4

                                                                                                                                                             0.4
gregations that close, merge, or disaffiliate with the denomination                      0
are primarily White/Euro-American congregations, thus decreasing                                                  2009                                2019
the overall proportion of these congregations, while newer UCC
congregations tend to be more racially/ethnically diverse.                                                          WHITE/EURO-AMERICAN

*Note — Bi-Racial/Multi-Racial was introduced as a category in the Data Hub in 2011;                               BLACK/AFRICAN AMERICAN
2009 figures reflect only congregations that identified as Other.
                                                                                                ASIAN/PACIFIC ISLANDER                   HISPANIC/LATINO

                                                                                         NATIVE AMERICAN                         BI-RACIAL/MULTI-RACIAL/OTHER

8 | CONGREGATIONAL STATISTICS
UNITED CHURCH OF CHRIST STATISTICAL PROFILE | 2020
UCC CONGREGATIONS BY DATE OF ORGANIZATION CONGREGATIONS BY
(PERCENTAGE) DATE OF ORGANIZATION
40
While the UCC has only been in existence since 1957, many of its
37.7 congregations were founded by predecessor denominations. The
35 vast majority of churches (85.1%) were organized before the UCC’s
founding year. The latter nineteenth century (1850-1899) was the
30 most common founding era for UCC churches while just under 1 in
20 UCC churches (4.4%) has been founded in 2000 or later.
25
20
17.3
15
13.8
12.3 12.9
10
5 4.4
1.6
0
9
9
9
9
9
99
9
01
4
4
79
9
9
16
19
18
18
19
–1
–2
–
0–
0–
0–
0–
00
00
16
5
5
0
0
16
17
19
18
20
19
18
CONGREGATIONAL STATISTICS | 92020 | UNITED CHURCH OF CHRIST STATISTICAL PROFILE
CONGREGATION SIZE BY PERCENTAGE OF UCC MEMBERS
MEMBERSHIP BY CONGREGATION SIZE
The majority (92.1%) of UCC members belong to
congregations with fewer than 400 members with
almost half (47.8%) attending congregations with 100 2.1
members or fewer. This reflects an overall trend 1.0
2019
23.7 24.1 27.0 17.4 4.8
within the UCC of membership being increasingly
concentrated in smaller churches; in 2009, 88.3%
of UCC members belonged to churches with 400
members or fewer and 39.3% belonged to churches
with 100 members or fewer. The biggest changes in
3.5
the past 10 years have been in churches with fewer
2009
17.9 21.4 27.2 21.8 6.8 1.4
than 50 members, which have increased from 17.9%
to 23.7% of members since 2009, and churches with
201-400 members, which have decreased from 21.8%
to 17.4% of members since 2009. 0 10 20 30 40 50 60 70 80 90 100
CONGREGATION SIZE
1–50 51–100 101–200 201–400
401–600 601–1,000 1,001 AND OVER
10 | CONGREGATIONAL STATISTICSUNITED CHURCH OF CHRIST STATISTICAL PROFILE | 2020
PERCENTAGE OF UCC CONGREGATIONS BY WORSHIP ATTENDANCE
WORSHIP ATTENDANCE
When considering worship attendance figures rather than mem-
bership size, even more congregations are categorized as smaller
55 churches. In 2019, over eight in ten churches in the UCC (85.3%) had
54.1 a weekly worship attendance of fewer than 100, a 12.9% increase
50
from 2010 and a 38.9% increase from 2000. Over time, the percent-
45 47.8 age of congregations with greater worship attendance numbers has
40.8
40 decreased steadily, with the most dramatic decreases occurring in
% OF MEMBERS ATTENDING
35 33.6 34.4 34.7 congregations of 101-400 worship attenders since 1995. As a result,
33.3 33.4
31.2 over half (54.1%) of all UCC congregations now have a weekly wor-
30
31.7 ship attendance of 1–50 individuals.
25 28.3 27.8
20 18.0
17.9 16.7
15 13.3
10.0 8.4 11.2
10 9.8 9.0
9.0 8.9 5.6
5 7.7 3.4
2.9
4.9 3.6 2.4
0
1.5 1.9 1.1 .7 .7 .5
1995 2000 2005 2010 2015 2019
SIZE OF WORSHIP ATTENDANCE
1–50 51–100 101–150 151–200
201–400 401 AND OVER
REFLECTIONS
How does weekly worship attendance shift in your church
throughout different times of the year? In what ways does the
worship experience differ among a smaller group compared to a
larger group? What trends in worship have you noticed in your
congregation and community?
CONGREGATIONAL STATISTICS | 112020 | UNITED CHURCH OF CHRIST STATISTICAL PROFILE
WORSHIP ATTENDANCE AVERAGE PERCENTAGE OF WORSHIP
AND MEMBERSHIP ATTENDANCE TO MEMBERSHIP BY SIZE
The relationship between worship attendance and
85
% OF WORSHIP ATTENDANCE COMPARED TO MEMBERSHIP
membership continues to shift incrementally over time.
80.2 85.6
From 1995 to 2019, fewer people generally attended 80
77.5
76.1 75.4
worship as an overall proportion of the numbers of church 75 73.4
members, with two exceptions – the largest churches,
70
which have effectively remained stable, and the smallest
65
churches, which have seen an increase. In 1995, churches
with 1,001+ members reported on average that 33.4% of 60 59.7 59.7
58.2
the number of people attended worship compared to the 56.3 55.7
55 54.0
total membership; while this figure has risen and fallen in
50 49.2 49.1
the subsequent decades, the current figure is 32.2%. On 46.8 45.7
average, in 1995 there were 73.4% of people attending 45 43.7
42.7
40.8 41.1
worship compared to the overall membership of a 1–50 40 38.9
36.4 36.8 37.5
member church; this percentage has risen to 85.6% in 2019. 35.7
35.1
35.3
35 34.1
In 2018, an average of 85.4% of members attended weekly 33.5 35.7
36.0 33.9 34.2 32.2
30 34.0
worship for the same size congregation. The overall patterns 33.4 31.3 31.6 29.6
29.5 30.9 29.2
suggest that a greater share of members may attend worship 25
in smaller congregations than larger congregations, though 1995 2000 2005 2010 2015 2019
this cannot be known for certain, as those who attend
worship may not all be members.
CONGREGATION SIZE
1–50 51–100 101–200 201–400
REFLECTIONS
Are the people who worship at your church the same as or 401–600 601–1,000 1,001 AND OVER
different from the people who are members? How much do
local, national, and/or global events shape participation
and attendance at your church? Are there particular days
or worship events that people are more likely to attend?
Are non-members who attend worship looking to join a
church, just visiting your area for a short time, or are they
attending for other reasons? How do you know?
12 | CONGREGATIONAL STATISTICSUNITED CHURCH OF CHRIST STATISTICAL PROFILE | 2020
PERCENTAGE OF OPEN AND AFFIRMING (ONA) CONGREGATIONAL
AND ACCESSIBLE CONGREGATIONS BY DESIGNATIONS
MEMBERSHIP SIZE
In the past decade, there was an 87.8% increase in the number
of Open and Affirming (ONA) congregations in the United Church
MEMBERSHIP ONA ACCESSIBLE
of Christ, from 842 churches in 2009 (15.9% of all UCC churches
at that time) to 1,581 churches (32.6% of all UCC congregations in
1–50 20.7% 73.1% 2019). ONA designation tends to be more common as church size
increases, with half or nearly half of the largest churches in the UCC
51–100 29.8% 83.6% (with 601-1000 and 1001+ members) having the ONA designation.
101–200 37.2% 89.1% Self-reported accessibility also tended to increase with church
size. While the specific types and degrees of accessibility among
201–400 40.8% 96.5% these congregations are unknown, it is possible that these figures
partly reflect the resources churches have available to address the
401–600 40.1% 96.6% accessibility of their space.
601–1000 50.5% 96.1%
1001+ 45.7% 97.8%
CONGREGATIONAL STATISTICS | 132020 | UNITED CHURCH OF CHRIST STATISTICAL PROFILE
CHRISTIAN EDUCATION/ PERCENTAGE OF CHRISTIAN EDUCATION/FAITH
FAITH FORMATION FORMATION PARTICIPANTS TO TOTAL
MEMBERSHIP (1955–2019)
Since the 1950s, enrollment and attendance numbers for Christian
Education/Faith Formation programming (also known as Church
School or Sunday School enrollment in previous years) has been 65
declining along with membership numbers. While this decline is 61.3
60
not surprising, it is interesting to note that overall participation/
enrollment rates, when computed as a percentage of total 55
membership, have decreased significantly from the 1950s and 52.4
50
1960s but has been a fairly stable percentage for the last decade.
% OF PARTICIPANTS
Currently, percentages indicate that roughly two out of every ten 45
people in the UCC (19.4%) participated in these types of programs,
40
at least in the traditional sense.
35
When comparing participation/enrollment with average weekly 31.8
30
attendance figures, even fewer children and adults participated 26.8 25.9
in Christian Education/Faith Formation programs on a regular 25
basis. The gap between enrollment and attendance has increased 21.3
20
incrementally over time, meaning that smaller percentages of
total participants in Christian Education/Faith Formation programs 19.6 19.4
15
are attending these programs on a weekly basis. These patterns
1955 1965 1975 1985 1995 2005 2015 2019
matched average weekly worship attendance patterns, which have
also decreased over time.
14 | CONGREGATIONAL STATISTICSUNITED CHURCH OF CHRIST STATISTICAL PROFILE | 2020
PERCENTAGE OF CHRISTIAN EDUCATION/FAITH In general, adult Faith Formation programs were attended more
regularly than children/youth programs. This may be due to a
FORMATION ATTENDANCE OUT OF TOTAL
number of factors including competing interests for young people’s
ENROLLMENT attention on Sunday mornings, the overall decline in numbers of
younger people in congregational life, and increases in the diversity
of family situations around divorce and co-parenting.
70
66.4
60
50
54.4
54.3
49.4
48.0
47.0
46.1
40
41.4
41.8
41.5
36.8
35.8
30
20
10
0
1995 2000 2005 2010 2015 2019
CHILDREN/YOUTH (0–17) ADULTS (18+)
CONGREGATIONAL STATISTICS | 152020 | UNITED CHURCH OF CHRIST STATISTICAL PROFILE
CONGREGATIONAL AVERAGE AND MEDIAN COMMUNITY MEMBERS
OUTREACH ENGAGED BY CONGREGATIONAL MEMBERSHIP
SIZE IN 2019
Congregational reports indicated that an average of 950
community members and a median of 200 community
3,385
members were impacted by each local church’s outreach
3500
activities and initiatives in 2019. The total number of
community members engaged in 2019 was 2,055,868 with 3000
47.2% of congregations reporting. The average number of
2,310
community members is notably higher than the median, 2500
which suggests that some churches may have a particular
COMMUNITY MEMBERS
focus on community outreach or may engage in types of 2000
outreach that tend to engage more people than other
1,450
1,320
types of outreach. 1500
1,050
1,000
900
1000
500
498
354
500
307
250
90
30
0
1–50 51–100 101–200 201–400 401–600 601–1,000 1,001
AND
OVER
CONGREGATIONAL MEMBERSHIP SIZE
AVERAGE MEDIAN
16 | CONGREGATIONAL STATISTICSUNITED CHURCH OF CHRIST STATISTICAL PROFILE | 2020
PERCENTAGE OF CONGREGATIONS PARTICIPATING MISSION/IMMERSION/
IN MISSION TRIPS BY MEMBERSHIP SIZE SERVICE TRIPS
(PERCENTAGE OF CONGREGATIONS WITHIN EACH
Since 2014, congregations have been asked to report
MEMBERSHIP SIZE CATEGORY)
whether members participated in a U.S. or international
mission/immersion/service trip. In 2019, 574 (11.8%)
50 congregations reported that members had participated
46.6 in these types of trips. While mission/immersion/service
45 trips tend to be more common as church size increases,
the highest proportion of congregations participating
40 39.1
in these types of trips was actually the second-highest
35 membership category, churches with 601–1000 members,
33.2 where nearly half (46.6%) reported participation.
30
25
21.6
20
15
12.3
10
6.1
5
1.8
0
0
0
0
00
R
50
0
10
20
40
60
VE
0
1–
–
1–
1,
1–
1–
O
51
1–
10
20
40
D
60
N
A
01
0
1,
CONGREGATIONAL MEMBERSHIP SIZE
CONGREGATIONAL STATISTICS | 172020 | UNITED CHURCH OF CHRIST STATISTICAL PROFILE
LOCAL CHURCH FINANCIAL TRENDS
Operating expenses for an average local congregation in 2019 were $183,852, a $2,981 (+1.6 %) average increase from 2018. Average total
income for a local church in 2019 was $235,245, a $6,877 (-3.0%) average decrease from 2018. Both the average operating expenses and in-
come for local congregations increased from average amounts reported over the past decade—from $159,820 in expenses (a 15.0% increase)
and $202,290 in income (a 16.3% increase) in 2009.
In 2009, Our Church’s Wider Mission (OCWM) giving represented 4.47% of total local church expenditures. This percentage decreased to 3.2%
of total local church expenditures in 2019.
TOTAL LOCAL CHURCH EXPENDITURES (2015–2019)
EXPENDITURE 2015 2016 2017 2018 2019
Current Local Expenses $824,425,695 $819,948,400 $850,592,022 $856,790,219 $865,208,873
Total Mission Support $62,556,317 $60,992,331 $58,151,694 $54,910,992 $51,535,392
Capital Expenses $41,686,411 $39,072,196 $55,196,673 $55,852,902 $50,254,926
TOTAL $928,668,423 $920,012,927 $963,940,389 $967,554,113 $966,999,191
18 | FINANCIAL STATISTICSUNITED CHURCH OF CHRIST STATISTICAL PROFILE | 2020
THE CHURCH DOLLAR
In the last two decades, the distribution of the church dollar has experienced some noticeable shifts. Current local expenses have increased
by $.07 while all others have decreased or remained steady. All types of UCC Giving (Conference Basic, National Basic and Other UCC Giving)
have decreased in the past 20 years.
CHANGING DISTRIBUTION OF THE CHURCH DOLLAR
$.02
$.01
$.02
2019
$.89 $.05
$.00**
$.03
$.02
2009
$.88 $.04
$.02
$.01
$.03
$.02
1999
$.82 $.08
$.03
$.02
0 0.1 0.2 0.3 0.4 0.5 0.6 0.7 0.8 0.9 1.0
CURRENT LOCAL EXPENSES CAPITAL EXPENSES OTHER GIFTS OTHER UCC GIVING* CONFERENCE BASIC
NATIONAL BASIC
*Other UCC Giving is a 2017 data collection name and process change formerly known as Special Support.
**Less than $.01
All bars do not total to $1.00 due to rounding.
REFLECTIONS
With increased demands on local churches to maintain buildings, provide salaries and benefits for pastors and other staff, and respond to needs
in the community, how does your congregation balance between internal expenses and mission giving to the wider church and other organiza-
tions? What might someone learn about your congregation by only looking at the financial summary? How do your vision and/or mission inform
the decisions your church makes around its budget? In what ways would you consider modifying your budget to more accurately represent your
mission and values, if at all?
FINANCIAL STATISTICS | 192020 | UNITED CHURCH OF CHRIST STATISTICAL PROFILE
STEWARDSHIP AND MISSION SUPPORT
Totals for mission support and giving by local congregations of LOCAL CHURCH SPECIAL MISSION OFFERINGS
the United Church of Christ decreased over the past several
years. Over the past decade, the number of churches that
have not given to any Special Mission Offering has increased. 2,600,000
In terms of dollars given, some Special Mission Offerings
have seen increases, while others have seen decreases. The 2,200,000
Christmas Fund and Strengthen the Church offerings have
TOTAL OFFERINGS IN DOLLARS
both increased since 2009 (1.9% and 23.0%, respectively). 1,800,000
Meanwhile, contributions to One Great Hour of Sharing and
Neighbors in Need have both declined since 2009 (-24.5% and
1,400,000
-14.5%, respectively).
$620,760
1,000,000
Total mission support for 2019 decreased from the previous
$504,737
year by $3,375,600 (-6.1%) and has decreased 17.6% since
600,000
2015. Changes, however, have not been uniform across giving
$1,885,846
$2,497,964
$1,326,379
$1,350,929
$1,324,810
$1,133,344
categories. While the data indicates that Other UCC Giving
has decreased dramatically in the past 4 years (-35.5%), it is 200,000
important to note that in 2017 the manner in which this data
was collected changed.* National Basic Support has declined ONE GREAT NEIGHBORS CHRISTMAS STRENGTHEN
HOUR OF IN NEED FUND THE CHURCH
by 21.4% and Conference Basic Support has declined by 9.4% SHARING
since 2015. Other Gifts—money given beyond the UCC—had
2009 2019
been relatively stable over the past several years; however,
in 2019 this category decreased by 8.5% compared to 2015.
20 | FINANCIAL STATISTICSUNITED CHURCH OF CHRIST STATISTICAL PROFILE | 2020
PERCENTAGE OF UCC TOTAL MISSION SUPPORT
CHURCHES CONTRIBUTING
TO SPECIAL OFFERINGS BY
2019
$20,842,345 $11,470,488 $14,641,006 $4,581,533
DONATION SIZE
2018
$22,504,660 $12,333,072 $15,243,949 $4,829,311
2017
$24,377,491 $13,076,094 $15,419,267 $5,278,842
30.7
31.5
2019
OVER
NONE
$1,000
2016
$21,456,779 $18,515,763 $15,514,206 $5,505,583
37.8
2015
$1–$1,000 $22,782,447 $17,784,650 $16,157,260 $5,831,960
0 10,000,000 20,000,000 30,000,000 40,000,000 50,000,000 60,000,000
25.9
OTHER GIFTS OTHER UCC GIVING* CONFERENCE BASIC SUPPORT
32.2
2009
NONE
OVER NATIONAL BASIC SUPPORT
$1,000
41.9
$1–$1,000 *Other UCC Giving is a 2017 data collection name and process change formerly known as Special Support. Prior to 2017
this data was primarily reported by conferences on behalf of their churches with the churches reporting only UCC
Special Support (giving that was sent directly to UCC agencies and organization). In 2017 this was shifted and churches
reported the bulk of this giving with the conferences reporting only the four Special Mission Offerings.
Detailed basic and special support statistics by Conference can be found in the 2020 UCC Yearbook & Directory, p. 5.
REFLECTIONS
Which special offerings of the UCC – through your Association, Conference, or the National Setting
– did your congregation support? Were there any other special appeals that your congregation
supported this past year? How do these overall mission support trends align with or differ from
your own congregation’s trends?
FINANCIAL STATISTICS | 212020 | UNITED CHURCH OF CHRIST STATISTICAL PROFILE
SUMMARY OF UCC ACTIVE, NON-RETIRED AUTHORIZED
AUTHORIZED MINISTERS UCC MINISTERS
As of December 31, 2019, there were a total of 6,609 active 106
137 21
(non-retired) Authorized Ministers in the United Church of Christ
(Ordained, Licensed, Lay Ministerial Standing, Dual Standing,
Ordained Ministerial Partner, and Commissioned). Ordained
Ministers were the largest percentage of active ministers reported 262
(84.1%); and Licensed Ministers comprised the second largest group
of Authorized Ministers (8.0%). In addition, one active (non-retired) 526
minister holds standing in the Congregational Christian Church.
5,557
ORDAINED LICENSED DUAL STANDING
ORDAINED MINISTERIAL PARTNER COMMISSIONED
LAY MINISTERIAL STANDING
22 | MINISTERIAL STATISTICSUNITED CHURCH OF CHRIST STATISTICAL PROFILE | 2020
SUMMARY OF UCC ORDAINED MINISTERS SUMMARY OF UCC ORDAINED
MINISTERS
11000
At the end of 2019, there were 9,753 reported Ordained Ministers
10000 in Full Standing, including Retired Ministers and Pastor Emeriti. Of
924
those 9,753 Ordained Ministers, nearly one-half (45.7% or 4,460)
1,225
717
1,070
were employed, with 69.7% (3,112) of those employed actively serv-
1,123
9000
ing in a local church (either a UCC church or non-UCC church). Four
out of ten (42.8% or 4,170) were Retired Ministers or Pastor Emeriti,
2,240
8000
2,959
and 11.5% (1,123) were unclassified (ministers without a reported
3,487
specialty at the time of Yearbook production) or were on a leave
of absence.
3,950
7000
4,170
6000 Over the last 34 years (1985 to 2019), Ordained Ministers only had
a numerical net decrease of 223 (-2.2%). However, the number of
employed Ordained Ministers decreased by over one third (-35.1%),
5000
while Retired Ministers and Pastor Emeriti saw an increase of 83.9%
over this same 34-year period.
4000
7,128
6,373
3000
5,519
4,952
4,460
2000
1000
0
1985 1995 2005 2015 2019
CURRENTLY EMPLOYED RETIRED/PASTOR EMERITI
OTHERS (UNCLASSIFIED/LEAVE OF ABSENCE)
MINISTERIAL STATISTICS | 232020 | UNITED CHURCH OF CHRIST STATISTICAL PROFILE
TRENDS IN ORDAINED MINISTRY OVER TIME
Since 1990, the number of Ordained Ministers has remained relatively stable, though there are slight incremental decreases in more recent
years. At the same time, the number of Retired Ministers and Pastor Emeriti has increased steadily. Notably, since 1990, the decline in
ordained ministers (-4.7%) has been much smaller than the declines in congregations (-23.3%) or membership (-50.0%) during the same time
frame.
TRENDS IN ORDAINED MINISTRY (1990–2018)
10,232 10,203 10,213
10,000
10,311 10,303 10,263 10,364 10,255 10,268 10,201 10,174 10,058 10,013
9,000 9,897
9,753
8,000
7,714
7,000 7,542
7,323 7,286
NUMBER OF MINISTERS
7,122 6,968 7,090
6,000 6,813 6,726 6,558
6,406 6,262 6,145
5,000 5,868
4,879 5,557
4,512 4,443 4,449 4,317 4,202 4,295 4,170
4,000 4,081 4,029
3,892 3,768 3,796 3,868
3,717
3,112
3,000 3,542 3,643 3,572
3,442 3,494 3,443 3,472
2,518 3,181 3,295 3,274
2,890 3,025
2,000 2,661
1,125 1,194 1,192 1,254 1,229 1,209 1,183 1,119 1,123
1,000 940 899 944 1,034 1,021 1,071
0
1990 1992 1994 1996 1998 2000 2002 2004 2006 2008 2010 2012 2014 2016 2019
ORDAINED MINISTERS (INCLUDING RETIRED) ACTIVE, NON-RETIRED ORDAINED MINISTERS
ORDAINED MINISTERS IN UCC LOCAL CHURCHES RETIRED MINISTERS UNCLASSIFIED MINISTERS*
*Ministers who don’t have a particular position listed on their record; includes Leave of Absence ministers, though the number of these ministers is minimal within the overall total.
24 | MINISTERIAL STATISTICSUNITED CHURCH OF CHRIST STATISTICAL PROFILE | 2020
ACTIVE, NON-RETIRED AUTHORIZED AUTHORIZED MINISTERS
MINISTERS BY AGE (PERCENTAGE) BY AGE
ALL ACTIVE PASTORS* AND
AUTHORIZED CO-PASTORS ONLY
Data regarding Authorized Ministers in the denomination reflects
MINISTERS a population of predominantly older clergy. When all active (non-
100 100
retired) Authorized Ministers were considered, over one half were
age 60 and above (55.4%) and over three-quarters (78.9%) were
90 90 50 and older. Local church pastors and co-pastors are increasingly
comprised of both the youngest and oldest clergy in the UCC, with
80 80 clergy under 40 increasing slightly from 5.8% to 6.8% between 2004
28.4
and 2019 and clergy 60 and older increasing dramatically to about
70 70 two-thirds of pastors and co-pastors, from 28.4% in 2004 to 66.3%
in 2019.
60 60
53.9
50 55.4 50
40 40
30 30 42.9
23.6 26.0
20 20
12.8 19.0 13.3
10 10
REFLECTIONS
How do the trends presented relate to the trends in your church?
8.2 5.8 6.8
0 0 What patterns have you noticed in the approximate ages of the
2019 2004 2019 pastors who have served your congregation? As second- and third-
career individuals as well as retirees increasingly enter seminary
UNDER 40 40–49 50–59 60+ and become ordained, how do you anticipate this might impact the
UCC and other similar traditions in the future? What are ways you
*Includes Senior Pastors; does not include Interim, Designated-Term, or
Supply Pastors.
can prepare for such an impact?
2004 data does not include Licensed or Commissioned Ministers.
MINISTERIAL STATISTICS | 252020 | UNITED CHURCH OF CHRIST STATISTICAL PROFILE
AUTHORIZED MINISTERS BY RACE/ETHNICITY
The majority (86.7%) of all active, non-retired UCC Authorized Ministers identified as White/Euro-American, with 13.3% identifying as non-
white. Among the various types of authorization, Ministers with Dual Standing were the most racially/ethnically diverse group with three in
ten (30.0%) ministers identifying as non-white. Commissioned Ministers, ministers with Lay Ministerial Standing, and ministers with Ordained
Ministerial Partner Standing were the least racially/ethnically diverse authorization groups, both in terms of having the highest rates of
clergy identifying as White/Euro-American and reflecting the fewest racial/ethnic categories.
UCC AUTHORIZED MINISTERS BY RACIAL/ETHNIC SELF-IDENTIFICATION (PERCENTAGE)
LAY MINISTERIAL ORDAINED MINISTERIAL
ORDAINED LICENSED COMMISSIONED DUAL STANDING OVERALL
RACE/ETHNICITY STANDING PARTNER STANDING
(N = 5,006) (N = 406) (N = 80) (N = 190) (N = 5,802)
(N = 9) (N = 111)
White/Euro-American 86.7 80.3 88.9 88.8 70.0 93.7 85.9
Black/African-American 9.1 11.3 11.1 11.3 12.1 4.5 9.3
Asian/Pacific Islander 2.2 3.9 0.0 0.0 14.7 0.0 2.6
Hispanic/Latino 1.2 2.2 0.0 0.0 2.6 1.8 1.3
Native American 0.2 0.2 0.0 0.0 0.5 0.0 0.2
Bi-Racial/Multi-Racial 0.5 1.7 0.0 0.0 0.0 0.0 0.6
Other 0.1 0.2 0.0 0.0 0.0 0.0 0.1
Totals do not equal 100 due to rounding.
26 | MINISTERIAL STATISTICSUNITED CHURCH OF CHRIST STATISTICAL PROFILE | 2020
ORDAINED MINISTERS IN LOCAL CHURCHES BY RACE/ETHNICITY
Regarding racial/ethnic representation in local church pastor positions, different patterns emerge based on position. Among senior/solo
pastors, clergy who identify as Black/African-American and Hispanic/Latino were proportionally under-represented (7.2% compared to
9.3% overall and 1.0% compared to 1.3% overall, respectively) while clergy who identify as Asian/Pacific Islander were represented at a
proportionally higher rate among senior/solo clergy (3.3%) compared to clergy overall (2.6%). Associate/Assistant pastors were notably more
racially/ethnically diverse compared to clergy overall, with 25.7% of clergy self-identifying as non-white compared to 14.1% of all active,
non-retired Authorized Ministers.
PERCENT OF LOCAL CHURCH PASTOR POSITIONS OF UCC ORDAINED MINISTERS BY RACE/ETHNICITY
SOLO/SENIOR
RACE/ETHNICITY CO-PASTOR ASSOCIATE/ASSISTANT PASTOR INTERIM/DESIGNATED-TERM/SUPPLY PASTOR
PASTOR
White/Euro-American 87.5 85.9 74.3 94.5
Black/African-American 7.2 9.8 20.7 4.0
Asian/Pacific Islander 3.3 1.1 2.4 1.2
Hispanic/Latino 1.0 3.3 2.1 0.0
Native American 0.1 0.0 0.0 0.0
Bi-Racial/Multi-Racial/Other 0.8 0.0 0.6 0.3
Totals do not equal 100 due to rounding.
MINISTERIAL STATISTICS | 272020 | UNITED CHURCH OF CHRIST STATISTICAL PROFILE
AUTHORIZED MINISTERS BY GENDER
In total, approximately 52.5% of active, non-retired Ordained Ministers in the United Church of Christ identified as female, 47.7% identified
as male, and 0.4% identified as transgender/gender-variant. This is a notable shift from the early 2000s, when according to the 2003 UCC
Statistical Handbook only 27% of all Ordained Ministers identified as female. Among other categories of Authorized Ministers, Licensed, Lay
Ministerial Standing, and Dual Standing ministers proportionately identified more often as male, while more than 4 out of every 5 Com-
missioned Ministers identified as female. All clergy who identify as transgender/gender-variant are ordained (27, or 0.4% of non-retired
authorized ministers).
GENDER OF ACTIVE, NON-RETIRED UCC AUTHORIZED MINISTERS (PERCENTAGE)
AUTHORIZATION FEMALE MALE TRANSGENDER/GENDER-VARIANT
Ordained 52.5 47.7 0.4
Licensed 42.1 57.9 0.0
Lay Ministerial Standing 38.5 61.5 0.0
Commissioned 82.5 17.5 0.0
Dual Standing 33.9 66.1 0.0
Ordained Ministerial Partner Standing 51.5 48.5 0.0
Totals do not equal 100 due to rounding.
28 | MINISTERIAL STATISTICSUNITED CHURCH OF CHRIST STATISTICAL PROFILE | 2020
ORDAINED MINISTERS IN LOCAL CHURCHES BY GENDER
The percentage of active, non-retired female Ordained Ministers serving in local church pastoral positions has increased dramatically in the
past fifteen years, from 28.7% in 2004 to 40.9% in 2019. Four in ten (40.9%) senior/solo pastors identified as female in 2019, compared with
28.7% in 2004. Over half (55.6%) of co-pastors, half (54.6%) of interim/designated-term/supply pastors, and two-thirds (66.7%) of associate/
assistant pastors identified as female.
LOCAL CHURCH PASTOR POSTIONS OF UCC ORDAINED MINISTERS BY GENDER—
(FEMALE AND MALE ONLY)
100 100 100 100
90 90 90 90
80 80 80 80
70 70 70 70
35.4 33.3
60 60 60 60
44.4 45.4
50 50 50 50
55.0
40 59.1 40 40 40
68.0
30 71.3 30 30 30
20 20 20 20
10 10 10 10
0 28.7 40.9 0 45.0 55.6 0 64.6 66.7 0 32.0 54.6
2004 2019 2004 2019 2004 2019 2004 2019
SOLO/SENIOR ASSOCIATE/ INTERIM/DESIGNATED-TERM/
CO-PASTOR
PASTOR ASSISTANT PASTOR SUPPLY PASTOR
FEMALE MALE
REFLECTIONS
What social trends could be driving the increased proportion of female clergy overall? Why might female clergy be underrepresented in senior/
solo pastor positions? How can call processes and church policies create a welcoming and supportive environment for all clergy? What is something
you could do today to begin cultivating such an environment?
MINISTERIAL STATISTICS | 292020 | UNITED CHURCH OF CHRIST STATISTICAL PROFILE
ORDINATIONS AND UCC ORDINATIONS (2009–2018)
MEMBERS IN DISCERNMENT
190
The number of ordinations per year decreased over the past de- 180 175
186
cade from 164 in 2009 to 105 in 2019.* Overall, the number of ordi- 163
160 167 170 159
152
nations has been in decline; the 2012–2016 annual average of ordi- 155
NUMBER OF ORDINATIONS
140
nations was 158 compared to the 2007–2011 annual average of 183
ordinations. When reviewing trends over the past several decades, 120
however, ordination numbers fluctuated in similar ways; whether 100 105*
the declines in recent years signal a trend has yet to be seen.
80
As of May 2020, there were 663 active Members in Discernment 60
(MIDs) on record within the denominational database. Some regions,
40
however, had proportionally more MIDs compared to their overall
membership proportion in the UCC – in particular, New England, 20
Southern, and Western regions. 0
2010 2011 2012 2013 2014 2015 2016 2017 2018 2019
Among MIDs who report their gender identity, females comprised
63.6% of all MIDs, a greater percentage than that of current fe-
male Authorized Ministers, which currently comprise 51.7% of all MIDS BY REGION, WITH MEMBERSHIP COMPARISON
Authorized, non-retired clergy. It is important to note that nearly
REGION MIDs % MIDs % MEMBERS
one quarter (24.1%) of all MIDs do not have a gender recorded.
Members in Discernment were also more racially/ethnically diverse Great Lakes 171 25.8 30.6
than current Authorized Ministers with 25.9% identifying as non-
Middle Atlantic 104 15.7 19.7
white (compared with 13.3% of all Authorized Ministers identifying
as non-white). New England 149 22.5 19.4
*Number of ordinations for 2019 and recent previous years is expected to increase in Southern 77 11.6 7.5
2020 as additional records are updated by Conferences.
Western 114 17.2 9.3
West Central 47 7.1 13.4
Non-Geographic 1 0.2 0.1
30 | MINISTERIAL STATISTICSUNITED CHURCH OF CHRIST STATISTICAL PROFILE | 2020
SPECIAL REPORT: OUR WHOLE LIVES/SEXUALITY AND OUR FAITH
Contributed by Amy Johnson, UCC Minister for Sexuality Education and Justice
Our Whole Lives & Sexuality and Our Faith are developed and OUR WHOLE LIVES TRAININGS (2017–2019)
maintained by a partnership between the United Church of Christ
and the Unitarian Universalist Association. We work together to 2017 2018 2019
create and update curricula, train and equip approved trainers to
train facilitators, and create and update the training process. Number of OWL Trainings 58 68 72
Local churches, conferences and/or regions in both the UCC and Number of UCC people trained 111 121 177
UUA host trainings. There has been a 24.1% increase in number of
OWL trainings hosted in the last three years. In addition, there has
been a 59.5% increase in the number of UCC people who have been
trained in these trainings.
2019 OUR WHOLE LIVES TRAININGS BY STATE
Trainings occur across the United States, with one to two trainings
occurring in Canada each year.
We currently offer three different levels of training:
Elementary Training for facilitating material for grades K–1 and
grades 4–6 TRAINING
Jr–Sr High (Secondary) OWL Training for facilitating material NO TRAINING
for grades 7–9 and grades 10–12
All Adult Levels (Young Adult, Adult, Older Adult) Training for
OUR WHOLE LIVES TRAININGS BY LEVEL 2019
facilitating material for ages 18+
Elementary Trainings 30
Jr–Sr High Trainings 34
All Adult Level Trainings 7
SPECIAL REPORTS | 312020 | UNITED CHURCH OF CHRIST STATISTICAL PROFILE
SPECIAL REPORT: UCC CONGREGATIONS AND THEIR BUILDINGS
Contributed by Erica Dollhopf, Director, Center for Analytics, Research & Development, and Data (CARDD)
As part of the Yearbook data collection effort in 2019, WORSHIP CAPACITY
CARDD offered a supplemental survey to all congregations
as an opportunity to collect data beyond the basic
450
yearbook statistics. Between January and March 2019, 2,215 434
congregations responded to the survey, representing 45.4% 400
of all UCC congregations. The 2019 supplemental survey 367
NUMBER OF CONGREGATIONS
350
focused on church buildings and their use. 342
330
300 313
Among survey respondents, the median date that congreations
250
moved into their current building is 1959, suggesting that
UCC congregational buildings are generally much newer than 200
the congregations themselves (1875 was the median founding
150
date for congregations in the year this data was collected). 131
Nearly three-quarters of congregations (73.9%) indicated 100 100 97
their congregation was still in the same location where it
50
was founded. In addition, 94.6% of congregations reported
that they owned their building, with the remainder reporting 0 10 9
renting, moving their primary worship location regularly,
using a facility for free, or some other arrangement.
FEWER THAN 50 50–99 100–149 150–199
WORSHIP CAPACITY 200–249 250–299 300–399 400–499
The average reported worship capacity was 240 and the
500–999 1000+
median value was 200. Given that over 8 in 10 congregations
in the UCC (84.2%) in 2019 reported that their average
N=2,215 churches
worship attendance was 100 or fewer, this suggests that
most churches’ seating capacity exceeds their needs on the
average Sunday. Notably, however, 16.5% of congregations
report sharing their building with another congregation,
32 | SPECIAL REPORTSUNITED CHURCH OF CHRIST STATISTICAL PROFILE | 2020
USE OF SPACE BY OTHER ORGANIZATIONS – so it is possible that a church’s worship space capacity
% OF CHURCHES is used in different ways throughout the week that are
not necessarily reflected in Sunday worship attendance
figures.
ANOTHER CONGREGATION 16.5
OTHER ORGANIZATIONS’ USE OF
A SCHOOL 14.9 CHURCH BUILDING SPACE
Most UCC churches open their doors to others in the
A DAYCARE/PRESCHOOL 14.2
community in a variety of ways. The most commonly
reported building use by another organization was use
NONPROFIT ORGANIZATION(S) 61.4
by a nonprofit organization, such as the Girl Scouts or a
SUPPORT GROUP(S) 51.4 food pantry (61.4%). Slightly over half of the respondents
(51.4%) also reported that support groups used their
GOVERNMENT (E.G. VOTING,
TOWN HALL MEETINGS, ETC.)
14.2 building. Other uses include by another congregation, by
the government (e.g. for voting or town hall meetings), a
OTHER 21.4
school, or a daycare/preschool.
0 10 20 30 40 50 60
N=2225 (congregations could select all that applied)
SPECIAL REPORTS | 332020 | UNITED CHURCH OF CHRIST STATISTICAL PROFILE
SPECIAL REPORT: DATA HIGHLIGHTS ON THE COUNCIL FOR
HEALTH AND HUMAN SERVICE MINISTRIES (CHHSM)
Contributed by Paula Baker, Executive Assistant for Events and Administration
Each year, we catalog the abundance of resources that CHHSM’s 75 CHHSM SERVICE CATEGORIES BY
corporate members have in their hands as they do the healing and
FACILITIES/PROGRAMS
service ministry of Jesus Christ through 425 facilities and programs
affiliated with the United Church of Christ.
6 1 2
In 2019, CHHSM ministries:
14
Served 2,861,601 individuals including: 11,184 children; 9,861 18
youth; 10,078 families; 29,188 older adults; 4,407 veterans;
and provided community-based ambulatory health care to
over 2.2 million people
84
Operated 33,873 residential units including: 17,932 affordable
housing units; 10,005 independent living units; and 3,517
assisted living units
Operated facilities with 13,111 beds providing acute, skilled
nursing, and memory care 298
Cared for 29,348 children in residential and non-residential
programs
Provided residential and non-residential services to over 350
people with developmental disabilities
Provided 451,459 hours of volunteer service
PRIMARY AND ACUTE HEALTH CARE SERVICES
Provided $1 billion for uncompensated and charity care
SERVICES TO PERSONS WITH DISABILITIES
Received $61 million in charitable contributions
SERVICES TO CHILDREN, YOUTH AND FAMILIES
Expended $13.6 billion for operations with revenues of $14.3 SERVICES TO OLDER ADULTS AFFORDABLE HOUSING
billion TRANSITIONAL AND SHELTER CARE HOUSING
CHARITABLE GRANT-MAKING FOUNDATIONS
34 | SPECIAL REPORTSUNITED CHURCH OF CHRIST STATISTICAL PROFILE | 2020
Maintained capital assets with a replacement value of $15 CHHSM TEN-YEAR FINANCIAL TRENDS
billion
CATEGORY 2009 2019 +/- CHANGE
Employed 89,644 people
Expended for Operations $5.2 billion $13.6 billion $8.4 billion
FINANCIAL TRENDS
Over the last decade, CHHSM organizations saw a significant
increase across all financial categories.
Charitable Contributions Received $52 million $61 million $9 million
Uncompensated and Charity Care $156 million $1 billion $844 million
Capital Assets with Replacement Values $4 billion $15 billion $11 billion
TO LEARN MORE ABOUT CHHSM, ITS MEMBERS AND SERVICES VISIT THE WEBSITE
WWW.CHHSM.ORG AND FACEBOOK HTTPS://WWW.FACEBOOK.COM/CHHSM/
TO SEE THE MOST RECENT ANNUAL REPORT: HTTPS://WWW.CHHSM.ORG/ABOUT/ANNUAL-REPORT/
SPECIAL REPORTS | 35You can also read