A study of changes potentials in persons with visual impairment
←
→
Page content transcription
If your browser does not render page correctly, please read the page content below
E3S Web of Conferences 273, 10051 (2021)                                   https://doi.org/10.1051/e3sconf/202127310051
INTERAGROMASH 2021

         A study of changes in cognitive evoked
         potentials in persons with visual impairment
         Anton Selskii1, Maksim Zhuravlev1,2, Anastasiia Runnova1,2, Elena Grinina1, Marina
         Konovalova1, and Rail Shamionov1,*
         1
          National Research Saratov State University named after N.G. Chernyshevsky, 83 Astrakhanskaya
         str., 410012, Saratov, Russia
         2
          Saratov State Medical University named after V.I. Razumovsky, 112, Bolshaia Kazahia str. 410012,
         Saratov, Russia

                       Abstract. In this work we have used psychophysiological assessments of
                       the human brain electrical activity according to the classical neurological
                       method for calculating the evoked potential. The experiment was designed
                       to extraction cognitive evoked potentials. Taking into account the
                       characteristic components, the temporal dynamics of the EEG data channels
                       was investigated. This approach allows one to consistently assess the
                       distribution of all components of the evoked potential on the subject's head
                       map. Based on the results of evoked potentials processing, a statistical
                       comparison of the components of evoked potentials in subjects of different
                       groups by channels was carried out in accordance with the Wilcoxon test.
                       Demonstrated for which channels the results significantly differ between the
                       two groups of subjects. The sequence of evoked potential analysis
                       demonstrated in the article suits for adjusting the settings of the “brain-
                       computer” systems for a particular subject and allows to select channels used
                       in further BCI training efficiently.

         1 Introduction
             Study of the human brain is one of the most important tasks of modern science. However,
         in order to study brain activity productively, scientists need an effective approach to measure
         activity, as well as a numerical method, which corresponds to any individual task. At present,
         there is a large number of methods, which allow to assess and measure activity of brain
         sections, e.g. encephalograms (EEG, MEG), functional MRI and computed tomography [1-
         3]. Each method is suitable for a certain range of tasks. In the study we used
         electroencephalogram, since this method is easy to use, non-invasive and inexpensive
         compared to others. At the same time, spatial and temporal EEG resolution is sufficient for
         the task of studying the evoked potentials (EP) and singling out individual
         psychophysiological characteristics from them [4]. After EEG data is obtained during the
         experiment, it is processed using one of the mathematical methods, the number of which is
         currently very large [5 - 9]. In this article the EEG data analysis was carried out through
         building cognitive evoked potentials [4, 10 - 14]. This method is frequently used for analysis

         *
             Corresponding author: selskiiao@gmail.com

   © The Authors, published by EDP Sciences. This is an open access article distributed under the terms of the Creative
   Commons Attribution License 4.0 (http://creativecommons.org/licenses/by/4.0/).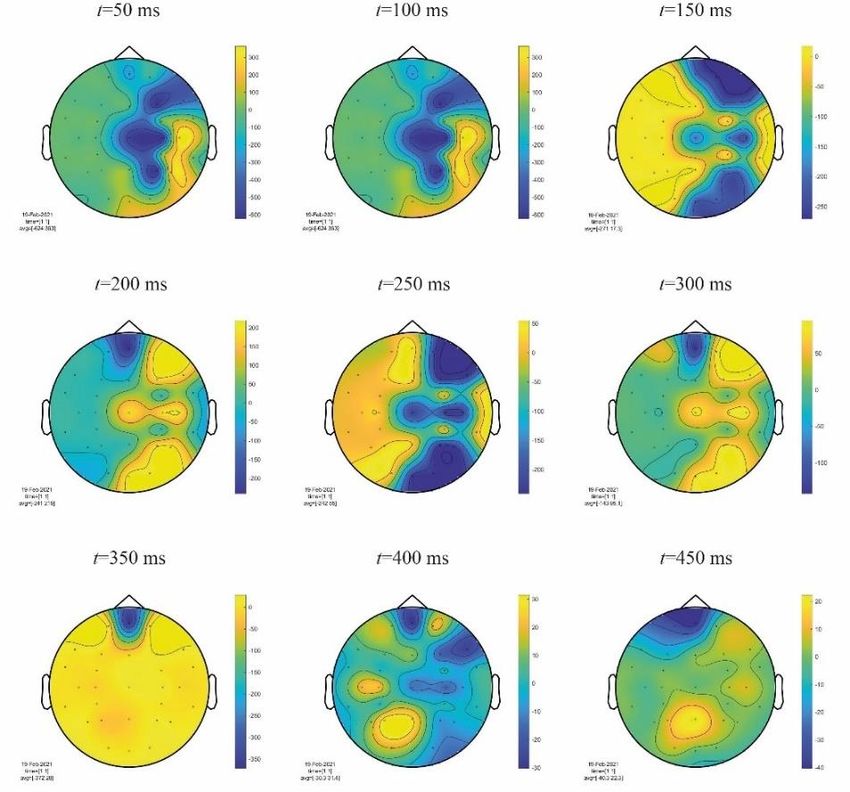
E3S Web of Conferences 273, 10051 (2021)                               https://doi.org/10.1051/e3sconf/202127310051
INTERAGROMASH 2021

         of EEG data experiments, where the subject is performing repetitive tasks, which require
         attention or cognitive activity. Apart from fundamental studies of the cognitive mechanisms
         of the human brain, evoked potentials are advantageous for the development of the “brain-
         computer interface” (BCI) systems, which are used for teaching or rehabilitating patients with
         various illnesses. In case of this kind of practical application, it is extremely important to take
         into consideration individual traits of the subject. Cognitive evoked potentials are typically
         characterized by the presence of the well-marked component P (300) [15, 16]. This
         component is present in evoked potentials when cognitive tasks are solved, and can be stably
         observed in a rather narrow time interval after stimulus presentation. However, despite the
         stability, individual characteristics (especially in case of strong suppression of cognitive
         abilities) can lead to a significant change in the observed evoked potentials, which must be
         taken into account when setting up the "brain-computer" system.
             The purpose of this work is to study the diagnostic possibility of individual peculiarities
         in primary school children with impaired vision, based on the psychophysiological
         assessments. Experimental work and statistical analysis that were carried out allow to
         evaluate differences in spatial distributions and temporal dynamics of electrical activity of
         the brain.

         2 Methods and Experiment

         2.1 Materials
         The study involved two groups of subjects: group A, 4 children aged 9-10 years with vision
         impairment up to 25%; group B, 4 children aged 9-10 years with normal vision (90-100%).
         The criteria for exclusion from the study were severe neurological disorders. Moreover, every
         child underwent preliminary psychological tests in order to exclude cognitive deficit
         problems and psycho-emotional instability. The experiment was built around audio
         stimulation. Thus, the group of children was not supposed to have any problems related to
         cognitive tasks and attention tasks in the course of the experiment. Two subjects that
         demonstrated certain individual peculiarities in the evoked potentials, component P (300)
         specifically, were selected from the preliminary group based on the experiment results. To
         follow is demonstration of the detailed study of their abilities, as well as the statistical
         comparison.
             EEG data in the course of the experiment was recorded with the electroencephalograph
         (MTD "Medikom", Russian Federation), 21 active EEG channels with a temporal resolution
         of 250 Hz according to the standard scheme "10 - 20" [17]. All the experiments were carried
         out in the darkened room with shades on the windows to prevent direct light access. The
         subject was seated in a comfortable armchair individually adjusted for him/her. The
         experiment duration for every child was about 25 minutes. EEG recording included the state
         of calm wakefulness with eyes closed at the beginning and at the end of the experiment, as
         well as taking a cognitive test, which involved counting repetitive groups of short sound
         stimuli with rest pauses. The duration of the stages of recording quiet wakefulness was 3
         minutes each. The duration of the cognitive test involved 3 stages of active counting 3
         minutes long each and 4 stages of rest 2 minutes each. Short sound stimuli came in groups
         from 1 to 4 in a pseudo-random order, which was the same for all subjects. The goal was to
         indicate an even or odd number of stimuli in the group. For each group of stimuli the subject
         pressed the corresponding left or right button on the control panel, that a child was holding
         in his/her hands. The groups of sound stimuli were separated by pauses, with randomly set
         duration within the range of 5 to 8 seconds. In the automated experiment environment

                                                         2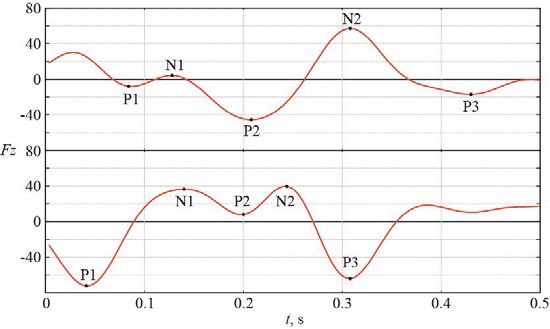
E3S Web of Conferences 273, 10051 (2021)                                 https://doi.org/10.1051/e3sconf/202127310051
INTERAGROMASH 2021

         protocols with the moments of presentation of each stimulus were compiled automatically
         and subsequently used to build the evoked potentials.
            Experimental studies were carried out in accordance with the ethical standards [18] and
         approved by the local committee of research ethics under the auspices of Saratov State
         University.

         2.2 Methods
         Evoked potentials have long had a good track record in the EEG data analysis tasks when
         assessing a subject's response to external visual or auditory stimuli [11]. This method of
         analysis is suitable for cases when multiple identical or similar stimuli are presented [4,10].
         Upon the completion of the experiment, averaging over the time series can be performed after
         stimulus presentation. In this case, it is important to determine the end of the stimulus
         accurately. If for a given channel the stimulus evokes a similar response in all stimulus
         presentations, then after averaging the signal amplitude increases, while the random
         component of the signal tends to zero. Thus, the evoked potentials are convenient for singling
         out the EEG features under certain types of stimulation, for example, as in the experiment
         that was conducted.
             It is important to point out that different stimuli elicit different evoked potentials. The
         differences in the evoked potentials involve different location of the potential components
         (its extrema) over the period of time. Thus, cognitive evoked potentials are released by the P
         (300) component - that is, clearly distinguished by the maximum N2 and minimum P3, which
         are typically located near the time mark of 300 ms. This position of the P (300) component
         is common for all people (within the framework of statistics). However, some individual
         peculiarities are also possible (especially against the background of impaired cognitive
         activity); they lead to a shift in the time intervals at which these components are observed.
             Within the experimental paradigm, we calculated the evoked potential of the subject from
         the point of completion of the last sound stimulus in the group. Figure 1 shows the evoked
         potentials calculated for a pair of subjects from groups A and B according to the EEG data
         from the Fz channel. Cognitive evoked potentials are often best identified along the central
         axis of the brain, rather than its hemispheres [15]. We can see that for the given subjects, the
         N1 and P2 components lie within close time intervals. In this case, the rest of the evoked
         potentials’ components are shifted along the time scale, including the P (300) component.
         Thus, we can clearly see strong changes in cognitive evoked potentials for these subjects.

         Fig. 1. Examples of built potentials for two subjects in the Fz channel with data for individual
         components presented as points. Above – the results for group A subject, below – the results for
         group B subject.

                                                           3
E3S Web of Conferences 273, 10051 (2021) https://doi.org/10.1051/e3sconf/202127310051
INTERAGROMASH 2021
3 Results
In this study we compared individual features of cognitive evoked potentials, which subjects
with normal and significantly impaired vision experience. We carried out analysis of the
spatio-temporal dynamics of evoked potentials across various registration channels and
statistical analysis of the similarity of time series according to the Wilcoxon test.
3.1 Analysis of temporal dynamics across the channels
It is convenient to draw up a chart of the subjects’ head map with evoked potential’s
amplitude marks for the channel with the fixed step size in time using the specialized
FieldTrip package (MathLab software environment). We used a step size of 50 msec to create
the head map for the time interval [50 , 450] msec. We chose the time interval and step size
based on the convenience of observing components of the cognitive evoked potential. Fig.2
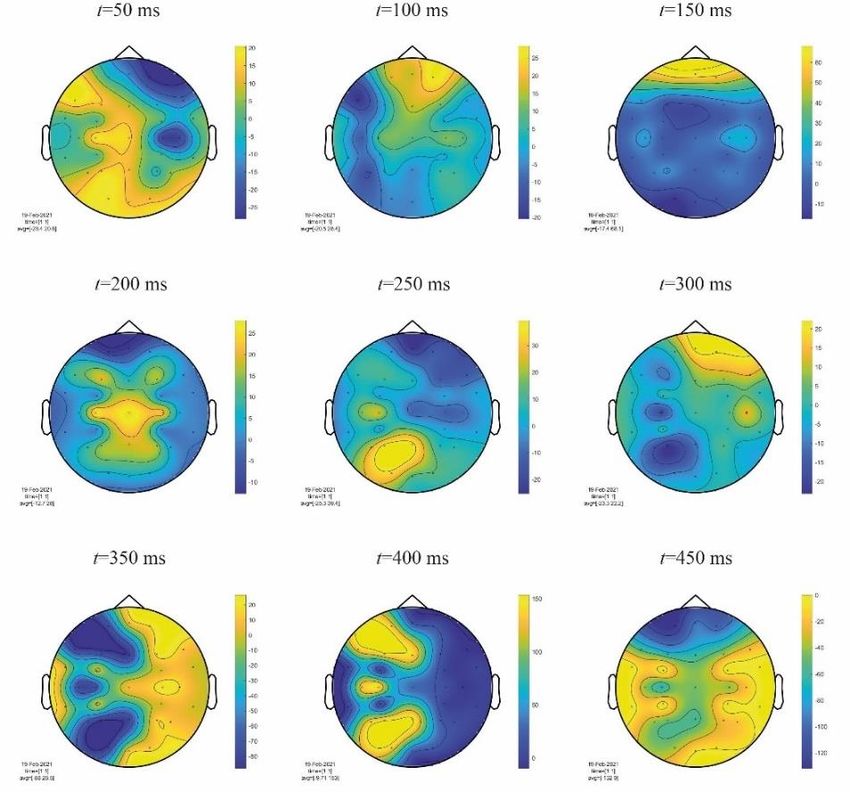
and Fig.3 show the results for the subjects from groups A and B, respectively. Calculation
results correspond to the upper evoked potential shown in Fig.2.
Fig. 2. Time slices of the evoked potentials plotted on the spatial chart of the subject’s head from
group A.
Fig. 2 shows the map of the subject’s head from group A, whose evoked potential is
shown in the channel Fz at the top of Fig. 1. First of all, it should be noted that for this subject
the main changes in the values of the evoked potential are observed in the right side of the
brain. Maximum deviations from zero are registered in this area except for the timepoints
t=350 msec and t=450 msec. Furthermore, the value of the evoked potential is close to zero
4E3S Web of Conferences 273, 10051 (2021) https://doi.org/10.1051/e3sconf/202127310051
INTERAGROMASH 2021
in the left side of the brain, except for the timepoint t=400 msec. We observed the maximum
values in the left side and the minimum values in the right side at that moment.
We can track the precise timepoints at which we observe the maximum or the minimum
value in the dynamics of the components of the cognitive evoked potential in the right side
of the brain. We observed the first significant minimum at the timepoint t=150 msec (it
corresponds to component Р1), further at the timepoint t=250 msec (component Р2), and
insignificant minimum at the timepoint t=400 msec (component Р3). The maximum values,
that correspond to components N1 and N2, are marked at the timepoints t=200 msec and
t=300 msec, respectively. The timepoints correspond to overall component latency for
cognitive evoked potentials [15, 16]. Therefore, having completed the analysis of the
temporal dynamics of a given subject, we came to the conclusion that components of the
evoked potentials for him/her corresponded well to the mean values but only for the right
side of the brain. Evoked potentials were very faintly expressed in the left side of the brain.
Fig. 3. Time slices of the evoked potentials plotted on the spatial chart of the subject from group B,
which correspond to the lower evoked potential shown in Fig. 1.
Moving on to group B we should point out that it is logical to observe the brain of the
subject from group B divided into the frontal lobe and the rest of the lobes. We observe
minimum values in the frontal lobe at the timepoints t=50 msec, t=200-250 msec and t=400-
450 msec. Another timepoints are characterized by the maximum value of the evoked
potential. The value of the evoked potentials for other parts of the brain acts in the opposite
way. Therefore, we can state that evoked potentials in the frontal lobe of the subject go ahead
or lag behind at 50-100 msec compared to the other sides. Consequently, it leads to the fact
that it is difficult to determine overall latency for a given subject and correlate it with the
average indicators for the adult subjects, respectively. It is curious that we can observe
5E3S Web of Conferences 273, 10051 (2021) https://doi.org/10.1051/e3sconf/202127310051
INTERAGROMASH 2021
separation of the values of the evoked potentials in the left and right parts of the brain for a
given subject at the timepoints t = 350 msec and t = 400 msec.
3.2 Statistical analysis
Having described some individual peculiarities of the subjects, based on the analysis of the
temporal dynamics of the evoked potentials, we would like to turn to statistical analysis. For
this purpose, we carried out statistical assessment of the evoked potentials in the two groups
of subjects across different channels using the Wilcoxon test to achieve the goal. Table 1
shows the analysis results.
Table 1. Validity of differences statement featuring the evoked potentials in subjects from groups A
and B tested across the channels according to the Wilcoxon test (pE3S Web of Conferences 273, 10051 (2021) https://doi.org/10.1051/e3sconf/202127310051
INTERAGROMASH 2021
problems of developing rehabilitation systems for patients with various disabilities. The
sequence of evoked potential analysis demonstrated in the article suits for adjusting the
settings of the “brain-computer” systems for a particular subject and allows to select channels
used in further BCI training efficiently.
Acknowledgement
This work was supported by Ministry of Science and Higher Education of the Russian
Federation in the framework of the state assignment (project No. FSRR-2020-0003).
References
1. S. Broyd, S. Debener, Neurosci Biobehav Rev. 33, 279296 (2009)
2. S. Baillet, R.M. Leahy, IEEE Signal Processing Magazine 18, 10535888 (2001)
3. M.F. Bear, B.W. Connors, M.A. Paradiso, Neuroscience Exploring the Brain (Woters
Kluwer, Netherlands, 2015)
4. N.R. Cooper, A.P. Burgess et al., NeuroReport 17, 205–208 (2006)
5. V.A. Maksimenko, A.E. Runnova et al., PloS one 13(9), e0197642 (2018)
6. A.N. Pisarchik, R. Jaimes-Reátegui, C.D.A. Magallón-García et al., Biological
Cybernetics 108(4), 397404 (2014)
7. A.E. Hramov, A.A. Koronovskii, V.A. Makarov et al., Wavelets in Neuroscience.
Springer Series in Synergetics (Springer, Heidelberg, New York, 2015)
8. S.D. Puthankattil, P.K. Joseph, R.U. Acharya, Journal of Medical Systems 34, 195212
(2010)
9. R. Acharya, N. Kannathal et al., Computer Methods and Programs in Biomedicine 80,
3745 (2005)
10. S.A. Hillyard, H. Hinrichs, C. Tempelmann et al., Hum. Brain Mapp. 5, 287–292 (1997)
11. S. Makeig, M. Westerfield, T.P. Jung et al., Science 295, 690–694 (2002)
12. J. Mast, J.D. Victor, Clin. Neurophysiol. 78, 389–401 (1993)
13. B. Schack, W. Klimesch, Neurosci. Lett. 331, 107–110 (2002)
14. L. Parra, C. Spence, A. Gerson, P. Sajda, IEEE Trans. on Neural Systems and
Rehabilitation Engineering 11(2), 173-7 (2003)
15. M.-W. Huang, F.H.-C. Chou, P.-Y. Lo, K.-S. Cheng, BMC Psychiatry 11, 74 (2011)
16. E.V. Levichkina, A.Ya. Kaplan, Human Physiology 35(2), 74 (2009)
17. V. Jurcak, D. Tsuzuki, I. Dan, Neuroimage 34(4), 27–32 (2007)
18. World medical association, The Journal of the American Medical Association 284(23),
30433045 (2000)
19. E.A. Luschekina, O.Y. Khaerdinova, V.S. Luschekin, V.B. Strelets, Human Physiology
43(3), 265-273 (2017)
20. A. Dickinson, C. Di Stefano, Y.Y. Lin et al, Behavioural brain research 348, 227-234
(2018)
21. Z. Gracia-Tabuenca, M.B. Moreno, F.A. Barrios, S. Alcauter, NeuroImage 174, 441-448
(2018)
7You can also read