A techno-economic and financial analysis of a GCC-India undersea electricity interconnector
←
→
Page content transcription
If your browser does not render page correctly, please read the page content below
The views expressed in this
                                                                      document are informal and do
                                                                       not necessarily reflect the UK
                                                                       government’s official policies.

A techno-economic and financial analysis of a GCC–India
undersea electricity interconnector
Abhishek Shivakumar1*, Lucas Kruitwagen2, Miles Weinstein1, Sebastian
Spiteri1, Christopher Arderne1, Youssef Almulla3, William Usher3, Mark
Howells4,5, and Adam Hawkes5

 Key Messages
 A techno-economic case for a Gulf
 Cooperation    Council  (GCC)–India
 interconnector is clear: an inter-
 connector is part of the least-cost
 ‘optimal’ power system in 64 of the
 75 scenarios studied.

 The financial case for the GCC–India
 interconnector is less clear. Of the
 projections developed for the sce-
 narios from the techno-economic
 model, only a small number are
 immediately investible.

 There is strong need to identify
 policy/market    conditions to   en-
 courage such 'system-optimal' invest-   Figure 1: Hourly power generation for India in 2050 – monthly
                                         average (Primary x-axis: Hours [0–24]; Secondary x-axis: Months;
 ments that are seen as risky from an
                                         Y-axis: Gigawatts [GW])
 investor's perspective.

Introduction
Many large economies have now announced net             between the six Gulf Cooperation Council (GCC)
zero target years. These include the UK [1], EU,        states, India, and South-East Asia. In the current
and China [2]. The IEA recently suggested that a        version of the model, the maximum capacity of
net zero target for the global energy system is         the interconnector is assumed to be 25 Gigawatts
now within reach [3]. The power sector will             and can be built between 2028 and 2050. In
therefore have to cope both with increasingly           addition, three potential sites for a solar PV farm
electrified energy systems as well as higher            that can be built together with the interconnector
shares of intermittent renewable generation cap-        are considered. The analysis is based on a
acity, such as wind and solar photovoltaics (PV),       techno-economic model that aims to minimize the
in the coming decades. One promising solution to        total costs of the GCC and India’s electricity
this challenge is cross-border electricity inter-       systems from the present until 2050. The model
connectors. By connecting geographically dis-           is subject to a set of constraints and policy
tributed renewable potentials to electricity            considerations such as India’s renewable energy
demands across borders, supply–demand mis-              deployment targets and the emission reduction
matches can be mitigated [4]. This briefing             goals set by GCC countries and India in their
summarizes a techno-economic and financial              Nationally Determined Contributions (NDC) in the
analysis of installing a new interconnector             Paris Agreement.

CCG 2021    03.08.2021 – Version 2.                                 www.ClimateCompatibleGrowth.com (#CCG)
                                                    1
ANALYSIS OF A GCC–INDIA UNDERSEA ELECTRICITY INTERCONNECTOR
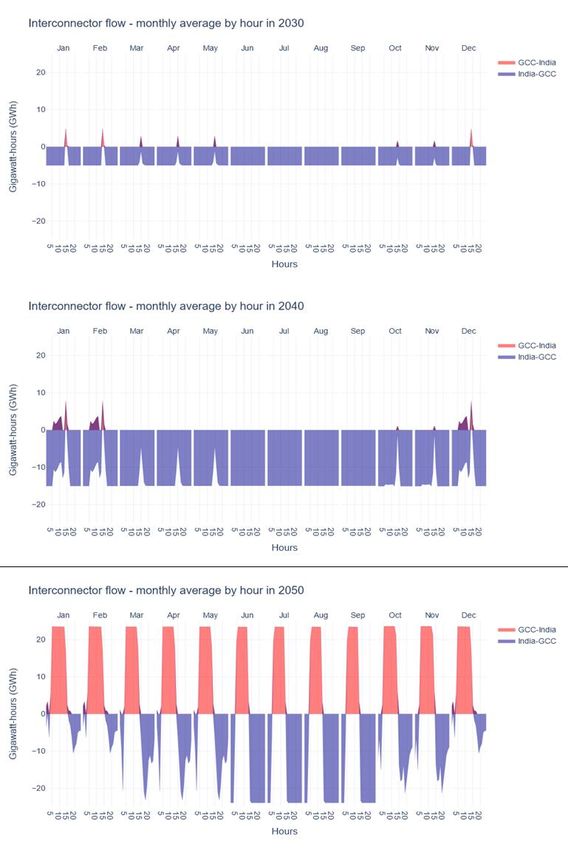
Cross-border electricity trade flows through the GCC–India interconnector
The results of hourly bi-directional electricity trade flows for the years 2030, 2040, and 2050 are shown in
Figure 2. The direction of trade flows is dominated by electricity from India to GCC in 2030. This pattern
remains consistent across all months and for most hours. The exceptions are between 14:00–16:00 UTC
(19:30–21:30 IST) in all months outside India’s monsoon season. The time period coincides with the
evening peak demand hours in India. During India’s monsoon season, the trade flow is entirely in the
direction towards the GCC. This coincides with the likely availability of surplus hydropower generation in
India.
Electricity flows through the GCC–
India interconnector in 2040 see a
continuation of the earlier pattern of
India->GCC dominating the direc-
tion of trade. However, in addition
to evening peak demand hours in
India, there is increased flow of
electricity from GCC->India during
the daytime peak demand hours of
07:00–11:00 UTC (or 12:30–16:30
IST). Maximum hourly electricity
flow in the GCC->India direction
increases to just under 10 GWh,
while in the India->GCC direction it
increases to 15 GWh.
By 2050 we see a reversal in the
dominant direction of flow; elec-
tricity trade in the GCC->India
direction now makes up a majority
of total electricity trade volume. As
India reaches its technical potential
for renewable capacity expansion,
electricity imports from the GCC–
India interconnector represent a
relatively low-cost alternative.
While the seasonal pattern of trade
flow from India->GCC remains, the
flow in the opposite direction is con-
sistently high throughout the year.
The flow now bridges the daytime
and evening peak hours, coinciding
with both as well as the hours in
between.
The model results highlight a
somewhat counterintuitive trend;
the magnitude of electricity flows is
greater in the India->GCC direction
than from GCC->India until 2050.
Figure 2: Hourly bi-directional trade volumes across the GCC–India
The trend of use shifts in the other interconnector in 2030, 2040, and 2050 (Primary x-axis: Hours [0-24];
direction in 2050. This is likely due Secondary x-axis: Months; Y-axis: Gigawatt-Hours [GWh])
to the significant increase in elec-
tricity demand expected in India
over the coming decades.
CCG 2021 03.08.2021 – Version 1. www.ClimateCompatibleGrowth.com (#CCG)
2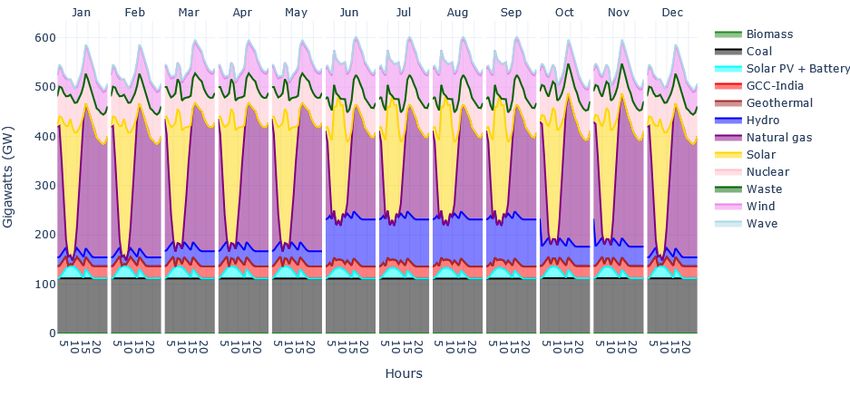
ANALYSIS OF A GCC–INDIA UNDERSEA ELECTRICITY INTERCONNECTOR

Financial feasibility
In order to be aligned with the
techno-economic model, the
interconnector revenue is cal-
culated using a time-of-use
tariff based on the difference in
marginal costs between the
connection nodes on either side
of the interconnector. This
means that as the inter-
connector grows in capacity,
this marginal difference be-
comes smaller and the inter-
connector’s revenue stream
becomes smaller. It is expected
that the opportunity for arbi-
trage — taking advantage of a
price difference between two or
more markets – would be
greater if the interconnector
were to be constrained in size,
thereby improving its case for
investment.
Two types of discount rates are
                                             Figure 3: Project net present value dependence on scenario parameters
considered in this analysis:
social discount rate and project           tration of renewables is higher,       the interconnector itself is cur-
discount rate. The former re-              which increases the arbitrage          rently not capturing these ben-
lates to how future benefits               opportunities across the inter-        efits. In almost all scenarios,
weigh up against the costs of              connector.                             the returns on investment
action today. It considers costs                                                  (shown as ‘Project mIRR’ and
and benefits on a society-wide             As the techno-economic model
                                                                                  ‘Equity mIRR’ in Figure 4) are
(or system-wide in this case)              seeks to minimize total system
                                                                                  positive. If more of the benefit
basis. Project discount rate, on           costs, it will not necessarily
                                                                                  provided by the interconnector
the other hand, relates to costs           choose capacities which allow
                                                                                  would be accrued by the inter-
and benefits from the perspec-             for maximum profitability of the
                                                                                  connector itself (i.e., if its rev-
tive of an investor in a specific          interconnector. As shown, in
                                                                                  enue were increased) or if it
project. In this analysis, a               almost all scenarios, the maxi-
                                                                                  were able to secure conces-
range of project discount rates            mum size available is chosen
                                                                                  sional and government financ-
for the interconnector are con-            for the interconnector. This
                                                                                  ing and grants which lowered
sidered alongside a range of               suggests that the presence of
                                                                                  its costs of capital sufficiently,
social discount rates.                     the interconnector substantially
                                                                                  then the interconnector would
                                           reduces total system costs, but
The net-present-value (NPV) —                                                     be investible as-is.
                                           the negative NPV shows that
a measure of the present value
of a series of future cash flows
— of the proposed inter-
connector project is shown in
Figure 3. For almost all sce-
narios, the project NPV is
negative. The strongest rela-
tionship is between NPV and
interconnector (IC) unit cost.
NPV decreases with increase in
interconnector unit costs. The
social discount rate also shows
some relationships with the
NPV of the interconnector. This
could be because, at lower
social discount rates, the pene-
                                                Figure 4: Relationship between Project and Equity mIRR and NPV

CCG 2021      03.08.2021 – Version 1.                                      www.ClimateCompatibleGrowth.com (#CCG)
                                                              3
ANALYSIS OF A GCC–INDIA UNDERSEA ELECTRICITY INTERCONNECTOR

Conclusions and recommendations
This study provides an initial analysis of the GCC–India interconnector. The techno-economic case for
a GCC–India interconnector is clear: an interconnector is part of the least-cost ‘optimal’ power
system in 64 of the 75 scenarios studied. Bi-directional trade between the two regions can contribute
towards reducing costs and emissions across a range of scenarios. The overall trade volumes are influ-
enced by the location of the solar PV farm; locations further to the west contribute towards higher trade
volumes in the GCC->India direction. Finally, the role of storage was found to complement rather than
substitute the GCC–India interconnector, with both combining towards meeting India’s peak load, as
shown in Figure 1.
The financial case for the GCC–India interconnector is less clear. Of the projections developed
for the scenarios from the techno-economic model, only a small number are immediately
investible. However, the non-investible scenarios show a shortfall in investment attractiveness con-
sistent with the difference between the techno-economic models and financial models.
Further expanding the geographic scope could help improve the overall feasibility of the GCC–India inter-
connector. For instance, the GCC is well-positioned to act as an electricity trading hub between South-
east Asia, India, and the African power pools (regional power grids and electricity markets). Another
avenue for further exploration is to identify policy/market conditions to encourage such 'system-
optimal' investments that are risky from an investor's perspective. For example, a price cap and
floor arrangements underpinning such projects would help reduce the investment risks (and therefore the
cost of capital). This finding highlights the role of concessional and government financing, which could
improve the financial case for projects with a clear system-wide benefits.

References
[1] The Government of the United Kingdom, “Energy white paper: Powering our net zero future,” GOV.UK,
    2020. https://www.gov.uk/government/publications/energy-white-paper-powering-our-net-zero-
    future/energy-white-paper-powering-our-net-zero-future-accessible-html-version (accessed Apr. 07,
    2021).
[2] L. Varro and A. Fengquan, “China’s net-zero ambitions: the next Five-Year Plan will be critical for an
    accelerated energy transition – Analysis,” IEA, 2020. https://www.iea.org/commentaries/china-s-net-zero-
    ambitions-the-next-five-year-plan-will-be-critical-for-an-accelerated-energy-transition (accessed Apr. 07,
    2021).
[3] Fatih Birol, “Net zero by 2050 plan for energy sector is coming – Analysis,” IEA, 2021.
    https://www.iea.org/commentaries/net-zero-by-2050-plan-for-energy-sector-is-coming (accessed Apr. 07,
    2021).
[4] M. Brinkerink, B. Ó. Gallachóir, and P. Deane, “A comprehensive review on the benefits and challenges of
    global power grids and intercontinental interconnectors,” Renew. Sustain. Energy Rev., vol. 107, pp. 274–
    287, Jun. 2019, doi: 10.1016/j.rser.2019.03.003.

Notes                                                             Author Information
Climate Compatible Growth (CCG) programme:
CCG is funded by the UK’s Foreign Development and                 Affiliations
Commonwealth Office (FCDO) to support investment in
                                                                  1
                                                                    Climate Compatible Growth
                                                                  2
                                                                    Oxford University
sustainable energy and transport systems to meet
                                                                  3
                                                                    KTH Royal Institute of Technology
development priorities in the Global South.                       4
                                                                    Loughborough University
                                                                  5
                                                                    Imperial College London

                                                                  *Corresponding author
                                                                  Email: abhishek0208@gmail.com

CCG 2021      03.08.2021 – Version 1.                                          www.ClimateCompatibleGrowth.com (#CCG)
                                                              4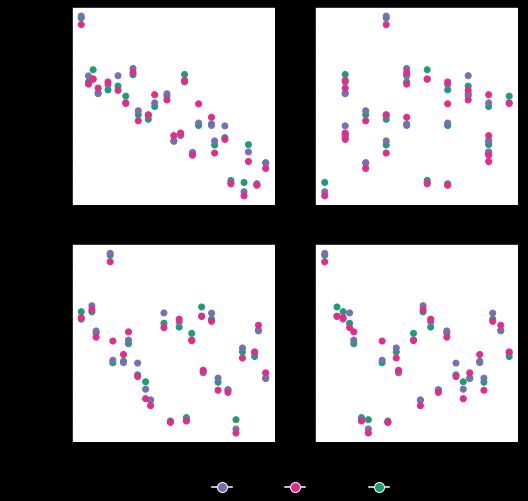
You can also read