How to Leverage Portable XRF for Exploration & Grade Control 2019 - Chris Calam - European Sales Manager Stand A13
←
→
Page content transcription
If your browser does not render page correctly, please read the page content below
How to Leverage Portable XRF for
Exploration & Grade Control - 2019
Chris Calam – European Sales Manager
Stand A13

                                       The world leader in serving science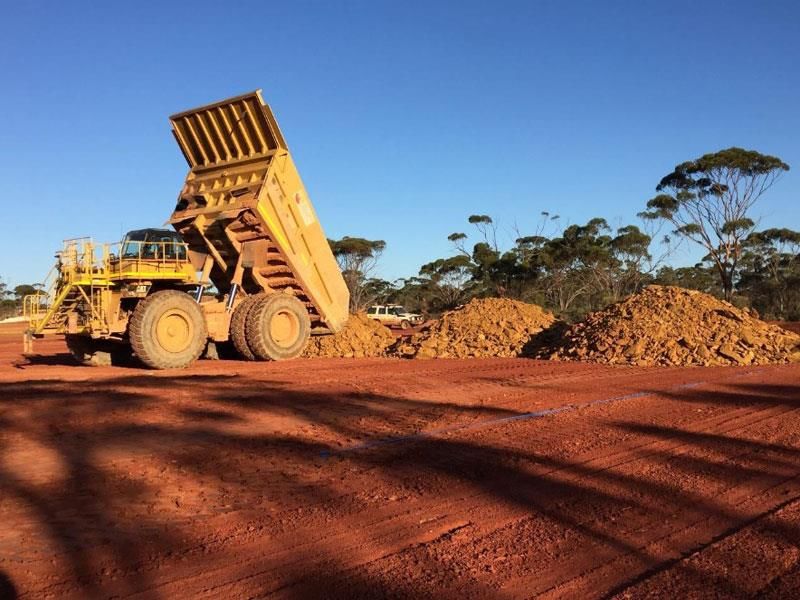
70,000            5,000                    $1B             $23B
     employees   R&D Scientists/Engineers    invested in R&D   in revenues

                      The world leader in serving science

2
Handheld XRF – Used in Multiple Mining Applications

    • Soils             • Drilling cores   • Grade control
    • Outcrop           • Mud logging      • Process control

    Exploration:        Exploration:       Mining
    Early Stage         Late Stage         Operations

    • Base metals       • Coal             • Limestone
    • Precious metals   • Oil              • Phosphates
    • Li, Uranium,      • Gas              • Potash
      rare earth

    Hard Rocks          Mineral            Industrial
                        Fuels              minerals

3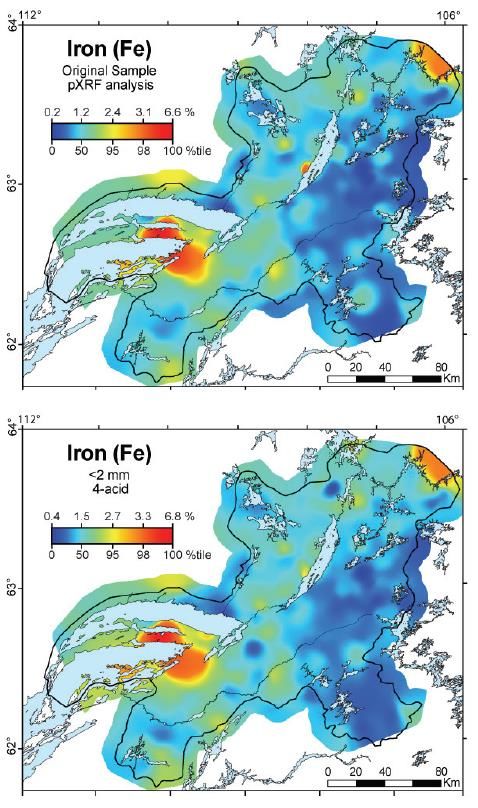
Mining Applications
Niton XL5 Niton XL3t Niton XL3t Niton Niton XL2 Niton XL2
Ultra GOLDD+ XL3t Plus
Base & precious
metal exploration
Ore trading
Base metals–
grade control
Uranium ore
Oil and Gas
exploration
Penalty elements
Industrial
minerals
Soils - traces
4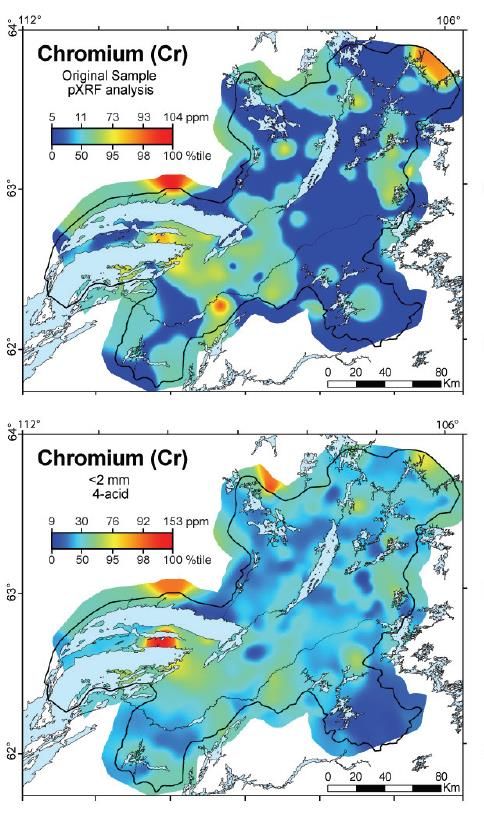
Set-up and working principle of Niton handheld x-ray fluorescence spectrometry

Simplified description
• X-ray radiation from the analyzer strikes the surface of
  the sample.
• The energy of the x-ray is transferred to the sample
  (Photoelectric absorption)
• The atom contained in the sample emit a characteristic
  x-ray fluorescence.
• The emitted x-ray photons produce an electric signal in
  the detector which is transmitted to the pre-amplifier
  (pre-amp)
• The electric signal is amplified in the pre-amp and
  transmitted to the digital signal processor (DSP)
• The DSP digitizes and sums the signals. The resulting
  spectrum is processed in the central processor unit
  (CPU) and treated to obtain the elemental analysis.
• The results of analysis are displayed in the screen and
  stored in the internal memory

5
Mineral Exploration – Where do we look and how do we find it?

    • Geologists look for clues
    • Costs millions of dollars to
      evaluate a property
    • Data converted to
                                      Early Stage
                                                    Drilling
      information helps form a        Exploration
      clearer picture of a deposits
      true economic value

                                        3D models   Discovery

6
What does Portable XRF have to offer in Exploration

    • Soil survey and outcrop evaluation to map                     Early Stage
      anomalies                                                     Exploration
    • Target additional sampling in anomalous
      areas to identify drill targets
    • Provide a geochemical data stream to the
      geologist
     • Improves confidence in daily decision making
    • Speed up exploration efficiency, saving time
      and money
     • Compliments lab analysis                                                    Drilling
       •   Pre-screen sample selection for lab analysis
       •   Maximising analytical budgets
       •   Reduce external assay & freight costs
       •   Eliminate delays associated with analytical turnaround   3D models
           time                                                                   Discovery

7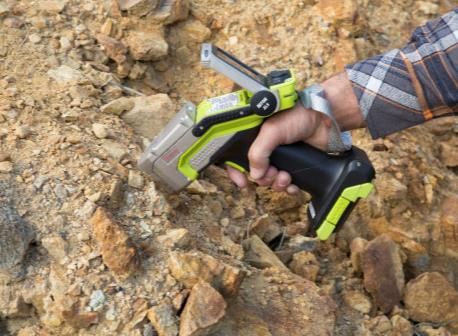
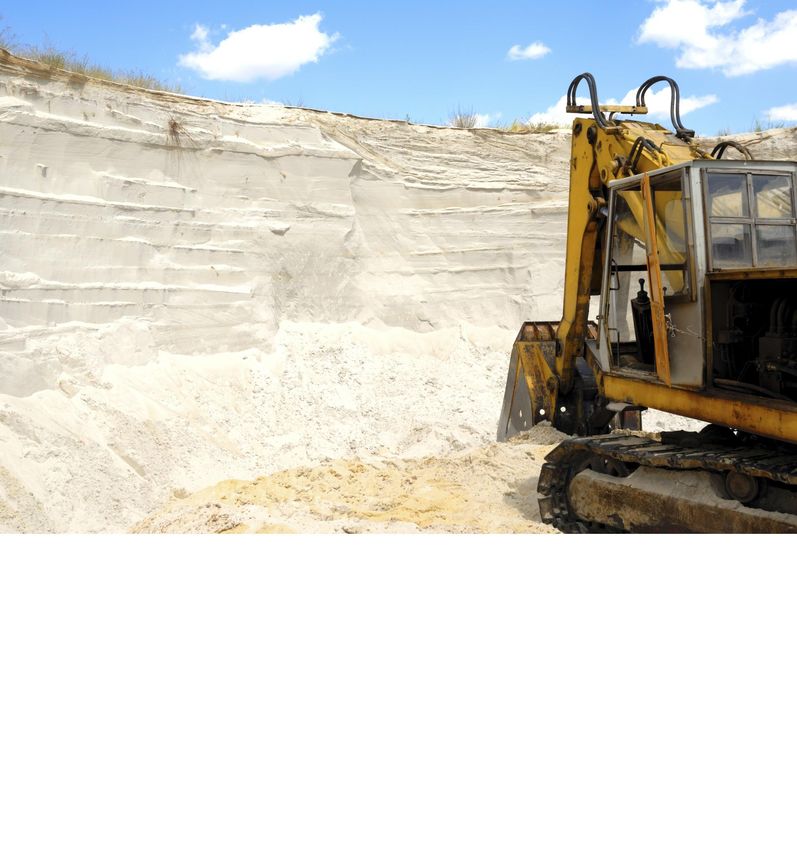
Exploration – Drilling

    • Scan along or spot test large and well disseminated
      core for instant results
     • RAB/RC samples                                                  Early Stage
    • For poorly disseminated core (e.g. vein-like or spotty           Exploration      Drilling
      core) use the average function to generate composite
      values
    • pXRF data ensures drilling is not halted above the
      base of the anomaly
      • Relocate to next drill hole if mineralization is tailing off
    • Pre-screen core to prevent sending barren core to the
      lab
    • Identify and measure valuable elements not expected
      to be on the property.

                                                                          3D models   Discovery

8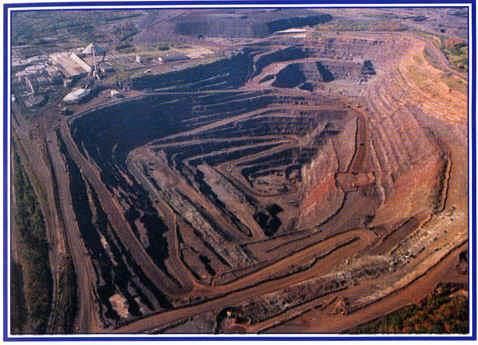
Discovery

                                                           Early Stage
    • You’ve found something                               Exploration      Drilling
    • Commence step-out drilling
      • How far and deep does your mineralisation extend
    • Infill drilling
      • Confirm the presence of mineralisation between                     Discovery
        step-out drill holes
    • Cores split vertically
      • Half stored and analysed by pXRF
      • Half sent to the lab for assay
        • Assays to confirm pXRF data and grades
        • Economic extraction?
    • Generate 3D models of the ore deposit
                                                               3D models
    • Environmental assessments

9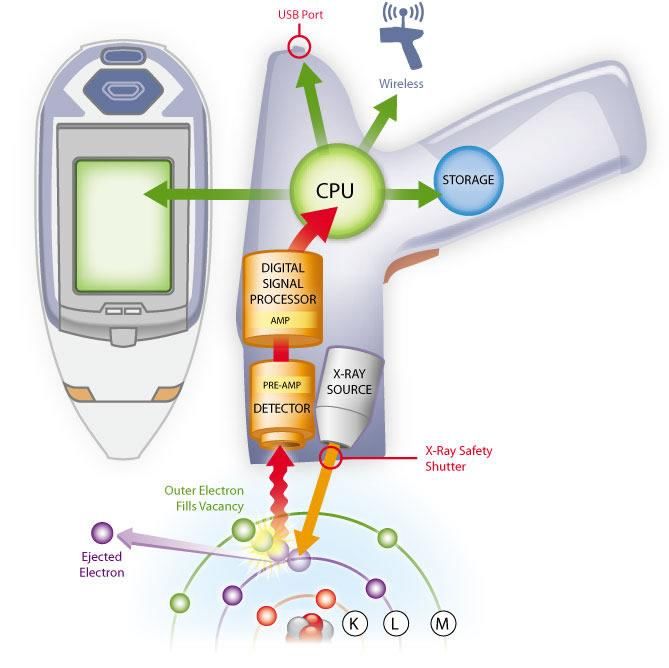
What does Portable XRF have to offer in Grade Control?

 • Improved mine efficiency through optimised extraction and processing
     • Better ore boundary definition
       • Instantly flag grade, sub-grade and waste
       • Prevent grade dilution
       • Improved stockpile management
     • Analyse blast hole cuttings
       • Follow the mineralised veins
     • Drive efficient excavation decisions
     • Matrix specific calibrations
     • Confirm presence of penalty and credit
       elements
     • Optimise feed to the mill

 • Environmental Management
     • Waste effluent monitoring
     • Mine decommissioning
       • Tailings, mineral waste
       • Soil remediation

10
Cu Performance on Blast Holes
30
y = 0.9319x + 0.325
25
R2 = 0.9686
% Cu NITON XRF
20
15
10
5
0
0 5 10 15 20 25 30
% Cu ALS
11Grade Control - Underground
“The Niton will not replace laboratory results, it merely takes
the pressure off an over-worked on-site lab and enables
geology staff to interact with other departments armed with
up to date information”
Regression Analysis Of Niton y = 0.9951x - 0.009
Cu R2 = 0.7698
4.5
4
3.5
3
2.5
Lab(%)
Series1
Linear (Series1)
2
1.5
1
0.5
0
0 0.5 1 1.5 2 2.5 3 3.5 4
Niton(%)
12What’s Important in an Analyser? Precision Sensitivity Speed Cost 13
What’s Important in an Analyser?

 • Performance - Precision & Sensitivity
     • Accuracy & precision of results
     • Can we detect penalty elements
 • Productivity – Speed
     • How many test can be done in a day
     • How quickly can penalty elements be quantified
 • Reliability – how rugged is the analyzer
     • Does it operate at extremes of temperature
     • Moisture resistant
 • Ease of Use – how easy / ergonomic
     • Simple download & conversion of data for GIS programs
 • Changes the way we work
       • State of the art, modern design
       • Supports evolving needs of users
 • Generate strong ROI

14
XL5 Power – 5W tube, Automatic Current Adjustment
More Actual Power Where it Matters!
Improvements of light element LODs
1516
Limits of detection in ppm
1000
100
1
10
10000
Mg
Al
P
S
Cl
K
Ca
Ti
V
Cr
LODs in ppm - pure silica
Mn
Fe
Co
Ni
Cu
Zn
As
Elements
Se
Rb
Sr
Zr
Nb
XL3t GOLDD+
Mo
Pd
Ag
XL5
Cd
Sn
Sb
Ba
Au
Pb
BiSetting Up Your Analyser
• What do you want to achieve?
• Define your objectives
• Exploration - map anomalies, may be no sample preparation
• Mining company – sample preparation, optimise calibration
• Underground face mapping – differentiate waste, low grade and high grade
• Refiner – optimised calibration to achieve lab quality data
• What samples will you analyse
• Direct on soil or outcrops
• Diamond core or rock chips
• Degree of sample preparation depends upon desired outcome
• Grinding
• Moisture control – dilutes sample
• Light elements important – define sample preparation
• Sample presentation
• XRF sample cups, bags, pressed pellet, or direct on the sample
• All have implications for time, cost & accuracy
17Setting Up Your Analyser
• Create internal SOP
• Ensure it is implemented
• Fine tune factory calibration using local reference standards
• Optimise analysis times
• Understand their impact on precision
• Sample preparation – what, if any?
• Field, lab or both
• QA/QC running blanks and CRM’s to ensure good data quality
• Decision criteria for sending samples for assay
• Understand lab digestion method
• Aqua regia, 4 acid digestion or fusion
• Full extraction or partial extraction
• Compare pXRF data with lab data,
• Adjust SOP if required
18Setting Up Your Analyser
• Ensure data generated is of the highest possible quality
• Fit for purpose
• Confidence in your data
• Plan for success before you start
19Sources of Difference between XRF and ICP/AA
• Heterogeneity of sample
• Sample preparation
• Incomplete digestion prior to ICP/AA
• Leading to incorrect interpretation of results
XRF ICP/AA
SAMPLE SAMPLE
PREPARATION NOT PREPARATION
MANDATORY MANDATORY
ANALYSIS ANALYSIS
RESULT RESULT
20XRF and acid extraction according to EPA3050 B
Certificate NIST SRM 2710A: total concentration vs. extraction in ppm.
Recovery
Element Certified # Lab for Range Average Recovery vs.
Total extraction extraction extraction total
Al 59500 ± 500 6 8200-12000 10000 17%
Sb 52 ± 1.6 6 5-12 9.6 18%
As 1540 ± 100 6 1300-1600 1400 92%
Ba 792 ± 36 6 490-540 510 65%
Cd 12.3 ± 0.3 5 9.6-12 11 86%
Ca 9640 ± 450 6 1700-2000 1800 19%
Cu 3420 ± 50 6 3100-3500 3300 95%
Co 5.99 ± 0.14 6 2.8-5.2 3.8 64%
Fe 43200 ± 800 6 30000-36000 34000 79%
Pb 5520 ± 30 6 4700-5800 5100 93%
Hg 9.88 ± 0.21 6 9.3-11.7 10 104%
Mn 2140 ± 60 6 1500-1800 1700 77%
K 21700 ±1300 6 3800-4700 411 19%
Zn 4180 ± 150 6 3300-4400 3800 90%
21Field Sample Preparation Tools
Blade Grinder Rotary Sampler
Pelletizer
Consumables
22Benefits of Sample Preparation Zn/Pb/Ag
• Less deviation due to inhomogeneity
Relative standard deviation (%)
120
Point and Shoot (10x)
100
Angle Grinder collection (5x)
80
RSD (%)
60
40
20
0
Pb Zn Fe
23Analysis Time – soil pulp, 10, 30, 60 second / filter
10
30
60
24Analysis Time – soil pulp, 10, 30, 60 second / filter
• Fe requires slope correction
10
30
60
25Analysis Time and Precision 26
Factory Calibration Fine Tuning

     • Plot measured vs reference values
              Si                                     Fe

                                           Fine tuning not required
                                           For Fe

27
When Setup Correctly - GIS Maps 28
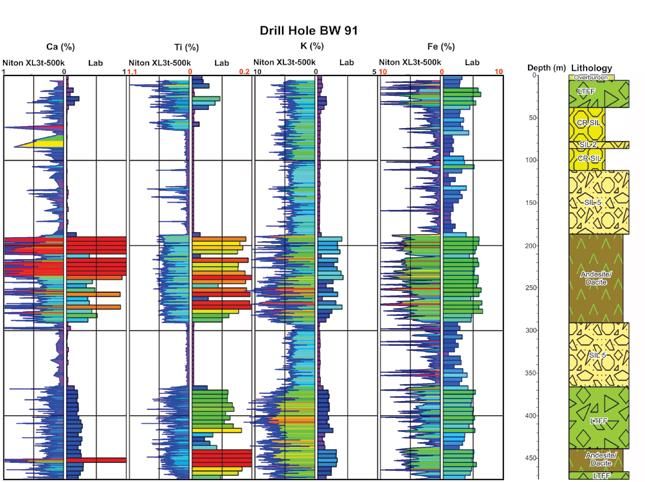
Strip Logs – drill Core Niton vs Lab

29
Niton XL5: Enabled for Smart & Connected

30
Summary

 • Niton XL5
 • Delivering accuracy and speed
 • Changing the way we work
 • Suitable for hard rock, mineral fuels
   and industrial minerals

         Niton XL5
 • Extending the capability of exploration

33
You can also read