A Twitter-Based Economic Policy Uncertainty Index: Expert Opinion and Financial Market Dynamics in an Emerging Market Economy - Frontiers
←
→
Page content transcription
If your browser does not render page correctly, please read the page content below
ORIGINAL RESEARCH
                                                                                                                                                 published: 30 May 2022
                                                                                                                                         doi: 10.3389/fphy.2022.864207

                                             A Twitter-Based Economic Policy
                                             Uncertainty Index: Expert Opinion and
                                             Financial Market Dynamics in an
                                             Emerging Market Economy
                                             Sevcan Yeşiltaş 1, Anıl Şen 1, Beyza Arslan 1 and Sumru Altuğ 2,3*
                                             1
                                               College of Administrative Sciences and Economics, Koç University, Istanbul, Turkey, 2Department of Economics, American
                                             University of Beirut, Beirut, Lebanon, 3Centre for Economic Policy Research, London, United Kingdom

                                             In this paper, we construct a Twitter-based high-frequency Economic Policy Uncertainty
                                             (TEPU) index built on a select set of Twitter user accounts whose tweets are considered to
                                             reflect expert opinion on the topic. We study the relationship between the TEPU index and
                                             a set of key financial indicators for tracking financial developments in Turkey over the
                                             sample period 2013–2021. Based on the results from a vector autoregressive analysis, we
                                             find evidence that changes in expert opinion described by fluctuations in the TEPU index
                                             interact with fluctuations in financial indicators such as the exchange rate and the stock
                           Edited by:        market index to capture information about high frequency events during our sample
                       Federico Rossi,
              University of Siena, Italy
                                             period. Second, fluctuations in the TEPU index emerge as a key indicator that helps to
                       Reviewed by:
                                             predict the country risk premium measured by the CDS spread. We also find evidence that
                       Lee A. Smales,        the conditional volatility of the different series reflects salient events that occurred over our
       University of Western Australia,
                                             sample period.
                              Australia
                        Marcin Wolski,
                                             Keywords: Twitter-based data, economic policy uncertainty, monetary policy, financial markets, Turkey
          European Investment Bank,
                         Luxembourg
                  *Correspondence:
                        Sumru Altuğ
                                             1 INTRODUCTION
                   sa287@aub.edu.lb
                                             On 20 December 2021, the exchange rate hit a record low at 18.36 Turkish Lira (TRY) against the US
                    Specialty section:
                                             Dollar (USD) after falling from a value of 8.29 TRY against the USD on September 2021. It
         This article was submitted to       rebounded back to a value of 10.78 TRY per USD by 23 December 2021 following the announcement
                        Social Physics,      of two foreign-currency indexed saving schemes that link the interest rate received on Turkish lira
               a section of the journal      deposits to fluctuations in the exchange rate.1 The factors instigating this fall were the removal of two
                    Frontiers in Physics     deputy governors and one member of the Monetary Policy Committee (MPC) at the Central Bank of
        Received: 01 February 2022           the Republic of Turkey (CBRT) and subsequent cuts in the policy rate of 500 basis points beginning
           Accepted: 22 April 2022           with the MPC meeting on 23 September 2021. These developments were accompanied by large
           Published: 30 May 2022            increases in Turkey’s CDS spreads on its sovereign bonds as well as significant volatility in its stock
                              Citation:      market.2
Yeşiltaş S, Şen A, Arslan B and Altuğ S         In this paper, we construct a daily-frequency Twitter-based Economic Policy Uncertainty (TEPU)
    (2022) A Twitter-Based Economic          index that aims to track such high frequency developments in Turkey’s economic and political
       Policy Uncertainty Index: Expert
                                             arena—spanning even a few hours in a given day that cannot be captured through the standard
          Opinion and Financial Market
              Dynamics in an Emerging
                      Market Economy.
                                             1
               Front. Phys. 10:864207.           https://www.ft.com/content/f6c3f33f-356c-47b8-8156-5fe07ffe6237?shareType=nongift.
                                             2
       doi: 10.3389/fphy.2022.864207             http://www.aljazeera.com/economy/2021/12/17/turkey-stock-trading-halted-twice-as-lira-crashes-to-new-low.

Frontiers in Physics | www.frontiersin.org                                            1                                          May 2022 | Volume 10 | Article 864207
Yeşiltaş et al. Twitter-Based Economic Policy Uncertainty Index
newspaper–based economic policy uncertainty (EPU) indices [1].
To the best of our knowledge, our paper is the first to test the
ability of an EPU index for capturing and conveying information
about developments in a highly volatile policy environment for a
leading emerging market economy, Turkey.
Earlier [2] constructs an EPU index for Turkey using the Dow
Jones’ Factiva global news database over the period 1996–2017
and examine the relationship between their EPU index and
sectoral data on investment and employment. They argue that
their use of mainly foreign newspapers rather than Turkish
newspapers as the primary source for this index may be a
preferable approach, as foreign newspapers directly capture
international perceptions on Turkey’s EPU index and foreign
news sources span longer periods than Turkish newspapers. [3]
and [4] also create EPU indices for Turkey based on the digital
archives of several daily Turkish newspapers but none of these
analyses go beyond 2018. By contrast, the usage of Twitter data in
our analysis facilitates the creation of an EPU index at monthly,
weekly and even daily frequencies. The timely character of
Twitter data enables us to update our forward-looking TEPU
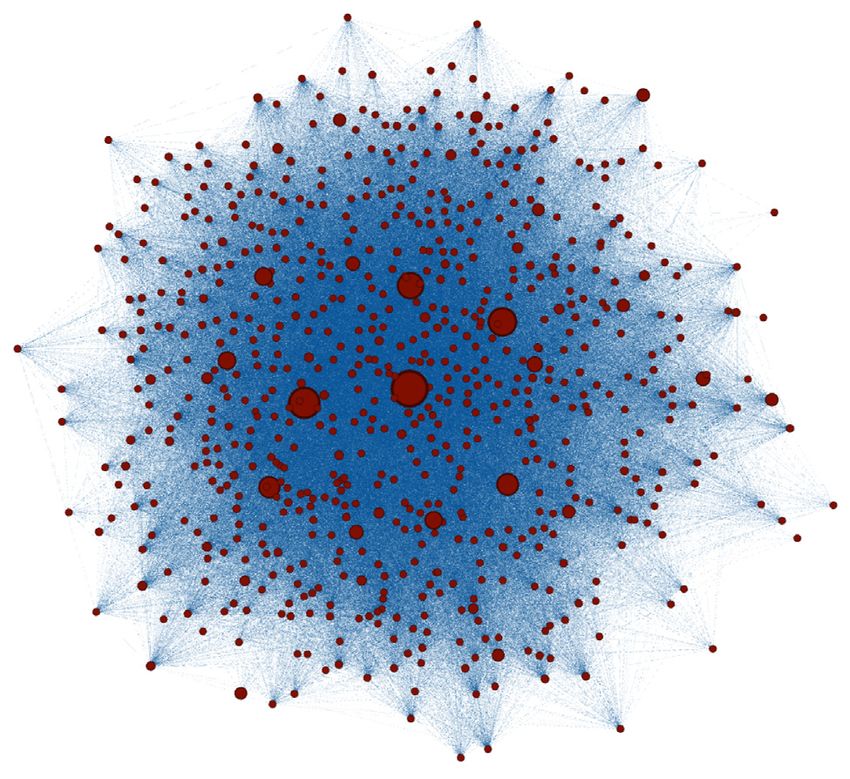
index in real time. This way, our TEPU index captures the effects FIGURE 1 | Network of selected Twitter users. Nodes indicate the
of the Covid-19 shock of 2020 as well as the fast-moving selected user accounts in Twitter. The size of the nodes reflects the number of
anomalous developments that occurred in Turkish financial their followers.
markets during 2021.
From a practical point of view, there are many reasons to make
use of Twitter data as an alternative to those extracted from extract recent tweets posted by these selected accounts easily and
conventional media platforms. In the past decade, the Twitter use them to update our TEPU index for capturing the extremely
platform has provided a direct, instantaneous, and network- fast daily developments in the Turkish economy in a timely
enhanced channel through which economic policy experts manner.3 To avoid any bias in TEPU index that might potentially
communicate with the public. Economic policy experts can occur due to the selection of user accounts within our user list
now freely convey their “real-time” opinions on economic and curation process, we run the bootstrapping algorithm repetitively
finance matters to a large social network. As Twitter feeds capture with different seed lists, which results in the same final candidate
a diversity of opinion in a nearly instantaneous fashion that is list in all repetitions. Furthermore, our bootstrapping algorithm
typically filtered in newspaper articles and reported with a enables us to prevent errors arising from the Turkish language
considerable time lag, our TEPU index enables us to account applications of Natural Language Processing (NLP) methods as
for a variety of different views transmitted within this network in well as to present a novel approach to the subject of content-based
our analysis. EPU indexing.
Recent studies in the relevant literature have examined data By implementing the different phases of our bootstrapping
sets derived from popular social media platforms such as Twitter, algorithm, we obtain a group of selected Twitter users that have
Facebook, blogs etc. [5] use the Twitter Application expertise in economics and finance. The final candidate list of 661
Programming Interface (API) to extract all tweets containing users is comprised of academics, company executives, politicians,
the words “uncertain,” “uncertainly,” “uncertainties” consultants, journalists, portfolio managers, and 218 bureaucrats.
“uncertainty.” and generate an EPU index. They use geotagged Figure 1 depicts the connections in the network of this selected
tweets and information about users’ followers to construct their group. These connections illustrate the following-follower status
index based on tweets sent by users located in the US. Utilizing of the selected user accounts and the size of the nodes shows their
the Twitter accounts of 15 Chilean mass media specialized in or relative influence. This figure suggests that there is a very strong
with material devoted to economics, [6] constitute a daily- interaction among the Twitter users in this group in that they are
frequency EPU index for Chile based on Twitter data. Their influenced by each other through their interactions and
constructed indices seek to capture the level of general moreover, influence the public through their high number of
disagreement about economic policies and the current followers. Hence, it is reasonable to think of this group as a viable
economic situation, respectively, over the period 2012–2019 in network of Twitter user accounts by which we can capture the
Chile. role of expert opinion in identifying economic policy uncertainty
Our paper differs from these existing studies that are typically
based on the use of bulk Twitter data and that potentially suffer
from noisy observations. In contrast to these analyses, we use a 3
In contrast to the Twitter API which has rate limits (see https://developer.twitter.
user list curation process to restrict our analysis to a select group com/en/docs/twitter-api/rate-limitslink), the web scraping method that we use is
of Twitter users. Using web scraping methods, we are able to faster in the extraction of data.
Frontiers in Physics | www.frontiersin.org 2 May 2022 | Volume 10 | Article 864207Yeşiltaş et al. Twitter-Based Economic Policy Uncertainty Index
in Turkey. Our approach involves building an EPU index based The remainder of this paper is organized as follows. Section 2
on the real-time interactions of this network, which allows for a provides a literature review. Section 3 explains in detail how we
fast-moving way of capturing expert opinion in such a volatile construct the Twitter-based economic policy uncertainty index
environment. for Turkey. Section 4 firstly provides details regarding data used
Turkey offers the case of an emerging market economy where in our econometric analysis and secondly conducts an event
market signals regarding monetary policy have become blurred analysis to show how our TEPU index relates to important
by the pursuit of unconventional monetary policy as well as policy political and economic events over the sample period
reversals, especially since 2020. In our analysis, we seek to 2013–2021. It also tracks developments in Turkish financial
understand the interaction between our measure of expert markets during this period. Section 5 is devoted to the details
opinion summarized by the TEPU index and salient financial of econometric methodology used in the analysis and explains the
indicators for tracking the changes in financial markets that have results. Section 6 concludes.
been occurring in Turkey over the sample period. For this
purpose, we derive our results from a Structural Vector
Autoregressive (SVAR) analysis model that allows for dynamic 2 LITERATURE REVIEW
inter-relationships in the conditional mean of the different series.
We also use a Multivariate Generalized Autoregressive The question of how households, businesses and policy makers
Conditional Heteroscadasticity (M-GARCH) model for shape their economic activities as a response to any changes in
understanding the volatility dynamics in the financial series uncertainty has been widely asked in the literature.4
[7]. By conducting a weekly frequency-based analysis, we A theoretical strand of the related literature aims to identify the
investigate the full sample that covers the period 2013–2021 as channels through which uncertainty can have an impact on
well as several sub-samples to understand the effects of monetary economic outcomes. First, a rise in uncertainty encourages
policy changes and unconventional monetary policy being households and businesses to delay their costly-to-reverse
conducted during this period. expenditures. During the times of high uncertainty households
Our results show that fluctuations in the TEPU index and are more likely to delay their purchases on durable goods [12].
financial indicators such as the BIST-100 index and the USD/ When the costs of irreversible investments and hiring decisions are
TRY exchange rate interact to capture information about political high, firms facing high uncertainty tend to adjust and delay the
and economic developments that occur during the sample period timing of such actions [13]. [14] and [15] show that heightened
2013–2021. In particular, the TEPU index and the USD/TRY uncertainty affects investment behavior by creating an option
exchange rate are two key indicators which reflect monetary value of waiting. In uncertain times, firms prefer to delay capital
policy surprises and monetary policy announcements arising expenditures involving sunk costs until more information is revealed.
from the pursuit of unconventional monetary policy in recent Second, uncertainty can also have real option effects on
years in Turkey. The TEPU index also emerges as a key predictor employment. [16] suggests that when search frictions are the
of changes in the CDS spread, suggesting that expert opinion itself only costs associated with the reallocation of labor, real option
contains information useful for evaluating the country’s risk effects of uncertainty are weak if firms can easily reverse their
premium [8]. The fluctuations in the TEPU index together employment decisions. A rise in uncertainty can also encourage
with the USD/TRY exchange rate and the CDS spread also firms to adjust on flexible margins such as part-time employment
help predict fluctuations in equity markets in Turkey. A novel due to the existence of fixed costs of hiring and firing [17]. Third,
part of our analysis is that we document how increases in the it is shown that unexpected changes in uncertainty regarding
conditional volatility of one indicator are transmitted to the fiscal policy affect economic activity, leading to a sizable adverse
conditional volatility in the remaining financial indicators. In a effect on output ([18] and [19]). Fourth, uncertainty that works
tumultuous policy environment similar to the one observed through growth options mechanism might have a positive impact
Turkey, we find that the conditional volatility of the different on long run growth. In a recent study, [20] shows that R&D intensive
financial indicators respond to salient events that occurred over firms can raise their stock value by taking advantage of growth
our sample period. opportunities particularly at times of high uncertainty. Fifth, studies
Our results relate to the literature that has found predictive point to financial frictions as one of the key mechanisms through
effects of commodity prices such as oil prices on the economic which fluctuations in uncertainty can have an adverse effect on
policy index that, in turn, may affect equity prices for developed investment by raising risk premiums ([21] and [22]).
countries [9,10] as well as studies for emerging market economies Another strand of the literature examines contractionary
that examine the role of economic policy uncertainty on real effects of uncertainty with reference to decreasing household
outcomes in these economies [11]. Our results differ from these spending. In this vein, [23] model such behavior as a
papers in that we focus on a period of large monetary shocks and precautionary response to uncertainty and increasing costs of
monetary policy reversals for a major emerging market economy. finance arising from risk premium adjustments. Lastly, a group of
While we do not provide an analysis of the effects of economic studies focuses explicitly on economic policy uncertainty and
policy uncertainty on real outcomes, our results nevertheless examines the negative impacts of uncertainty derived solely from
provide novel information about the channels through which
economic policy uncertainty impacts high-frequency developments
observed in Turkish financial markets. 4
See Bloom [57] for a detailed survey on how uncertainty affects economic activity.
Frontiers in Physics | www.frontiersin.org 3 May 2022 | Volume 10 | Article 864207Yeşiltaş et al. Twitter-Based Economic Policy Uncertainty Index
policy developments. Among other studies [24–28], and [1] note increase in economic policy uncertainty on unemployment in
the depressive effects of uncertainty arising from monetary, fiscal, recessions and expansions in the United States. [36] use
and regulatory policies on economic aggregates, investment and United States interest rate forecasts from Blue Chip Economic
business cycle volatility. The survey-based evidence shown in [29] Indicators (BCEI) to construct an uncertainty proxy and examine
suggests that higher trade policy uncertainty since 2017 has the inter-relationships among monetary policy uncertainty, monetary
dampened U.S. business investment. Moreover, [30] indicate policy expectations, core inflation, unemployment, and the federal
that uncertainty regarding trade policy reduced U.S. business funds rate in a time-varying VAR framework for the United States.
investment by about 1.5% in 2018. There are also empirical studies conducted in an emerging
In recent years, many of the empirical studies in the related market economy context. Following the approach in [32], [11]
literature endeavor to develop accurate empirical measures for infer a measure of global uncertainty as periods of spikes in
uncertainty. The reasons for the recent surge in interest range the VXO index, which is the implied volatility on a synthetic 30-
from the ease to accessing online news archives and digital days option on the S&P 100 stock index.6 They examine the
archives of opinionated data, to the availability of firm- and impact of their measure of uncertainty on a set of financial and
household-level data, to the application of NLP techniques that real variables for emerging market economies by conducting an
allows researchers to save memory. A relatively new and growing SVAR analysis. They find that an increase in uncertainty is
field aims to develop a measure for economic policy uncertainty by associated with a much more severe decline in investment for
using text search methods. The well-known economic uncertainty a group of 20 emerging market economies which is also more
index created by [1] is a monthly index for the US economy based on persistent compared to a group of 20 developed economies. They
the frequency of a selected list of words in 10 leading US newspapers also find a significant decline in consumption due to a rise in
since 1985.5 More recently, [31] construct a new uncertainty index, uncertainty measured in this way, in contrast to developed
the World Uncertainty Index (WUI), by calculating the frequency economies where consumption does not deviate significantly
of the word “uncertainty” within the country reports released by from its trend in response to such shocks. [3] estimate an
Economist Intelligence Unit for 143 individual countries including SVAR model for Turkey which includes an EPU index, the
Turkey on a quarterly basis from 1996 onward. real exchange rate, the real interest rate and one of three
The measurement of economic policy uncertainty and its role macroeconomic variables among real consumption expenditures,
in affecting real and financial outcomes have been investigated in real investment expenditures and real GDP. They find that higher
numerous empirical studies. Using an SVAR framework, [32] economic policy uncertainty leads to greater declines in investment
studies the impact of heightened uncertainty that is associated compared to consumption or real GDP.
with major economic and political shocks like Cuban Missile There is also an extensive literature that examines the
crisis, the assassination of JFK, the OPEC I oil-price shock, and interaction of economic policy uncertainty with financial
the 9/11 terrorist attacks. The simulation results of this study market indicators. [9] show that the EPU index can help to
show that uncertainty generates a 1% drop and rebound in predict the daily realized stock market volatility on the S&P 500
output, employment, and productivity growth, leading to index both in-sample and out-of-sample for a sample period
powerful real-option effects, which are due to firms using their 1996–2013. [10] examine the effects of oil price shocks arising
incentive to delay their investment and hiring decisions. [33] from oil supply-side shocks measured as changes in world oil
develop a time-varying measure of uncertainty as the conditional production, aggregate demand shocks and oil-market specific
volatility of the unforeseeable components of the future values of shocks on the US EPU index and aggregate United States real
a set of key macroeconomic variables. They report fewer incidences stock returns. [37] study the predictability of the US EPU index
of uncertainty compared to other approaches such as [32] and find using a basket of 23 commodity price changes. They show that
that their measure of uncertainty is bunched around three deep commodity price changes can be considered as a leading indicator
recessions. The results of their Vector Autoregressive (VAR) analysis of US EPU index. This arises from the fact that one of the
suggest that macro uncertainty explains 29% of the forecast error components used to create the US EPU index is given by forecast
variance of industrial production while stock returns explain only disagreement among professional forecasters, which becomes
9%. In an application that focuses on regulatory risk, [34] studies more uncertain during periods of oil price changes.
the effect of the Financial Regulation Policy Uncertainty (FRPU) A number of studies have also examined the role of economic
index on the behavior of credit spreads together with other policy uncertainty induced by the Covid-19 crisis. [38] investigate
macroeconomic variables in both a linear SVAR framework and multiple economic uncertainty indicators for the United States
a nonlinear Smooth Transition VAR (STVAR) model. She finds that and United Kingdom before and during the COVID-19 pandemic.
an increase in the FPRU index leads to an increase in the cost of According to Choleski-identified VAR models they fit to monthly
external finance as well as persistent decline in real activity. Likewise, U.S. data, an uncertainty shock predicts record high drops in
using an STVAR model, [35] study the effects of an unanticipated industrial production of 12–19% during the Covid-19 pandemic.
5 6
The authors of Baker et al. [1] develop indices of economic policy uncertainty for They define these events as periods in which the Hodrick–Prescott de-trended
countries around the world. In particular, as of March 2022, the most up-to-date VXO series exceeds its mean by more than 1.65 standard deviations. In this way,
EPU indices are provided for 29 countries in their website: https://www. they obtain six events over the sample period 1990–2010 and generate a measure of
policyuncertainty.com/all_country_data.html. uncertainty by weighing these events with the magnitude of the volatility shock.
Frontiers in Physics | www.frontiersin.org 4 May 2022 | Volume 10 | Article 864207Yeşiltaş et al. Twitter-Based Economic Policy Uncertainty Index
[39] construct a monthly index for each state in the United States of the Twitter accounts of economic policy experts with other
using digital archives of local newspapers. They show that the accounts in Twitter through the number of their followers. The
COVID-19 pandemic drove huge increases in policy uncertainty select group of Twitter users consists of ministers,
and unemployment, more so in states with stricter government- parliamentarians, academicians, bureaucrats, journalists, and
mandated lockdowns. Using NLP techniques, [40] develop an private sector professionals that are considered to have
economic policy uncertainty index (EPU-NLP) for Canada and capability to provide expert opinion on economic policy. The
the United States. They also construct a so-called EPU-Boolean assessment of economic policy uncertainty by these selected
index following the approach in [1] and find that their EPU-NLP experts is similar, in some ways, to the assessment of risk and
index leads to larger declines in real GDP, employment, industrial uncertainty by the US economists questioned in the highly
production and the TSX Composite index compared to the EPU- regarded Survey of Professional Forecasters that is conducted
Boolean index for Canada over the period 2015–2020 that includes by the Federal Reserve Bank of Philadelphia.8
the Covid-19 crisis. Arbatli [41] show that the EPU index rises in With the increased capacity of Twitter to provide up-to-date
Japan in reaction to financial crises, the consumption tax hikes, documentary on world events, it is inevitably getting harder to
Brexit, and COVID-19. extract useful information from the bulk data generated daily by
users.9 As mentioned in the Introduction, our paper differs from
existing studies that use bulk Twitter data. Instead we
3 THE TWITTER-BASED ECONOMIC implement a user list curation process. This alternative
POLICY INDEX approach allows us to restrict our analysis to a select group
of Twitter accounts. By doing so, we are able to update our
The need for the perception of opinions, attitudes, emotions, TEPU index and to capture the daily developments in the
appraisals towards entities such as products, services, organizations, Turkish economy in a timely manner. To verify that our
individuals, issues, events, and topics coincides with the rapid growth TEPU index does not suffer from any bias that might
of social media platforms on the Web. Through multiple platforms potentially arise from the above-mentioned selection of
including reviews, forum discussions, blogs, microblogs, Twitter, Twitter accounts, we use a bootstrapping algorithm that we
and social networks, we now access digital archives of opinionated run repetitively with different seed lists, which results in the
data around the world [42]. same final candidate list in all repetitions.
The number of studies conducting sentiment analysis has
proliferated in recent years. For example, [43] investigate public 3.1 The Selection of Twitter Users
sentiment during the 2008, 2009 election by comparing the measures In the related literature researchers use several different
based on traditional presidential election/approval polls with those methods to identify whether the content is about the
based on the text analysis of Twitter data. Sentiment analysis has been “economy,” “policy” and/or “uncertainty” to construct a
widely used in many different fields ranging from computer science, measure of economic policy uncertainty. Among others, for
to management science, to health science, and to social sciences such example [5] extract all tweets from Twitter API data that
as economics and finance. This increasing popularity of sentiment contains the words “uncertain,” “uncertainly,” “uncertainties,”
analysis is due to the fact that opinions shape almost all human “uncertainty.“, whereas [40] use NLP methods to determine
activities and have a significant impact on our behaviour [44]. content. In our paper, we implement a user list curation
From the perspective of economic analysis, the way agents process that closely follows [45, 46]. This provides us with
perceive events, policies and markets, make their choices, and set three advantages: First, it enables us to remove tweets with
their expectations heavily depends on how others see and evaluate only a weak impact on public opinion and eliminate the need
the world. Therefore, agents generally account for others’ opinions for scaling noisy data created by bulk retrieval methods.10
when making their decisions. For the same reason, households, Second, it prevents errors arising from the Turkish language
firm managers and policymakers become attuned to expert opinion applications of NLP methods. Third, it presents a novel
whenever they are uncertain about economic policy. approach to the subject of content-based EPU indexing.
In this paper we construct a measure for economic policy
uncertainty based on a select group of Twitter accounts whose
tweets are considered to reflect expert opinion in the area of
economic policy by the general public. In line with the related 8
The European Central Bank conducts the same survey to obtain the forecasts of
literature on social media interactions,7 we analyze the interaction the economists located in Euro Area. See https://www.philadelphiafed.org/surveys-
and-data/real-time-data-research/survey-of-professional-forecasters and https://
www.ecb.europa.eu/stats/ecb_surveys/survey_of_professional_forecasters/html/
7
Using three measures of influence including in-degree, retweets and mentions, index.en.html for further details on these surveys.
9
Cha, Haddadi, Benevenuto and Gummadi [58] investigate the dynamics of user Turkey has 16.25 million active Twitter users, ranking as the seventh country in
influence across topics and time based on these notions. One of their findings the world as of October 2021, see https://www.statista.com/statistics/242606/
shows that influence is typically gained through concerted effort such as limiting number-of-active-twitter-users-in-selected-countries/.
10
tweets to a single topic. Verweij [59] studies the interactions between a group of Likewise, Storyful, a news and intelligence agency, devotes significant time to
Dutch journalists and politicians and show that contacts on Twitter are driven by manually curate content on social networks such as Twitter and YouTube with the
the need for finding and spreading news, as opposed to religious or ideological aim of filtering news, or newsworthy content, from the vast quantities of noisy data
identity of parties and media. on these platforms.
Frontiers in Physics | www.frontiersin.org 5 May 2022 | Volume 10 | Article 864207Yeşiltaş et al. Twitter-Based Economic Policy Uncertainty Index FIGURE 2 | The phases of bootstrapping algorithm. TABLE 1 | Descriptive statistics of the selected Twitter user accounts. Occupation/Variable Mean Std Min Max Academicians (# 170) Number of Followers 54,529.1 283,969 93 3,260,269 Number of Followings 1,080.7 1,092.6 0 5,684 Number of Tweets 9,757.8 14,385.3 33 105,827 Registration Date 2013 2.9 2009 2020 Parliamentarians & Bureaucrats (# 50) Number of Followers 322,652 547,982 777 2,723,161 Number of Followings 909.8 1,026.3 1 4,158 Number of Tweets 13,829.7 22,551.5 205 153,345 Registration Date 2012 2.2 2009 2018 Journalists (# 129) Number of Followers 59,856.5 139,654 234 825,779 Number of Followings 1,076.5 1,088.9 15 7,911 Number of Tweets 14,531 19,958.4 28 127,223 Registration Date 2011 2.4 2008 2019 Private Sector Professionals (# 312) Number of Followers 28,080.7 69,974.3 31 571,834 Number of Followings 977.9 1,193.6 3 8,443 Number of Tweets 11,384.4 20,312.1 37 216,277 Registration Date 2012 2.51 2007 2020 NOTES: This table provides descriptive statistics of the selected Twitter user accounts retained in the final candidate list. Frontiers in Physics | www.frontiersin.org 6 May 2022 | Volume 10 | Article 864207
Yeşiltaş et al.                                                                                                             Twitter-Based Economic Policy Uncertainty Index

   Our bootstrapping algorithm consists of three distinct list                                      [−] Following the annotation process suggested by
types:                                                                                              Giachanou and Crestani [47],14 the profiles of 128
                                                                                                    Twitter accounts are manually annotated by three
    Seed list: The initial list is used to initialize the process, serving                          different human annotators to identify those belonging to
    as a nucleus in the bootstrapping algorithm [45]. This list                                     the experts in the field of economics and finance.
    is not called first, second etc. as it is only used to initialize the                            Additionally, we delete users who closed their Twitter
    process.                                                                                        accounts during the course of our study or post only
    Recommended List: This list is prepared to be annotated,                                        personal tweets.
    purified from the users in the seed list and the                                                 [−] This results in a list of 67 users that we name as the 2nd
    recommended list formed in the previous phase. These                                            candidate list.
    lists are named according to which phase they are                                             • Second Phase:
    formed, first, second, etc.                                                                      [−] We combine the seed list and the 2nd candidate list,
    Candidate List: This list is comprised of experts in economics                                  which yields us a merged list of 70 users.
    and finance, according to the annotation results of the                                          [−] We constitute a list of 6,351 users that corresponds to
    recommended list formed in the previous phase. These lists                                      those followed by at least 2 of the Twitter accounts available
    are named according to which phase they are formed, second,                                     in this merged list.
    final, etc.                                                                                      [−] From these 6,351 users we remove the users of the seed
                                                                                                    list and the 2nd recommended list, yielding us the 3rd
   As illustrated in Figure 2 we implement three phases to obtain                                   recommended list of 6,220 users.
the final candidate list of Twitter accounts whose tweets are used                                   [−] We implement the above-mentioned annotation
to construct our TEPU index. In what follows, we provide the                                        process and the cleaning filter. This results in a list of
details of these phases:                                                                            687 users that we name as the 3rd candidate list.
                                                                                                  • Third Phase:
    • First Phase:                                                                                  [−] We combine the seed list, the 2nd candidate list, and
      [−] We constitute our initial list that contains a small                                      the 3rd candidate list, which yields us a merged list of
      number of Twitter accounts that have been considered to                                       757 users.
      belong to experts on the matters of economics and finance                                      [−] We constitute the list that corresponds to those
      by the Turkish community.11 The users in the initial list are                                 followed by at least 2 of the user accounts available in
      required to satisfy the following criteria:                                                   this merged list. At this point, the human annotators fail
       (i) to hold a PhD degree in economics or finance                                              to manually annotate the profiles of 65,391 users to label
      (ii) to possess the highest number of followers (1 million                                    who are experts in the field of economics and finance.
           plus).12                                                                                 Therefore three different human annotators proceed by
      [−] The selection results in an initial list of three users. We                               annotating the profiles of randomly chosen users among
      name this list the seed list as shown in Figure 2.                                            65,391 users.
      [−] We constitute a list of 131 users that corresponds to                                     [−] During this annotation process, we observe that these
      those followed by at least 2 of the Twitter accounts available                                users are not representative of experts compared to those
      in the seed list.13 We then remove the first three users that                                  retained in the earlier phases, hence we end the algorithm at
      we name as the seed list from these 131 users.                                                this point.
                                                                                                    [−] As before, we delete users who closed their Twitter
                                                                                                    accounts during the course of our study or who post only
                                                                                                    personal tweets.
11
   Due to the nature of the bootstrapping algorithm, it is immaterial how many                      [−] This results in the list of 661 users that we use to construct
people are included in the initial list. It may differ according to the country one                 our TEPU index. We name this list as the final candidate list.
focuses on and the selection criteria that is implemented. In our case, we want to
restrict our initial list to a select set of people who are expected to be the most             To validate our approach, we implement the above-
influential on public sentiment. This way of identification of influential experts              mentioned phases using the following alternative seed lists:
builds on the insights of Weng, Lim, Jiang and He [60] where an influential
                                                                                             1) the Twitter accounts that are followed by 16 Twitter
twitterer is defined as one with certain authority within her social network. To this
end, we start with an initial list that comprises of Twitter accounts of three experts       accounts who have more than 500,000 followers, and 2) the
in the field of economics and finance that have the highest number of followers.               Twitter accounts that are followed by 7 randomly selected
12
   In addition to this “in-degree” measure of user influence, the two of these three          Twitter accounts out of the 16 Twitter accounts who have more
experts are ranked as the first two twitterers in the Turkish community in 2021 in
terms of number of retweets, see https://twitter.com/adbaanalytics/status/
148704504764429926 for further statistics released by Adba Analytics, a digital
                                                                                             14
consumer research agency.                                                                      Similarly, Saif, Fernandez, He and Alani [61] construct a data set, namely, the
13
   This restriction goes in line with the “homophily” phenomenon. The analysis of            Stanford Twitter Sentiment Gold (STS-Gold) that has been used for Twitter
Weng et al. [60] shows that “homophily” does exist in Twitter data, implying that            Sentiment Analysis. This data set contains 2,034 tweets which are automatically
the “following” relationships between twitterers are related to their topical                annotated with sentiment labels. This data set also contains 58 entities manually
similarity.                                                                                  annotated by three different human annotators.

Frontiers in Physics | www.frontiersin.org                                               7                                            May 2022 | Volume 10 | Article 864207
Yeşiltaş et al. Twitter-Based Economic Policy Uncertainty Index
TABLE 2 | Dictionary of keywords.
Category Subcategory Turkish Term English Term
ekon/iktisat econ/economics
işsizlik unemployment
Economy yabancı yatırımcı foreign investor
dış yatırım foreign investment
bankacılık banking system
Hazine Treasury
Hazine ve Maliye Bakanliğı Ministry of Treasury and Finance
bütçe açı ğı budget deficit
regülasyon regulation
Fiscal policy devlet harcamaları government spending
devlet büçesi government budget
devalüasyon devaluation
devlet borcu government debt
mali teşvik fiscal stimulus
dış borç external debt
mali disiplin fiscal discipline
Merkez Bankası Central Bank
faiz Interest
Policy FED FED
IMF IMF
açık piyasa işlemleri open market operations
ortodoks orthodox policies
parasal sıkılaşma monetary tightening
Monetary Policy para politikası monetary policy
parasal genişleme monetary expansion
Avrupa Merkez Bankası European Central Bank
ihtiyat akçesi precautionary saving
para arzı money supply
euro euro
dolar US Dollar
döviz foreign exchange
enflasyon inflation
ithalat exports
Trade Policy ihracat imports
cari açık current account deficit
belirsiz uncertain
Uncertainty kriz crisis
zarar loss
eksik insufficient
TBMM Turkish Grand National Assembly
Covid-19 Covid-19
saray presidential palace
Economic Situation kurultay convention
parlamento parliament
güçler ayrılığı separation of powers
tüzük charter
düzenleme rule-based arrangement
NOTES: This table provides the dictionary of keywords that we search within the Turkish-language tweets posted by 661 Twitter accounts retained in the final candidate list. We obtain this
dictionary by identifying any words that begin with the corresponding Turkish term listed in each subcategory of the EPU index.
Frontiers in Physics | www.frontiersin.org 8 May 2022 | Volume 10 | Article 864207Yeşiltaş et al. Twitter-Based Economic Policy Uncertainty Index
than 500,000 followers. Both seed lists yield two final lists of 4 THE TEPU INDEX AND FINANCIAL
users that are identical to the final candidate list of 661 users MARKETS
obtained using the reference seed list.
Table 1 presents descriptive statistics of the selected Twitter 4.1 Data
user accounts categorized by occupation.15 This table reports In addition to the daily TEPU index, we make use of daily data on
the number of followers, followings and tweets, and the the selected financial indicators that we use to track developments
registration date corresponding to each occupation. These in Turkish financial markets over the period 2013–2021.
statistics show that in the sample period 2013–2021, on First, we use the Chicago Board Option Exchange (CBOE)
average, parliamentarians and bureaucrats are the most- Volatility Index (VIX) to proxy for global risk perceptions. The
followed users whereas they don’t follow people as much as VIX is a real-time index that represents the market’s expectation
users in other three categories do. Further, on average, experts of near-term price changes on the S&P 500 Index (SPX). It is
in all these four categories post at least around 10,000 tweets, measured as the implied volatility on SPX options, which
suggesting that they seem to actively use the Twitter platform provides a way to gauge market sentiment, and in particular,
for transmitting their opinions to the public in our sample the degree of fear among market participants. We obtain the end-
period. In particular, starting with the seed list of three Twitter of-day VIX values from the Federal Reserve Bank of St Louis
user accounts belonging to the most-followed experts in the Economic Database (FRED). The Credit Default Swap (CDS)
field of economics and finance in the Turkish community, we spread is an indicator that measures the risk of default on
obtain a network of users that not only capture the influence of Turkey’s sovereign debt. Equivalently, the CDS spread represents
these people on public opinion but also their interaction with the annual premium (the CDS “fee” or “spread”) to be paid to the
other users that they follow. lender against the risk of default. If the number of years of the loan is
not specified in the contract, calculations are made according to the
3.2 Constructing the Daily TEPU Index 5-years CDS Spread. The Bloomberg Terminal provides the daily 5-
To construct the TEPU index, we focus on the sample period years CDS spread series, which we measure as basis points on US
from 1 January 2013 to 22 December 2021 because this period dollar-denominated CDS contracts. The spot USD/TRY exchange
coincides with the onset of many events associated with political rate and the BIST-100 index are obtained from Yahoo! Finance. The
and economic uncertainty in Turkey. first represents units of the domestic currency, namely the Turkish
We use the same search procedure developed by [1]. We lira, per US dollar. The latter measures the performance of the top
treat the Twitter data-based series as if they are extracted from 100 stocks traded on the Istanbul Stock Exchange entitled as Borsa
a single newspaper. We use the Twitter API to obtain all of Istanbul.17
the “following” lists of users. Using the web scraping with The daily series are reported as opening, closing, high and low
Python, we extract the full tweet content that the users posted values. In our analysis we use their closing values. We aggregate
within the specified time interval. We exclude retweets in the the resulting daily series into weekly series to be used in our
calculation of our TEPU index to avoid duplicates. We analysis over the period 2013w1 and 2021w51.
transform the letters in the tweets into lower case and use
English characters throughout. 4.2 Event Analysis
[1] use a list of words that captures the policy uncertainty In what follows, we conduct an event analysis to show how our
characteristics of advanced economies. However, in our search TEPU index relates to important political and economic events
process, we include the set of words that are considered more that have occurred in Turkey in the sample period 2013–2021.
relevant for emerging market economies as in [6] and [2]. Table 3 records both domestic and foreign events that may
Table 2 shows the Turkish and English versions of the words have been associated with changes in economic policy
that we search for. In each tweet posted by these selected uncertainty in Turkey. It considers the timeline of events by
661 Twitter accounts in the period 2013–2021, we search for making a distinction between political announcements versus the
keywords and record the word count data. We normalize the immediate reaction of financial markets. This table indicates
raw word count data using the standardization procedure episodes of political uncertainty in the weeks or months
outlined in [1]. In particular, we first count the keywords at preceding such events as national elections or referendums
the daily frequency.16 Second, we compute the value M which whereas it indicates the exact date associated with monetary
corresponds to the mean value of the daily series for the entire policy announcements and surprises. As a visual device,
period from 1 January 2013 to 22 December 2021 and multiply Figure 3 plots the daily TEPU index from 1 January 2013 to
the daily series by its own normalizing factor, 100/M. 22 December 2021 and tracks the evolution of economic policy
uncertainty for Turkey. Some of the events associated with spikes
15
In the final candidate list of 661 users, 4 users are identified as both academician
17
and parliamentarian/bureaucrat based on their personal information reported in According to the 2020/26 numbered notification of Borsa Istanbul published on 4
their Twitter accounts. April 2020, especially from BIST-30 and BIST-100, two zeros were removed from
16
To correct for intra-week variation in the number of tweets, we scale the daily the BIST Equity Indexes as of Monday 27 July 2020 and the index value has
TEPU index by the average number of tweets for each day of the week during the continued to be displayed as two digits after the comma. In order to have a
year 2017. consistent format in these series, we divide the values before 27 July 2020 by 100.
Frontiers in Physics | www.frontiersin.org 9 May 2022 | Volume 10 | Article 864207Yeşiltaş et al. Twitter-Based Economic Policy Uncertainty Index
TABLE 3 | Timeline of events.
Year Date Event
2013 28 May Gezi Parkı Protests
18 September Fed maintains the pace of stimulus in the face of uncertainty about the US economy
17–25 December Corruptions allegations against members of the government
2014 29 January CBRT MPC increases its weekly repurchase rate from 4.5 to 10%
2015 April Uncertainty about elections scheduled for June 2015
7 June General elections
26 August General elections are re-scheduled for 1 November 2015
October Uncertainty about early elections scheduled for 1 November 2015
16 December FED FOMC increases the Federal Funds rate from 0.25 to 0.50%
ending 7 years of near zero interest rates
2016 22 May Resignation of Prime Minister Ahmet Davutoğlu
15 July 15 July Coup Attempt
21 September FED FOMC leaves the Federal Funds rate unchanged at 0.50%
2017 January Upcoming constitutional amendment in Turkey
16 April Constitutional amendment referendum
2018 May Political uncertainty about early elections on June 24
10 August Black Friday Currency Shock
13 September CBRT MPC increases its weekly repurchase rate of 17.75% by 625 basis points to 24%
2019 6 July CBRT Governor Murat Çetinkaya is replaced by Governor Murat Uysal
31 July FED reduces the target range for its overnight lending rate from 2.25 to 2%
2020 11 March The first Covid-19 case is observed in Turkey
24 September CBRT MPC increases its policy rate of 8.25% by 200 basis points to 10.25%
7 November CBRT Governor Murat Uysal is replaced by Governor Naci Ağbal
19 November CBRT MPC increases its policy rate of 10.25% by 475 basis points to 15%
24 December CBRT MPC increases its policy rate of 15% by 200 basis points to 17%
2021 20 March CBRT Governor Naci Ağbal is replaced by Governor Şahap Kavcıoğlu
23 September CBRT MPC reduces its policy rate of 19% by 100 basis points to 18%
14 October Two deputy governors and one member of the CBRT MPC are
dismissed from their positions
21 October CBRT MPC reduces policy rate of 18% by 200 basis points to 16%
18 November CBRT MPC reduces policy rate of 16% by 100 basis points to 15%
16 December CBRT MPC reduces policy rate of 15% by 100 basis points to 14%
Source: Authors’ elaboration.
in economic policy uncertainty have already been documented by TEPU index rises before significant political events such as the
earlier papers [3,4].18 In common with these papers, we find that national elections which were held on 24 June 2015 and re-
beginning in 2013, some of the most significant events refer to the scheduled for 1 November 2015. The TEPU index spikes during
occurrence of the Gezi Protests, which erupted due to a the failed coup attempt of 15 July 2016. There is also evidence of a
disagreement regarding the usage of a municipal park and general increase in uncertainty in the periods preceding the
turned into nation-wide protests against the government, as presidential referendum of 16 April 2017 as well as in the few
well as the revelation of corruption allegations against various weeks immediately preceding the elections under the new
members of the government during 17–25 December 2013. The presidential system that took place on 24 June 2018.
As a further way of illustrating the impact of economic policy
uncertainty for Turkey, Figure 4 considers two measures of risk
18
For the period 2000–2018, Topçu and Oran [4] find that most of the uncertainty assessment by foreign and domestic agents together with our
in Turkey over the period 2000–2018 arises from events that trigger political TEPU index. This figure displays the behavior of the TEPU
uncertainties such as elections and the changes in policy that these may induce. index together with two other indicators that summarize the risk
Frontiers in Physics | www.frontiersin.org 10 May 2022 | Volume 10 | Article 864207Yeşiltaş et al. Twitter-Based Economic Policy Uncertainty Index
FIGURE 3 | The daily TEPU index. This figure plots 7-day moving average of logarithm of TEPU index from January 1, 2013 to December 22, 2021. We provide the
details on the construction of this index in Section 3.
perceptions of foreign investors, namely, the VIX, as well as a Uncertainty about policy changes as measured by the TEPU
measure of country risk premium for Turkey, namely, its CDS index rises sharply in March 2021 when Governor Naci Ağbal, a
spread, over the entire sample period from January 2013 to central official known for his orthodox views on monetary policy,
December 2021. As a significant regularity, we note that the is replaced as governor of the CBRT by Governor Şahap
TEPU index moves in tandem with both of these indicators. The Kavcıoğlu. In response to this event, the daily value of the
TEPU index and the CDS spread, in particular, display a USD/TRY exchange rate jumps from 7.305 TRY per USD to
tendency to increase together especially over the period since 8.0954 TRY per USD, indicating a 10% depreciation of the
2018. One of the major events in 2018 is the Black Friday Turkish lira. Turkish bond and stock markets also witness
currency shock and the CBRT’s subsequent decision to increase their largest capital outflow of $1.9 billion since 2006.19 As a
its policy rate by 625 basis points. As Figure 4 shows, this event consequence, the BIST-index falls by around 8% on 21 March
is captured by the increase in both the TEPU index and the CDS 2021, the day following the dismissal of Governor Naci Ağbal.
spread for Turkey in August 2018. Following a sharp These developments are also reflected in an increase in Turkey’s
depreciation in the Turkish lira from 4 TRY per USD to 7 CDS spread and a smaller increase in the VIX in March 2021.
TRY per USD, the Turkish lira recovers after the large policy After September 2021, the effects of the unconventional
rate increase by the CBRT. In July 2019 there is an increase in monetary policy being espoused in Turkey begin to manifest
Turkey’s CDS spread concurrently with a spike in the TEPU themselves. As Table 3 shows, consecutive decreases in the
index that occurs in response to the replacement of Governor CBRT’s policy rate are implemented between 23 September
Murat Çetinkaya by Governor Murat Uysal. 2021 to 16 December 2021. During this period, the CBRT
In March 2020, we observe a large increase in the VIX in MPC reduces its policy rate by 500 basis points, the last cut of
response to the onset of the Covid-19 crisis, which is 100 basis points occurring after a MPC meeting on 16 December
also reflected in a significant increase in Turkey’s CDS 2021. These changes lead to an unprecedented increase in the
spread. As it is well-known, the VIX captures changes in the TEPU index. Turkey’s CDS spread shows a tendency to increase
risk perceptions of foreign investors due to exogenous shocks, rapidly with the TEPU index, rising from a value of around
external monetary and financial conditions, and developments 388 up until the second week of September 2021 to 578 by 17
specific to emerging market economies including the Turkish December 2021.
economy. In this regard, the correlation between the VIX and During this period, Turkey’s exchange rate also follows a highly
the TEPU index partially reflects the fact that the Turkish volatile pattern, with the value of the Turkish lira falling by around
economy is vulnerable to episodes of divergence between its 120% against the US dollar in a spiraling fashion until the end of
policy actions relative those of the US, as argued by Kalemli- December 2021 when the introduction of new foreign-exchange
Özcan [48]. This is due to its dependence on international linked saving schemes help to stem the rout. The volatility in the
capital flows for financing its current account deficit. By foreign exchange rate market is also accompanied by volatility in
contrast, Turkey’s CDS spread tends to capture a systematic Turkey’s stock market, as trading is suspended twice on all listed
assessment of the uncertainty and risk premium associated with stocks as the BIST-100 index falls by more than 7%. Countervailing
long-term prospects for the Turkish economy. This is evidenced this effect, stock prices nevertheless recover as investors in Turkey
by its sharp rise around the August 2018 currency shock as well
as the Covid-19 shock, which tends to persist until the end of
2020. These movements are accompanied by significant 19
http://www.bloomberg.com/news/articles/2021-04-01/turkey-s-central-bank-
increases in the TEPU index as well. revamp-spurs-biggest-outflows-in-15-years.
Frontiers in Physics | www.frontiersin.org 11 May 2022 | Volume 10 | Article 864207Yeşiltaş et al. Twitter-Based Economic Policy Uncertainty Index
seek to take advantage of the price discount on stocks in Turkish 5.1 Estimates of the SVAR Model
lira to protect their savings.20 To estimate the SVAR model, we first test the different series for
unit roots based on the Augmented Dickey-Fuller (ADF) test. We
cannot reject the null hypothesis of a unit root for the USD/TRY
5 ECONOMETRIC METHODOLOGY exchange rate and the BIST-100 stock index, suggesting that they
are non-stationary. On the other hand, the TEPU index, the VIX
In this section, we consider the dynamic inter-relationships among and the CDS spread are shown to be trend-stationary.
fluctuations in the TEPU index and a set of key financial indicators We use the HP-filter to remove time-varying trends in the
for Turkey, including the CDS spread, the BIST-100 stock index and different series. While implementing the HP-filter has been
the USD/TRY exchange rate, for the sample period comprising 1 criticized as being ad hoc and for inducing spurious dynamics
January 2013 to 22 December 2021. In this analysis, we do not seek to into the series to which it is applied [49], the so-called Hamilton
jointly model the dynamics of the VIX with the remaining variables, regression filter which uses the residuals from an h-step ahead
instead considering its lagged values as exogenous control variables.21 regression of a variable on values of itself at time t and earlier is
Consider a standard VAR of the form also known to extract specific frequencies of the time series [50].
[51] provide a so-called boosted version of the HP filter which
yt A1 y t−1 + A2 y t−2 + / + Ap y t−p + C1 xt−1 + / + Cq xt−q + ut ,
they argue can “remove trend mechanisms that involve integrated
(5.1) processes, deterministic drifts, and structural breaks,” which are
the most common types of trend processes observed in economic
where yt is the K × 1 vector for K 4 comprising the TEPU
and financial data.22 We adjust the HP-filter for the weekly
index and the three domestic financial variables and
frequency of observations using the approach in [52].
xt (1, VIXt )′. In this expression, Ai , i . . . , p denote K × K
In what follows, we estimate an SVAR model with three lags of
matrices of autoregressive coefficients, p the lag length of the
the endogenous variables and 4 lags of the VIX. Our choice is
VAR, Ci , i 1, . . . , q the K × 2 matrices of coefficients for the
based on the AIC, while selection criteria such as the SBIC and
exogenous variables, and q their lag length. Here ut denotes a
HQIC which favor more parsimonious specifications choose a lag
K × 1 vector of innovations with mean E(ut ) 0 and an
length of 2. Based on diagnostic tests for the behavior of the SVAR
unconditional variance-covariance matrix E(ut ut′) Σ and
model, we find that evidence of stability in the conditional mean
E(ut us ) 0 for s ≠ t. In general, the elements of ut will be
equations in that all of the estimated eigenvalues are inside the
contemporaneously correlated, i.e., σ i,j ≠ 0. Hence, we cannot
unit circle. This suggests that the system we are estimating is
consider experiments where we hold, say ui,t constant and let uj,t
stable. Second, the Lagrange Multiplier test for autocorrelation
vary for i ≠ j. In what follows, we implement an SVAR approach
[53] suggests that the absence of serial correlation in the residuals
to identify the structural shocks. Consider the representation
of the SVAR model for almost all lags up to lag 24.23
Aut Bεt , where A is a lower triangular matrix with ones on its
In our analysis, we make use of the SVAR model to conduct
diagonal, B is a diagonal matrix and εt is a vector of
Granger causality tests to understand the dynamic inter-relationships
orthogonalized innovations. In this expression, εt ~ N(0, I)
among the different series. Granger causality tests provide a way for
and E(εt εs′) 0. Here the matrix A captures the
examining the predictive power of one variable yi,t for another given
contemporaneous relations between observable variables and
by yj,t . More formally, let yi,t (h|It ) be the optimal (minimum Mean
the variance-covariance matrix of the errors ut and satisfies Σ
Square Error (MSE)) h-step predictor of the process yi,t at origin t,
A−1 BB′(A−1 )′.
based on the information in It . Denote the corresponding forecast MSE
In our analysis, we impose a recursive ordering to identify the
by Ξyi (h|It ). The process yj,t is said to cause yi,t in Granger’s sense if
structural shocks in the estimated SVAR model. In the literature,
Ξyi (h|It ) < Ξyj (h|It {yj,s |s ≤ t}) for at least one h 1, 2, . . . ..24 In
alternative indices of economic policy uncertainty have typically
our analysis, we use the multivariate version of Granger causality tests to
been placed first based on the notion that shocks to this variable
test for the predictability of one variable by another, after controlling for
have a contemporaneous impact on the remaining variables while
the effects of other potentially relevant variables [54]. In a multivariate
none of the other variables are assumed to have a
VAR context, a test of Granger causality involves a test of zero
contemporaneous impact on it. In our analysis, we place the
restrictions on a subset of the coefficients of the VAR [54,55].
CDS spread first to allow for possible contemporaneous effects
Table 4 shows the results of Granger causality tests among
from it to affect the TEPU index and the remaining variables.
expert opinion represented by the TEPU index and Turkey’s
Likewise, each of the remaining variables will have a
contemporaneous effect on the variables listed after them but
will not affected by them contemporaneously. 22
The boosting involves applying the HP-filter multiple times based on stopping
criteria from a machine-learning algorithm.
23
We include 4 lags of the VIX, as it helps to reduce the autocorrelation in the
20
http://www.reuters.com/markets/stocks/turkish-stocks-open-down-after-sharp- residuals from the estimated SVAR.
friday-selloff-2021-12-20/. 24
In this definition, It {yj,s |s ≤ t} is all of the information relevant for predicting yi,t
21
To the extent that the variables in our study reflect the domestic dynamics of except for information in current and past values of yj,t . Thus, yi,t can be predicted
financial markets in Turkey, especially at the weekly frequency, inclusion of the more efficiently if the information in the past and present of the yj process is taken
VIX as an endogenous variable is unlikely to yield information about its into account, then yj,t is said to cause yi,t in Granger’s sense. See Lutkepol [54], pp.
comovement with the remaining variables. 41–42.
Frontiers in Physics | www.frontiersin.org 12 May 2022 | Volume 10 | Article 864207You can also read