2019 The Most Challenging Places to Live With ASTHMA - Asthma and Allergy Foundation
←
→
Page content transcription
If your browser does not render page correctly, please read the page content below

2019
The Most Challenging Places
to Live With ASTHMA

      8201 Corporate Drive • Suite 1000 • Landover, MD 20785 • 202-466-7643 • aafa.org
Working Together to Reduce the Impact
of Asthma in Communities Nationwide
A Message From AAFA
Ten people die every day from asthma. That is 10 too many. Most asthma-related deaths are
preventable with proper management, access to adequate medical care, housing improvements
and better air quality. Asthma is one of the most prevalent chronic diseases in our nation.

The Asthma and Allergy Foundation of America (AAFA) publishes the Asthma Capitals™ report
each year to raise awareness about the nationwide impacts of asthma and to help people who live
in Asthma Capitals recognize, prevent and manage asthma symptoms. The report analyzes data
from across the continental United States and ranks the 100 largest cities where it is challenging
to live with asthma.

The report ranks cities by the most critical of health outcomes – asthma prevalence, emergency
department visits due to asthma attacks and asthma mortality. The report also identifies risk
factors that influence the health outcomes.

AAFA will use this report to identify communities where disparities in outcomes exist – especially
in underserved communities. We will support programs and policies that improve conditions and
promote health equity among low-income or minority populations. We also encourage others to
use this report to help bring progress to the communities that need it most.

We remain committed to helping reduce asthma rates, asthma deaths and the burden of this
disease on people and communities. However, a single person or organization cannot tackle the
burden of asthma alone. It will take multiple stakeholders working harmoniously with a shared
goal to improve outcomes.

At the end of this year’s report, we’ve offered some steps that can be taken by patients, caregivers,
health officials, legislators, insurers and pharmaceutical companies to help address the burden
of asthma.

Working together, we can improve communities, make a difference to reduce unnecessary loss of
life, and improve the quality of life for children and adults with asthma.

Sincerely,

Kenneth Mendez, President and CEO
Melanie Carver, Vice President of Community Health and Services

                                                                                                                2
                                                        2019                              asthmacapitals.com
                                                                    ©2019 Asthma and Allergy Foundation of America
Table of Contents
Background and Introduction.  .  .  .  .  .  .  .  .  .  .  .  .  .  .  .  .  .  .  .  .  .  .  .  .  .  .  .  .  .  .  .  .  .  .  .  .  .  .  .  4

The Top 20 Most Challenging Places to Live With Asthma .  .  .  .  .  .  .  .  .  .  .  .  .  .  .  .  .  .  .  .  .  .  .  5

Chart: The Top 100 Most Challenging Places to Live With Asthma .  .  .  .  .  .  .  .  .  .  .  .  .  .  .  .  .  .  . 6

Asthma Health Outcomes.  .  .  .  .  .  .  .  .  .  .  .  .  .  .  .  .  .  .  .  .  .  .  .  .  .  .  .  .  .  .  .  .  .  .  .  .  .  .  .  .  . 10
   Estimated Asthma Prevalence .  .  .  .  .  .  .  .  .  .  .  .  .  .  .  .  .  .  .  .  .  .  .  .  .  .  .  .  .  .  .  .  .  .  .  .  . 10
   Emergency Department Visits .  .  .  .  .  .  .  .  .  .  .  .  .  .  .  .  .  .  .  .  .  .  .  .  .  .  .  .  .  .  .  .  .  .  .  .  .  12
   Asthma-Related Mortality.  .  .  .  .  .  .  .  .  .  .  .  .  .  .  .  .  .  .  .  .  .  .  .  .  .  .  .  .  .  .  .  .  .  .  .  .  .  .  .  13

Risk Factors That Can Worsen Asthma or Influence Asthma Rates .  .  .  .  .  .  .  .  .  .  .  .  .  .  .  .  .  .  17
    Poverty .  .  .  .  .  .  .  .  .  .  .  .  .  .  .  .  .  .  .  .  .  .  .  .  .  .  .  .  .  .  .  .  .  .  .  .  .  .  .  .  .  .  .  .  .  .  .  .  .  .  17
    Lack of Health Insurance .  .  .  .  .  .  .  .  .  .  .  .  .  .  .  .  .  .  .  .  .  .  .  .  .  .  .  .  .  .  .  .  .  .  .  .  .  .  .  . 20
    Poor Air Quality .  .  .  .  .  .  .  .  .  .  .  .  .  .  .  .  .  .  .  .  .  .  .  .  .  .  .  .  .  .  .  .  .  .  .  .  .  .  .  .  .  .  .  .  .  21
    Pollen .  .  .  .  .  .  .  .  .  .  .  .  .  .  .  .  .  .  .  .  .  .  .  .  .  .  .  .  .  .  .  .  .  .  .  .  .  .  .  .  .  .  .  .  .  .  .  .  .  .  . 24
    Asthma Quick-Relief Medicine Use .  .  .  .  .  .  .  .  .  .  .  .  .  .  .  .  .  .  .  .  .  .  .  .  .  .  .  .  .  .  .  .  .  . 26
    Asthma Long-Term Controller Medicine Use.  .  .  .  .  .  .  .  .  .  .  .  .  .  .  .  .  .  .  .  .  .  .  .  .  .  .  .  . 27
    Smoking Laws .  .  .  .  .  .  .  .  .  .  .  .  .  .  .  .  .  .  .  .  .  .  .  .  .  .  .  .  .  .  .  .  .  .  .  .  .  .  .  .  .  .  .  .  .  . 28
    Access to Specialists.  .  .  .  .  .  .  .  .  .  .  .  .  .  .  .  .  .  .  .  .  .  .  .  .  .  .  .  .  .  .  .  .  .  .  .  .  .  .  .  .  .  . 29

Regional Focus.  .  .  .  .  .  .  .  .  .  .  .  .  .  .  .  .  .  .  .  .  .  .  .  .  .  .  .  .  .  .  .  .  .  .  .  .  .  .  .  .  .  .  .  .  .  .  . 30
   Northeast Mid-Atlantic Asthma Belt.  .  .  .  .  .  .  .  .  .  .  .  .  .  .  .  .  .  .  .  .  .  .  .  .  .  .  .  .  .  .  .  .  .30
   Ohio Valley Asthma Belt.  .  .  .  .  .  .  .  .  .  .  .  .  .  .  .  .  .  .  .  .  .  .  .  .  .  .  .  .  .  .  .  .  .  .  .  .  .  .  .  .  31
   Springfield, Massachusetts – #1 Asthma Capital for 2019.  .  .  .  .  .  .  .  .  .  .  .  .  .  .  .  .  .  .  .  .  . 33

What Can Be Done.  .  .  .  .  .  .  .  .  .  .  .  .  .  .  .  .  .  .  .  .  .  .  .  .  .  .  .  .  .  .  .  .  .  .  .  .  .  .  .  .  .  .  .  .  . 37
  Federal, State and Local Health Officials .  .  .  .  .  .  .  .  .  .  .  .  .  .  .  .  .  .  .  .  .  .  .  .  .  .  .  .  .  .  . 37
  Health Care Providers .  .  .  .  .  .  .  .  .  .  .  .  .  .  .  .  .  .  .  .  .  .  .  .  .  .  .  .  .  .  .  .  .  .  .  .  .  .  .  .  .  . 38
  People With Asthma and Parents of Children With Asthma .  .  .  .  .  .  .  .  .  .  .  .  .  .  .  .  .  .  .  . 39
  Health Insurance Companies .  .  .  .  .  .  .  .  .  .  .  .  .  .  .  .  .  .  .  .  .  .  .  .  .  .  .  .  .  .  .  .  .  .  .  .  .  . 39
  Drug (Pharmaceutical) Companies .  .  .  .  .  .  .  .  .  .  .  .  .  .  .  .  .  .  .  .  .  .  .  .  .  .  .  .  .  .  .  .  .  . 40

Methodology .  .  .  .  .  .  .  .  .  .  .  .  .  .  .  .  .  .  .  .  .  .  .  .  .  .  .  .  .  .  .  .  .  .  .  .  .  .  .  .  .  .  .  .  .  .  .  .  . 41

Acknowledgements .  .  .  .  .  .  .  .  .  .  .  .  .  .  .  .  .  .  .  .  .  .  .  .  .  .  .  .  .  .  .  .  .  .  .  .  .  .  .  .  .  .  .  .  . 42

Resources.  .  .  .  .  .  .  .  .  .  .  .  .  .  .  .  .  .  .  .  .  .  .  .  .  .  .  .  .  .  .  .  .  .  .  .  .  .  .  .  .  .  .  .  .  .  .  .  .  .  . 42

                                                                                                                                                                        3
                                                                                             2019                                     asthmacapitals.com
                                                                                                                ©2019 Asthma and Allergy Foundation of America
Background and Introduction
Breathing is life’s most basic, essential function. For most, it happens naturally without a second
thought. But for the more than 26 million people in the United States with asthma, breathing is not
something they take for granted.

Many factors come together to increase the risk for someone to be diagnosed with asthma.
Genetics, respiratory infections, tobacco smoke and more all play a part. But can your location
increase your risk? Can the city you live in create challenges that make asthma harder to control?

AAFA’s 2019 Asthma Capitals™ report looks at factors in cities across the continental U.S. that
contribute to asthma rates and management. We ranked the cities based on these health
outcomes: prevalence, emergency department visits and mortality. We also looked at risk
factors that contribute to these outcomes. Risk factors include: poverty, air quality, access to
specialists, pollen counts, medicine use, tobacco policies and the rate of uninsured residents.

In this report, we review these outcomes and risk factors. We also highlight two regions with
a surprising number of cities in the top 20 Asthma Capitals™ – the Northeast Mid-Atlantic Belt
and the Ohio Valley Belt.

As we encourage proper asthma education and treatment, we also need to look at other ways
to improve quality of life for Americans with asthma. This can only happen through a combined
effort from researchers, health care providers, federal and state policy makers and local stakeholders
to improve our communities.

The goal of this report is to accelerate action to improve asthma prevalence and care in our nation,
especially in these top cities. This data shows where to focus efforts to create healthier environments
and communities to bring down asthma rates and deaths.

The 2019 Asthma Capitals™ report is an independent research project of the Asthma and Allergy
Foundation of America with sponsorship from Sanofi Genzyme and Regeneron.

    ABOUT THE ASTHMA AND ALLERGY FOUNDATION OF AMERICA
    Celebrating more than 65 years of service, AAFA is the oldest and largest nonprofit
    patient organization for asthma and allergies. Its mission is to save lives and reduce
    the burden of disease for people with asthma and allergies through support, advocacy,
    education and research. AAFA provides community-based services through its digital
    communities and network of local chapters and support groups. AAFA educates patients
    with practical information about disease management. AAFA also helps consumers
    identify products suitable for those with asthma and allergies through the asthma &
    allergy friendly® Certification Program. For more information, visit aafa.org.

                                                                                                                 4
                                                         2019                              asthmacapitals.com
                                                                     ©2019 Asthma and Allergy Foundation of America
The Top 20 Most Challenging Places
to Live With Asthma

                                                                                                                        8
                                                                                                                 1
                                                                                                                13 11
                                                                    10
                                                                                        5                  64
                                                                                        14
                                                                                                       19
                                                  9                                 2 16
                                                                                  18
                                                                                                      12
                                                                              7
                                                               17
                                                                                               20 3

                                                                    15

These are the top 20 Asthma Capitals based on estimated asthma prevalence, emergency
department visits due to asthma and asthma-related fatalities. The full list of top 100 cities
can be found on page 6 in this report.

 1. Springfield, Massachusetts                       11. New Haven, Connecticut
 2. Dayton, Ohio                                    12. Richmond, Virginia
 3. Greensboro, North Carolina                      13. Hartford, Connecticut
 4. Philadelphia, Pennsylvania                     14. Akron, Ohio
 5. Cleveland, Ohio                                 15. Jackson, Mississippi
 6. Allentown, Pennsylvania                        16. Columbus, Ohio
 7. Louisville, Kentucky                            17. St. Louis, Missouri
 8. Boston, Massachusetts                           18. Cincinnati, Ohio
 9. Omaha, Nebraska                                 19. Baltimore, Maryland
10. Milwaukee, Wisconsin                           20. Winston-Salem, North Carolina

                                                                                                                5
                                                       2019                               asthmacapitals.com
                                                                    ©2019 Asthma and Allergy Foundation of America
The Top 100 Most Challenging Places
                    to Live With Asthma
NATIONAL RANKINGS                        ■ Worse Than Average         ▲Average            ● Better Than Average
(Factors are not weighted equally)

                                                                              Subtotal:      Subtotal:
      2019                                                                                                   Subtotal:
                                                              Total Score    Estimated         Crude
    National           Overall            Metropolitan Area                                                  ER Visits
                                                              (Avg. 71.58)     Asthma       Death Rate
    Rankings                                                                                                for Asthma
                                                                             Prevalence     for Asthma

        1                 ■          Springfield, MA          100.00             ■               ▲               ■
        2                 ■          Dayton, OH               97.53              ▲               ▲               ■
        3                 ■          Greensboro, NC           88.39              ▲               ▲               ■
        4                 ■          Philadelphia, PA         87.49              ■               ■               ■
        5                 ■          Cleveland, OH            86.78              ▲               ▲               ■
        6                 ■          Allentown, PA            85.00              ■               ▲               ■
        7                 ■          Louisville, KY           84.91              ■               ▲               ■
        8                 ■          Boston, MA               84.74              ■               ■               ▲
        9                 ■          Omaha, NE                84.52              ▲               ■               ■
       10                 ■          Milwaukee, WI            84.44              ▲               ■               ■
        11                ■          New Haven, CT            84.33              ■               ▲               ▲
       12                 ■          Richmond, VA             83.87              ▲               ■               ■
       13                 ■          Hartford, CT             83.24              ■               ▲               ■
       14                 ■          Akron, OH                83.22              ▲               ▲               ■
       15                 ■          Jackson, MS              83.14              ●               ■               ▲
       16                 ■          Columbus, OH             82.88              ▲               ▲               ■
       17                 ■          St. Louis, MO            82.82              ▲               ■               ▲
       18                 ■          Cincinnati, OH           82.77              ▲               ▲               ■
       19                 ■          Baltimore, MD            81.77              ▲               ▲               ■
       20                 ▲          Winston-Salem, NC        81.27              ▲               ■               ■
       21                 ▲          Chattanooga, TN          81.12              ■               ●               ▲
       22                 ▲          Greenville, SC           79.88              ▲               ▲               ■
       23                 ▲          Detroit, MI              79.80              ■               ■               ●
       24                 ▲          Buffalo, NY              79.44              ▲               ▲               ■
       25                 ▲          Birmingham, AL           79.00              ■               ▲               ▲
       26                 ▲          New Orleans, LA          78.97              ▲               ▲               ■
       27                 ▲          Albuquerque, NM          78.60              ■               ▲               ▲
       28                 ▲          Washington, DC           78.23              ▲               ■               ▲
       29                 ▲          Memphis, TN              78.19              ■               ■               ●
       30                 ▲          Worcester, MA            78.18              ■               ▲               ▲
       31                 ▲          Wichita, KS              77.76              ▲               ▲               ■
       32                 ▲          Oklahoma City, OK        77.42              ▲               ▲               ▲

                                                                                                                         6
                                                               2019                                asthmacapitals.com
                                                                             ©2019 Asthma and Allergy Foundation of America
NATIONAL RANKINGS                        ■ Worse Than Average         ▲Average            ● Better Than Average
(Factors are not weighted equally)

                                                                              Subtotal:      Subtotal:
      2019                                                                                                   Subtotal:
                                                              Total Score    Estimated         Crude
    National           Overall            Metropolitan Area                                                  ER Visits
                                                              (Avg. 71.58)     Asthma       Death Rate
    Rankings                                                                                                for Asthma
                                                                             Prevalence     for Asthma

       33                 ▲          Charleston, SC           77.30              ▲               ▲               ■
       34                 ▲          Columbia, SC             77.23              ▲               ■               ▲
       35                 ▲          Toledo, OH               77.12              ▲               ▲               ▲
       36                 ▲          Chicago, IL              75.94              ▲               ■               ▲
       37                 ▲          Tulsa, OK                75.67              ▲               ▲               ▲
       38                 ▲          Spokane, WA              74.80              ▲               ■               ▲
       39                 ▲          New York, NY             74.35              ▲               ■               ●
       40                 ▲          Phoenix, AZ              74.28              ▲               ▲               ▲
       41                 ▲          Kansas City, MO          74.24              ▲               ▲               ▲
       42                 ▲          Bridgeport, CT           74.22              ■               ▲               ●
       43                 ▲          Nashville, TN            73.99              ■               ▲               ●
       44                 ▲          Albany, NY               73.71              ▲               ▲               ▲
       45                 ▲          Stockton, CA             73.58              ▲               ▲               ■
       46                 ▲          Tucson, AZ               73.25              ▲               ▲               ▲
       47                 ▲          Virginia Beach, VA       72.75              ▲               ▲               ■
       48                 ▲          Indianapolis, IN         72.73              ▲               ▲               ▲
       49                 ▲          Sacramento, CA           72.65              ▲               ■               ▲
       50                 ▲          Scranton, PA             72.41              ■               ▲               ●
       51                 ▲          Syracuse, NY             72.22              ▲               ▲               ▲
       52                 ▲          Modesto, CA              71.95              ▲               ▲               ▲
       53                 ▲          Harrisburg, PA           71.92              ■               ▲               ●
       54                 ▲          Pittsburgh, PA           71.13              ■               ▲               ●
       55                 ▲          Boise, ID                70.73              ▲               ▲               ▲
       56                 ▲          Little Rock, AR          70.40              ▲               ▲               ▲
       57                 ▲          Rochester, NY            70.33              ▲               ●               ▲
       58                 ▲          Durham, NC               70.20              ▲               ●               ▲
       59                 ▲          Las Vegas, NV            69.69              ●               ●               ■
       60                 ▲          Des Moines, IA           69.69              ●               ●               ■
       61                 ▲          Knoxville, TN            69.05              ■               ▲               ●
       62                 ▲          Grand Rapids, MI         68.83              ■               ●               ●
       63                 ▲          Denver, CO               68.49              ▲               ▲               ▲
       64                 ▲          Seattle, WA              67.86              ▲               ▲               ▲
       65                 ▲          Providence, RI           67.71              ■               ●               ●
       66                 ▲          Madison, WI              67.52              ▲               ●               ▲
       67                 ▲          Jacksonville, FL         67.27              ●               ▲               ▲

                                                                                                                         7
                                                               2019                                asthmacapitals.com
                                                                             ©2019 Asthma and Allergy Foundation of America
NATIONAL RANKINGS                       ■ Worse Than Average         ▲Average            ● Better Than Average
(Factors are not weighted equally)

                                                                             Subtotal:      Subtotal:
      2019                                                                                                  Subtotal:
                                                             Total Score    Estimated         Crude
    National           Overall           Metropolitan Area                                                  ER Visits
                                                             (Avg. 71.58)     Asthma       Death Rate
    Rankings                                                                                               for Asthma
                                                                            Prevalence     for Asthma

       68                 ▲          Atlanta, GA             67.16              ▲               ▲               ●
       69                 ▲          Salt Lake City, UT      66.56              ●               ▲               ▲
       70                 ▲          Raleigh, NC             66.26              ▲               ●               ▲
       71                 ▲          Fresno, CA              65.96              ▲               ■               ▲
       72                 ▲          Portland, OR            65.78              ▲               ▲               ●
       73                 ▲          San Francisco, CA       65.51              ▲               ●               ▲
       74                 ▲          Charlotte, NC           65.09              ▲               ●               ●
       75                 ▲          Colorado Springs, CO    64.51              ▲               ▲               ▲
       76                 ▲          Dallas, TX              64.51              ●               ▲               ▲
       77                 ▲          Austin, TX              64.50              ●               ●               ▲
       78                 ▲          Oxnard, CA              62.45              ▲               ▲               ▲
       79                 ●          Bakersfield, CA         61.28              ▲               ▲               ▲
       80                 ●          San Diego, CA           61.20              ▲               ●               ▲
       81                 ●          Augusta, GA             60.31              ▲               ●               ▲
       82                 ●          Riverside, CA           60.30              ▲               ●               ▲
       83                 ●          Tampa, FL               60.03              ●               ●               ▲
       84                 ●          Baton Rouge, LA         59.08              ▲               ●               ●
       85                 ●          Orlando, FL             58.98              ●               ▲               ▲
       86                 ●          Lakeland, FL            58.92              ●               ●               ▲
       87                 ●          Minneapolis, MN         58.48              ●               ▲               ●
       88                 ●          Ogden, UT               58.05              ●               ■               ●
       89                 ●          Miami, FL               57.96              ●               ▲               ▲
       90                 ●          Los Angeles, CA         57.62              ▲               ▲               ●
       91                 ●          Provo, UT               57.41              ●               ■               ●
       92                 ●          Palm Bay, FL            56.83              ●               ▲               ▲
       93                 ●          San Jose, CA            56.28              ▲               ▲               ●
       94                 ●          San Antonio, TX         55.95              ▲               ●               ●
       95                 ●          El Paso, TX             54.71              ▲               ●               ●
       96                 ●          Daytona Beach, FL       54.17              ●               ●               ●
       97                 ●          Sarasota, FL            54.11              ●               ●               ▲
       98                 ●          Houston, TX             53.11              ●               ●               ●
       99                 ●          McAllen, TX             50.79              ▲               ●               ●
      100                 ●          Cape Coral, FL          49.22              ●               ▲               ●

                                                                                                                        8
                                                              2019                                asthmacapitals.com
                                                                            ©2019 Asthma and Allergy Foundation of America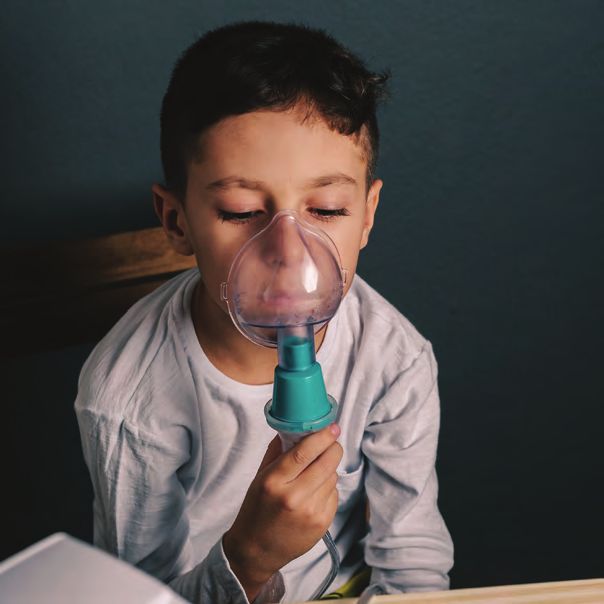
REGIONAL RANKINGS ■ Worse Than Average ▲Average ● Better Than Average
(Factors are not weighted equally)
NORTHEAST
Subtotal: Subtotal:
2019 2019 Subtotal:
Total Score Estimated Crude
Regional Overall National Metropolitan Area ER Visits
(Avg. 71.58) Asthma Death Rate
Rankings Ranking for Asthma
Prevalence for Asthma
1 ■ 1 Springfield, MA 100.00 ■ ▲ ■
2 ■ 4 Philadelphia, PA 87.49 ■ ■ ■
3 ■ 6 Allentown, PA 85.00 ■ ▲ ■
4 ■ 8 Boston, MA 84.74 ■ ■ ▲
5 ■ 11 New Haven, CT 84.33 ■ ▲ ▲
SOUTH
Subtotal: Subtotal:
2019 2019 Subtotal:
Total Score Estimated Crude
Regional Overall National Metropolitan Area ER Visits
(Avg. 71.58) Asthma Death Rate
Rankings Ranking for Asthma
Prevalence for Asthma
1 ■ 3 Greensboro, NC 88.39 ▲ ▲ ■
2 ■ 7 Louisville, KY 84.91 ■ ▲ ■
3 ■ 12 Richmond, VA 83.87 ▲ ■ ■
4 ■ 15 Jackson, MS 83.14 ● ■ ▲
5 ■ 19 Baltimore, MD 81.77 ▲ ▲ ■
MIDWEST
Subtotal: Subtotal:
2019 2019 Subtotal:
Total Score Estimated Crude
Regional Overall National Metropolitan Area ER Visits
(Avg. 71.58) Asthma Death Rate
Rankings Ranking for Asthma
Prevalence for Asthma
1 ■ 2 Dayton, OH 97.53 ▲ ▲ ■
2 ■ 5 Cleveland, OH 86.78 ▲ ▲ ■
3 ■ 9 Omaha, NE 84.52 ▲ ■ ■
4 ■ 10 Milwaukee, WI 84.44 ▲ ■ ■
5 ■ 14 Akron, OH 83.22 ▲ ▲ ■
WEST
Subtotal: Subtotal:
2019 2019 Subtotal:
Total Score Estimated Crude
Regional Overall National Metropolitan Area ER Visits
(Avg. 71.58) Asthma Death Rate
Rankings Ranking for Asthma
Prevalence for Asthma
1 ▲ 27 Albuquerque, NM 78.60 ■ ▲ ▲
2 ▲ 38 Spokane, WA 74.80 ▲ ■ ▲
3 ▲ 40 Phoenix, AZ 74.28 ▲ ▲ ▲
4 ▲ 45 Stockton, CA 73.58 ▲ ▲ ■
5 ▲ 46 Tucson, AZ 73.25 ▲ ▲ ▲
9
2019 asthmacapitals.com
©2019 Asthma and Allergy Foundation of America
Asthma
                 Asthma Health
                        Health Outcomes
                               Outcomes

We ranked cities based on three health outcomes: asthma prevalence, asthma-related emergency
department visits and asthma-related mortality rates. The outcomes were not weighted equally.

ESTIMATED ASTHMA PREVALENCE
More than 26 million people living in the United States have asthma. Factors such as gender, race/
ethnicity and socioeconomic status are associated with asthma, with the disease being more
common in boys than girls in childhood. In adulthood, it reverses and more women than men have
asthma. Non-Hispanic black people and Puerto Ricans are also more likely to have the disease than
non-Hispanic white people.1

About 20.3 million adults currently have asthma. Adults are nearly five times more likely to die from
asthma than children.1

The cities with the highest estimated asthma prevalence are:

   Asthma                                            Overall
  Prevalence                                     Asthma Capital
                      Metropolitan Area
   Ranking                                          National
     (*Tie)                                         Ranking

       1         Albuquerque, NM                      27
       2         Louisville, KY                        7
       3         Nashville, TN                        43
       4*        Chattanooga, TN                       21
       4*        Knoxville, TN                         61
       6         Memphis, TN                          29
       7         Bridgeport, CT                       42
       8         New Haven, CT                         11
       9         Hartford, CT                          13
      10         Birmingham, AL                       25
                                                                   Albuquerque, NM

Asthma prevalence data often relies on self-report, and prevalence comparisons between cities
and/or states may not be reliable due to differences in data collection methods and reporting.
Data limitations should be considered when comparing different cities to each other, or with
year-over-year comparisons.

1. C
    DC - Asthma - Most Recent Asthma Data. (2018, May 15).
   Retrieved March 27, 2019, from https://www.cdc.gov/asthma/most_recent_data.htm

                                                                                                                         10
                                                                  2019                              asthmacapitals.com
                                                                              ©2019 Asthma and Allergy Foundation of America
Asthma
Asthma Health
Health Outcomes
Outcomes
Asthma can have a significant effect on lifestyle. Many people with asthma go to great lengths
to avoid their asthma triggers and prevent flareups.
Jessica Barber Brown and her son Isaac,
age 11, live about 45 minutes outside of
Louisville, Kentucky (overall #7 on Asthma
Capitals), in Lawrenceburg. Both Jessica and
Isaac have asthma and allergies. Isaac was
diagnosed with asthma and a milk allergy
at age 3 after many trips to the emergency
room with croup and breathing issues. And
his mom, Jessica, was diagnosed with asthma
shortly after him.
“I am basically allergic to Kentucky, which
is inconvenient when you live there,” shared
Jessica. “I am allergic to ragweed and dust
mites – those are my biggest ones. Then colds
and sickness can trigger my asthma as well.”
To manage their asthma, Jessica and Isaac have a plan for everything. They worked with their
allergist to make this plan. “I like breathing so we just kind of figure things out,” she shared. Their
plan includes taking long-term control medicines as prescribed and always having quick-relief
inhalers on hand.
She recommends that everyone with asthma and allergies work with their allergist to plan out
“under what circumstances you need to do x, y or z.” She knows that, “If Isaac is going to his
grandparents, we need to do x. If he is going swimming, we need to do y. And, if he is playing
outside during this time of year, we need to do z.”
Despite all the planning, “with the environmental allergens, and the cold, and the pollen and all the
smells, it feels like a major game of whack-a-mole. And you are just never sure which one you are
going to have to deal with at what time. And whichever one is popping up, you have to deal with
that one as another one surfaces.”
For Jessica and Isaac, their asthma management plan focuses on reducing exposure to triggers
that are harder to control. For Isaac, this means he can play outdoor soccer in the fall, but not in
the spring. “He doesn’t play in the spring because allergens are worse then, and it’s just not good
for him.”
Approximately
8.3%
of people living in the United States have asthma.1
For each city included in the 2019 Asthma Capitals, AAFA obtained an estimated asthma prevalence for the respective
county. The estimates ranged widely from 6.8% to 11.4%.
11
2019 asthmacapitals.com
©2019 Asthma and Allergy Foundation of AmericaAsthma
Asthma Health
Health Outcomes
Outcomes
EMERGENCY DEPARTMENT VISITS
A visit to the emergency department (ED) may be necessary due to an asthma attack.
According to a recent national survey, asthma accounts for 1.7 million visits to the emergency
department yearly, making it one of the top 20 reasons for ED visits.2
It is important to seek medical care right away if you or your child has trouble breathing;
however, unnecessary trips to the ED can be costly. On average, every asthma-related trip
to the ED costs $1,502.3
Effective asthma management may help reduce ED visits and hospitalizations. Knowing and
avoiding asthma triggers, adhering to your medicine and following an Asthma Action Plan are
steps that can improve your overall asthma management. Talk with your doctor to ensure you
understand how to manage your or your child’s asthma.
The Centers for Disease Control and Prevention (CDC) released its Vital Signs report on
pediatric asthma. The findings showed that from 2010-2016 the use of Asthma Action
Plans increased and the number of hospitalizations decreased. During the past 10 years,
asthma-related hospitalizations decreased from 10% to 5%.4
These cities have the highest asthma-related ED visits:
Emergency Overall
Department Asthma Capital
Metropolitan Area
Visits National
Ranking Ranking
1 Dayton, OH 2
2 Springfield, MA 1
3 Greensboro, NC 3
4 Omaha, NE 9
5 Cleveland, OH 5
6 Milwaukee, WI 10
7 Akron, OH 14
8 Richmond, VA 12
9 Columbus, OH 16
10 Greenville, SC 22
Dayton, OH
2. R
ui, P., & Kang, K. (2014). National Hospital Ambulatory Medical Care Survey: 2014 Emergency Department Summary
Tables. Retrieved March 27, 2019, from https://www.cdc.gov/nchs/data/nhamcs/web_tables/2014_ed_web_tables.pdf
3. Wang, T., Srebotnjak, T., Brownell, J., & Hsia, R. Y. (2014). Emergency department charges for asthma-related outpatient
visits by insurance status. Journal of Health Care for the Poor and Underserved, 25(1), 396-405. doi:10.1353/hpu.2014.0051
4. Vital Signs. (2018, February 06). Retrieved March 27, 2019, from https://www.cdc.gov/vitalsigns/childhood-asthma/
For each city included in the 2019 Asthma Capitals, AAFA obtained the total number of ED visits where an asthma ICD 10
code was included in a diagnosis field, for the respective census-designated metropolitan statistical area, or MSA, for 2017.
Analyses included estimating the ED rate per 10,000 asthma patients.
12
2019 asthmacapitals.com
©2019 Asthma and Allergy Foundation of AmericaAsthma
Asthma Health
Health Outcomes
Outcomes
ASTHMA-RELATED MORTALITY
Tragically, asthma can be fatal. In 2015, there were 3,615 deaths attributed to asthma in the U.S.5
This means about 10 people per day lose their life to asthma.
AGE DISPARITY
As people age, their risk of dying from asthma increases. Seniors are more likely to be
underdiagnosed, undertreated and managing multiple health conditions.
ASTHMA-RELATED DEATHS
800
623 646
NUMBER OF DEATHS
700 17.2% 17.9%
600 496 468
13.7%
12.9% 430
500 11.9%
340
400 9.4%
233
300
161 190
5.3%
6.4%
200 4.5%
100 3 25Asthma
Asthma Health
Health Outcomes
Outcomes
To reduce the risk of death from asthma, it is important to:
• Control asthma by taking prescribed medicines and updating care providers if symptoms are
occurring more than twice per week.
• Avoid or reduce exposure to asthma triggers.
• Learn the signs and symptoms of asthma, including early warning signals.
• Have an Asthma Action Plan and take quick action according to the plan.
ON PLAN If you ever feel your life or your child’s life is in danger, seek emergency care immediately.
An Asthma Action Plan can help you know when you are in danger. It uses Red, Yellow and
aafa.org If you are in the Red Zone, it is a medical emergency. AAFA
Green Zones for your symptoms.
has an Asthma Action Plan template you can use to discuss your treatment plan with your
health care provider. Visit aafa.org/actionplan to download it.
cord #: The colors of a traffic light will help
you use your asthma medicines. ASTHMA ACTION
Name:
PLAN
Date: aafa.org
Doctor:
kend
Medical Record #:
The colors of a traffic
light will help
Doctor’s Phone #: Day you use your asthma
Night/Weekend medicines.
Emergency Contact:
GREEN means Go Zone!
GREEN means Go Zone!
Use preventive medicine.
Doctor’s Signature:
YELLOW means Caution
Zone!
Add quick-relief medicine.
Personal Best Peak Flow:
Use preventive medicine.
RED means Danger
Zone!
Get help from a doctor.
GO
Use these daily controll
er medicines:
You have all of these:
• Breathing is good MEDICINE
HOW MUCH HOW OFTEN/WHEN
• No cough or wheeze
Peak flow:
YELLOW means Caution Zone!
• Sleep through
the night from
• Can work & play
to
Add quick-relief medicine. For asthma with exercise,
take:
CAUTION
Continue with green
zone medicine and
You have any of these: add:
• First signs of a cold MEDICINE
RED means Danger Zone!
HOW MUCH HOW OFTEN/ WHEN
• Exposure to known
trigger Peak flow:
• Cough from
• Mild wheeze
Get help from a doctor.
• Tight chest to
• Coughing at night
CALL YOUR ASTHMA
CARE PROVIDER.
DANGER
Take these medicines
and call your doctor
Your asthma is getting now.
worse fast:
• Medicine is not helping MEDICINE
HOW MUCH HOW OFTEN/WHEN
• Breathing is hard Peak flow:
& fast
• Nose opens wide reading
• Trouble speaking below
• Ribs show (in children)
ese daily controller medicines: GET HELP FROM A
Make an appointment
DOCTOR NOW! Your
If you cannot contact
with your asthma care
doctor
your doctor, go directly will want to see you right away. It’s importan
to the emergency room.
provider within two days DO NOT WAIT.
t!
of an ER visit or hospitaliza
tion.
The cities with the most asthma-related deaths are:
MEDICINE HOW MUCH HOW OFTEN/WHEN
Asthma- Overall
Related Asthma Capital
Metropolitan Area
Deaths National
Ranking Ranking
1 Jackson, MS 15
2 Provo, UT 91
3
hma with exercise, take: Boston, MA 8
4 Chicago, IL 36
5 New York, NY 39
6 Spokane, WA 38
nue with green zone medicine and add:
7 Columbia, SC 34
MEDICINE 8 HOW MUCH TN
Memphis, HOW OFTEN/29
WHEN
9 St. Louis, MO 17
10 Detroit, MI 23
Jackson, MS
14
2019 asthmacapitals.com
©2019 Asthma and Allergy Foundation of America
OUR ASTHMA CARE PROVIDER.Asthma
Asthma Health
Health Outcomes
Outcomes
AAFA uses aggregated, multi-year data to calculate death rates. In previous years, more than
10 years of data were used, factoring in asthma-related deaths from over a decade ago. In 2019,
we decided to use data from only 5 years to provide an estimate that only factors in more recent
deaths. This may explain any dramatic changes in ranking from previous years – a new methodology
is being used.
In three of our top 25 Asthma Capitals (also in the top 10 for asthma-related deaths), AAFA has
regional chapters who work diligently to address the asthma crisis in their communities. They offer
special programs, services, education and community outreach to people with asthma.
AAFA New England Chapter AAFA St. Louis Chapter AAFA Michigan Chapter
aafa.org/aafa-new-england-chapter aafa.org/aafa-st-louis-chapter aafa.org/aafa-michigan-chapter
This Is What Laura Would Tell You About Asthma,
If She Could
By Peter DeMarco, Laura’s husband, of Boston,
Massachusetts (overall #8 on Asthma Capitals)
Laura was afraid of heights – so she insisted we
hike the highest mountains. It wasn’t enough for
her to just lift weights at the gym: she had to enter
women’s powerlifting competitions. To land her
dream job at Harvard University, she endured nine
exhausting rounds of interviews.
Laura thrived on challenges, so it’s no surprise
that’s how she approached her asthma. It was just
another challenge she needed to overcome.
I think that is why she decided to walk alone to the
hospital the morning her attack struck. She was
staying only a few blocks away, so she knew she’d
be there in a couple of minutes, faster than calling an Uber. It was 4 a.m., and I wasn’t there, so
maybe she felt embarrassed about waking someone else up to ask for help.
Laura had dealt with asthma for nearly 10 years, so she thought she knew what to expect –
she could almost sense when a heavy pollen day, or extreme humidity, or a very dusty room
might trigger it. When an attack did become severe, we always made it in plenty of time to
an emergency room or to an all-night CVS pharmacy for nebulizer fluid. I would usually have
to prod her to go though; she always thought her attack would subside if we just gave it
another few minutes.
She always believed she could beat it herself.
Laura was so confident that September morning – so sure this would be just “another” attack –
that she threw gym clothes into her backpack, perhaps thinking she could get in an early workout
once she left the hospital. Nevertheless, she must have been so relieved when she reached the
emergency room door.
15
2019 asthmacapitals.com
©2019 Asthma and Allergy Foundation of AmericaAsthma
Asthma Health
Health Outcomes
Outcomes
But Laura did not beat her asthma that morning, because something terrible happened.
Something she could never in her life have anticipated. The hospital door was locked, and
there was no one in sight to let her into the emergency room.
Everything that could have gone wrong for Laura did go wrong that morning. The hospital security
desk was left unattended all night … her 911 distress call was mishandled … those responsible for
finding Laura went to the wrong hospital door. All unexpected. All beyond Laura’s control.
You can read more if you wish in the Boston Globe in a story called “Losing Laura,” which I wrote.
Laura was just 34 years old, and now I am her widowed husband.
I have written this essay for the Asthma and Allergy Foundation of America because Laura can’t
have died for no reason. Her story just has to save someone else’s life.
So this is my message to you – no, this is Laura’s message to you:
Nothing is truly in your control until your asthma
is back under control.
Please, please, please factor in the unexpected.
Make it your mantra. Your inhaler could have a
defective cartridge. You could be stuck in standstill
traffic due to an accident. The hospital door you
try could be locked, with no one in sight. It’s not
about what you know from past attacks. It’s what
you don’t know about the next one.
When an attack strikes, don’t be alone – tell someone
as soon as you can. Don’t be embarrassed to ask
for help or think that by telling someone you are
letting asthma win. Without oxygen, you have
between three and six minutes to live. Telling someone you’re having an attack could save
your life. That is how you beat asthma, by living.
By living.
I wish more than anything in the world that Laura had done that. If only she’d woken up the person she
was staying with. If only she’d dialed 911 the moment her attack turned severe. If only she’d called me.
It has been just over two and a half years since her attack. You cannot imagine what it is like
to lose the person you love to asthma. Tears are falling onto my keyboard as I type this.
So please, remember my wife. Remember Laura Beth Levis. But more importantly, remember
her message.
When an attack strikes, tell someone.
Don’t be alone.
Don’t die alone.
For each city included in the 2019 Asthma Capitals, AAFA obtained the estimated asthma-related crude death rate per
100,000 people for the respective county from 2012-2016. The estimates range from 0.001% to 2.7%.
16
2019 asthmacapitals.com
©2019 Asthma and Allergy Foundation of AmericaRisk Factors That Can Worsen
Asthma or Influence Asthma Rates
A risk factor is any attribute, characteristic or exposure of an individual that increases the
likelihood of developing a disease, like asthma. These are the top risk factors for asthma that
influence the ranking of outcomes for cities in this report:
• Poverty
• Lack of health insurance
• Poor air quality
• Pollen
• Asthma quick-relief medicine use
• Asthma long-term controller medicine use
• Smoking laws
• Access to specialists
POVERTY
Poverty can play a major role in developing asthma and the ability to manage it. This can be
because of poor rental housing, location near highways, not being able to pay for treatment
and more. Many cities on our report have poverty as a top risk factor.
A study by the American College of Allergy, Asthma & Immunology (ACAAI) shows people with
asthma below the poverty line have worse treatment outcomes. “We found that patients who
have asthma and come from lower income households – making less than $50,000 every year –
are one and a half times more likely to see treatment fail. They are also almost twice as likely
to have an asthma exacerbation,” stated first author Juan Carlos Cardet, MD, with Brigham
and Women’s Hospital.7
Asthma can be especially challenging for families living in poverty. Proper asthma management
can be difficult when you are worried about paying for housing, clothing and food. The cost of
care may impact your decision to go to the doctor and pharmacy. A lack of reliable transportation
may influence whether you attend regular health care appointments. If you or your child has asthma
and your financial situation is interfering with asthma management, look for local resources in your
neighborhood that can help. There are free clinics that will treat all patients regardless of their
insurance status or ability to pay.
There are also programs that help cover costs of some medicines, such as:
• State pharmaceutical assistance programs
• Nonprofit programs
• Assistance programs offered by pharmaceutical companies
Visit aafa.org/asthma-assistance for more information.
7. Poverty Widens Gap in Care for Asthma and Allergies | AAAAI. (n.d.). Retrieved May 2, 2019,
from https://www.aaaai.org/about-aaaai/newsroom/news-releases/poverty-asthma-allergies
17
2019 asthmacapitals.com
©2019 Asthma and Allergy Foundation of AmericaRisk Factors That Can Worsen
Asthma or Influence Asthma Rates
Persons living below 100% of the poverty level are more likely to have asthma than those living at
any percentage above the poverty level.8
These cities have the highest rates of poverty:
Overall
Poverty Asthma Capital
Metropolitan Area
Ranking National
Ranking
1 McAllen, TX 99
2 New Orleans, LA 26
3 Philadelphia, PA 4
4 Richmond, VA 12
5 Augusta, GA 81
6 Detroit, MI 23
7 Baltimore, MD 19
8 Bakersfield, CA 79
9 Fresno, CA 71
10 El Paso, TX 95
McAllen, TX
8. CDC - Asthma - Most Recent Asthma Data. (2018, May 15).
Retrieved March 27, 2019, from https://www.cdc.gov/asthma/most_recent_data.htm
18
2019 asthmacapitals.com
©2019 Asthma and Allergy Foundation of AmericaRisk Factors That Can Worsen
Asthma or Influence Asthma Rates
COST OF MANAGING ASTHMA
The cost of managing asthma is steep – both for those with the disease and the nation
as a whole.
$81.9 BILLION $3,266
Annual U.S. economic cost of asthma9 Average cost of asthma per person, per year9
$3 billion
Missed school $176 $105
and work days Outpatient ED visits
visits
$529
Hospitalizations
$29 billion $1,830
Asthma-related $50.3 billion Prescription
deaths Medical costs
medicine
$640
Office visits
The cost of managing asthma can create many financial challenges. Some costs are
expected, such as regular doctor’s visits and prescription medicines. But unexpected
ED visits, hospital stays, and missed work and school put a great burden on those with
asthma and their families. Many are forced to choose between necessary, life-saving
medicine and basic living expenses, such as food.
Controlling indoor air quality can be an added expense, especially if you need equipment
to help reduce allergens and triggers.
“I’ve had to pay for people to cut my grass because I can’t do that, which is very frustrating,”
said Jessica Barber Brown of Louisville, Kentucky (overall #7 on Asthma Capitals). “You
look at the budget and say the budget doesn’t have any room to give. But I end up having to
find places to do that, because it comes down to ‘Am I going to be able to breathe or am I
going to be able to afford groceries?’ Groceries become a moot point when you can’t breathe.”
9. N
urmagambetov T, et al. The Economic Burden of Asthma in the United States, 2008 - 2013. Annals of the American
Thoracic Society: 11 Jan 2018.
For each city included in the 2019 Asthma Capitals, AAFA obtained the poverty rate for the respective county. The estimates
range from 7.5% to 29.5%.
19
2019 asthmacapitals.com
©2019 Asthma and Allergy Foundation of AmericaRisk Factors That Can Worsen
Asthma or Influence Asthma Rates
LACK OF HEALTH INSURANCE
Health care and medicines can be very costly. For patients managing a chronic condition that
requires medicine year-round, like asthma, having insurance is often a big help. However, insurance
itself can also be costly. These costs may vary depending on if you are employed and if your
employer offers health insurance as a benefit and pays any of the costs. Other options include
marketplace health insurance and government-sponsored insurance, like Medicare or Medicaid.
Some states have expanded health insurance options for their residents, while others have not.
There may be local resources in your community to help determine what insurance option is
best for you. Visit HealthCare.gov to get started.
These cities have the highest number of uninsured residents:
Overall
Lack of
Asthma Capital
Insurance Metropolitan Area
National
Ranking Ranking
1 McAllen, TX 99
2 Dallas, TX 76
3 El Paso, TX 95
4 Houston, TX 98
5 Miami, FL 89
6 Cape Coral, FL 100
7 San Antonio, TX 94
8 Tulsa, OK 37
9 Oklahoma City, OK 32
10 Sarasota, FL 97
McAllen, TX
Texas, Florida and Oklahoma have yet to expand their Medicaid programs under the Affordable
Care Act (ACA). Texas is home to the largest number of uninsured Americans of any state in the
country.10 For the millions of uninsured people in these states, this decision has left them without
an option for affordable health insurance.
In our My Life With Asthma survey, we found that the top three reasons people didn’t take their
prescribed asthma treatments were due to not being able to afford the medicines, medicine cost
and the lack of health insurance coverage.
10. Berchick, E. R., Hood, E., & Barnett, J. C. (2018, September). Health Insurance Coverage in the United States: 2017(Rep.).
Retrieved April 11, 2019, from https://www.census.gov/content/dam/Census/library/publications/2018/demo/p60-264.pdf
For each city included in the 2019 Asthma Capitals, AAFA obtained the uninsured rate for the respective county.
The estimates range from 2.8% to 29.7%.
20
2019 asthmacapitals.com
©2019 Asthma and Allergy Foundation of AmericaRisk Factors That Can Worsen
Asthma or Influence Asthma Rates
POOR AIR QUALITY
Air pollution is a mixture of natural and man-made substances in the air we breathe. It is typically
separated into outdoor and indoor pollution.11 Air pollution includes gases, smoke from fires,
volcanic ash, dust particles and other substances that are irritating to the lungs. Research shows
that air pollution can cause and worsen asthma.
Ozone, a gas, is one of the most common air pollutants. Ozone contributes to what we typically
experience as “smog” or haze. It is most common in cities where there are more cars. It is also
more common in the summer when there is more sunlight and low winds. Ozone triggers asthma
because it is irritating to the lungs and airways.
Other forms of air pollution can also trigger asthma. Small particles in the air can pass through
your nose or mouth and get into your lungs. Airborne particles, found in haze, smoke and airborne
dust, present serious air quality problems. People with asthma are at greater risk from breathing in
small particles. The particles can make asthma worse.
Many sources, including local TV weather forecasts, report the expected air quality for the next
day or two. This information can help you know when the air quality may trigger an asthma
episode and allow you to plan accordingly.
These cities all received an F rating
from the American Lung Association’s
2018 “State of the Air Report”:
Overall
Asthma Capital
Metropolitan Area
National
Ranking
Phoenix, AZ 40
Stockton, CA 45
Indianapolis, IN 48
Sacramento, CA 49
Modesto, CA 52
Pittsburgh, PA 54
Salt Lake City, UT 69
Fresno, CA 71
Bakersfield, CA 79
Riverside, CA 82
Ogden, UT 88
Los Angeles, CA 90
Provo, UT 91
Phoenix, AZ
11. N
ational Institute of Environmental Health Sciences. (2018). Air pollution.
Retrieved March 26, 2019, from https://www.niehs.nih.gov/health/topics/agents/air-pollution/index.cfm
21
2019 asthmacapitals.com
©2019 Asthma and Allergy Foundation of AmericaRisk Factors That Can Worsen
Asthma or Influence Asthma Rates
California dominates this list because of wildfires. Smoke from wildfires contains tiny particles that
affect air quality. These particles can irritate your eyes, nose, throat and lungs. Poor air quality can
worsen asthma symptoms. Children and people with respiratory disease like asthma are at high
risk for asthma episodes when the air quality is poor.
Wildfires do not only affect people in the immediate fire area. Smoke can blow many miles away
and impact people hundreds of miles away. Smoke and ash contain harmful particles that can
irritate even healthy lungs. The impact on those with asthma can be serious.
The Environmental Protection Agency (EPA) tracks and reports daily air quality around the
country using the Air Quality Index (AQI). The AQI is a measure of air pollution to indicate
the safety of the air and possible health effects. Those with asthma can watch air quality
on AirNow.gov to help them manage their symptoms.
AQI values are color coded by level of health concern. Green (AQI value of 0-50) means air
quality is good. When the air quality reaches yellow (AQI value of 51-100) or higher, those
who are sensitive to air pollution need to take caution, especially when outside.
Air Quality Index
Levels of Health Concern
Good
Moderate
Unhealthy for Groups
Unhealthy
Very Unhealthy
Hazardous
The Air Quality Index (AQI) shows how clean or polluted the air is, and what associated
health effects could be a concern. Forecasts and current measurements are available
at AirNow.gov
Air pollution is also connected to the development of asthma.12
Asthma rates are higher in polluted areas. Young children are particularly vulnerable when they
live in areas with poor air quality.13
12. G
ehring, U., Wijga, A. H., Hoek, G., Bellander, T., Berdel, D., Brüske, I., . . . Brunekreef, B. (2015). Exposure to air pollution
and development of asthma and rhinoconjunctivitis throughout childhood and adolescence: A population-based birth
cohort study. The Lancet Respiratory Medicine,3(12), 933-942. doi:10.1016/s2213-2600(15)00426-9
13. The Effect of Air Pollution on Lung Development from 10 to 18 Years of Age. (2005). New England Journal of
Medicine,352(12), 1276-1276. doi:10.1056/nejm200503243521230
22
2019 asthmacapitals.com
©2019 Asthma and Allergy Foundation of AmericaRisk Factors That Can Worsen
Asthma or Influence Asthma Rates
This underscores the need to protect the Clean Air Act and enact policies that combat climate
change. As temperatures rise, the risk of wildfires increases, and high-pressure weather systems
trap ozone and other pollutants closer to the ground. Recently, the Environmental Protection
Agency (EPA) disbanded a panel of air pollution experts who were responsible for reviewing
air pollution standards and their impact on health.
Air quality can limit outdoor activities for those with asthma because inflamed lungs are more
sensitive to poor air quality.
Lakia Shavon Lightner of Hartford, Connecticut (overall
#13 on Asthma Capitals), has vivid memories from her
childhood of visits to the emergency room at 2 in the
morning. She has had severe asthma and allergies for as
long as she can remember. She grew up in Hartford, but
now lives in East Hartford, Connecticut.
She believes her asthma is more controlled now, but her
asthma still limits what she can do. “I am limited and it’s
expensive when you suffer from asthma and allergies,” she
shared. “I notice a big difference living in the East Hartford
area. It’s much better than the Hartford area.”
Weather and air quality both create conditions that trigger
Lakia’s asthma.
“What triggers it is pollution, someone smoking around me,”
Lakia said. “Also, the cold weather – that’s a challenge, and also
the summertime. When it’s hot, I’m like a fish without water.
I try to stay in the AC and have a fan around so I can breathe.”
To avoid her asthma triggers, sometimes she wears a mask to help make sure she can breathe
well. But she doesn’t always know when she may run into her triggers.
“I don’t always wear the mask because people don’t always tell you if they smoke or don’t clean
properly. Once I visit someone and get a picture of who they are, then I know if I need to bring
the mask the next time I visit.”
She knows that if she is going to visit friends or family in Hartford, she is going to need her
quick-relief inhaler because of the poor air quality. “The pollution is terrible there,” she shared.
For each city included in the 2019 Asthma Capitals, AAFA obtained scores for high ozone and high particle pollution days for
each respective county. Then AAFA took an “average” of the two measures for the final air quality score.
23
2019 asthmacapitals.com
©2019 Asthma and Allergy Foundation of AmericaRisk Factors That Can Worsen
Asthma or Influence Asthma Rates
POLLEN
Substances that cause allergies (allergens) can trigger asthma. If you inhale something you are
allergic to, you may experience asthma symptoms. Pollen is a common allergen that can cause
allergic asthma (asthma triggered by allergens). An allergist can confirm whether you or your
child have allergies, usually with a skin or blood test.
If pollen is an asthma trigger for you or your child, there are certain actions you can take to
reduce, or minimize, your exposure to pollen. These include:
• Limiting outdoor activities during the hours when pollen counts are high
• Keeping windows closed during pollen season and using CERTIFIED asthma & allergy friendly®
air cleaners and filters on your central air conditioning or HVAC units
• Bathing and shampooing before bed
• Changing and washing clothing after outdoor activities
• Wash bedding in hot, soapy water once a week
• Wear sunglasses and a hat – this will help keep pollen out of your eyes and off your hair
• Limit close contact with pets that spend a lot of time outdoors
• Dry your clothes in a clothes dryer, not on an outdoor line
These cities have the highest estimates of people affected by pollen:
Overall
Pollen
Asthma Capital
Ranking Metropolitan Area
National
(*Tie)
Ranking
1* Springfield, MA 1
1* New Haven, CT 11
1* Hartford, CT 13
1* Bridgeport, CT 42
5* San Antonio, TX 94
5* McAllen, TX 99
7 Richmond, VA 12
8 Syracuse, NY 51
9 Providence, RI 65
10 Memphis, TN 29
Springfield, MA
24
2019 asthmacapitals.com
©2019 Asthma and Allergy Foundation of AmericaRisk Factors That Can Worsen
Asthma or Influence Asthma Rates
High pollen can often send people with allergic asthma indoors.
“Living in this area of North Carolina, we definitely have a lot of trees with pollen,” said Tracy Bush
of Winston-Salem, North Carolina (overall #20 on Asthma Capitals). “Certain times of the year
are worse. I actually have a weather app on my phone that pops up when there are medium
or high levels of pollen. There were certain times of the year where it would affect [my son]
behaviorally. I could tell something was going on. I would tell his teacher every year that about
the end of October or November they’ll be emailing me about his behavioral issues. February,
same thing. Those were certain times of the year when pollen would make him not feel well.”
ALLERGEN CONTROL
Asthma management involves taking medicine and avoiding
your asthma triggers. Your asthma triggers may include
irritants like air pollution or allergens like pollen.
Other allergens can also trigger asthma. Dust mites,
cockroach debris, mouse dander, pet dander and mold can
all trigger asthma. There are things you can do to control
your environment and reduce exposure to allergens and
irritants.
The asthma & allergy friendly® Certification Program sets high
standards and then scientifically tests products to see if they
meet those standards. Only products and services that pass
every test will receive this mark. Learn more at aafa.org/certified.
AAFA also releases annual Allergy Capitals reports for spring and fall allergies.
Visit allergycapitals.com to learn how your city ranks and what
to do if you live in an Allergy Capital and have pollen allergies.
In 2019, McAllen, Texas, ranked #1 on the Spring Allergy Capitals™ report.
Allergy Capitals
Spring 2019
Asthma Capitals and Allergy Capitals (Spring and Fall) use different methodologies, using different
factors (data) for each report. The factors are not weighted equally in the analyses. This may explain
some of the differences in ranking between the Asthma Capitals and Allergy Capitals Reports.
For each city (Designated Market Area) included in the 2019 Asthma Capitals, AAFA obtained a comprehensive index of the
population at risk of being affected by airborne allergenic pollen, derived from actual pollen counts, allergy prevalence for
each pollen type and related factors.
25
2019 asthmacapitals.com
©2019 Asthma and Allergy Foundation of AmericaRisk Factors That Can Worsen
Asthma or Influence Asthma Rates
ASTHMA QUICK-RELIEF MEDICINE USE
Both long-term control medicines (sometimes called “controllers”) and quick-relief medicines
(sometimes called “rescue inhalers”) may be necessary for optimal asthma management.
Quick-relief medicines help relieve asthma symptoms as they are happening. These medicines
act fast to relax tight muscles around your airways. This allows the airways to open up so air
can flow through them. Frequent use of a quick-relief medicine (like an albuterol inhaler) is
an indication there is a high number of asthma episodes.
If you use quick-relief medicines more than two days a week, this is a sign that your asthma is
not under control. Talk with your health care provider about your asthma care plan and if you
need to make changes.
For inhalers to work well they need to be used correctly. But they can be difficult to use and it can
confuse people when their prescriptions change to a different type. More than half of all people
who use inhalers don’t do each step correctly. It is important for patients, nurses and doctors to
learn proper inhaler technique and review inhaler use at every appointment.
Quick-relief medicine use is highest in these cities:
Asthma Overall
Quick-Relief Asthma Capital
Metropolitan Area
Medicine Use National
Ranking Ranking
1 Toledo, OH 35
2 Des Moines, IA 60
3 Dayton, OH 2
4 Milwaukee, WI 10
5 Fresno, CA 71
6 Cleveland, OH 5
7 Syracuse, NY 51
8 Tampa, FL 83
9 Akron, OH 14
10 Springfield, MA 1
Toledo, OH
For each city included in the 2019 Asthma Capitals, AAFA obtained the number of quick-relief medicine prescriptions per
patient prevalence, for a recent 12-month period, for the MSA.
26
2019 asthmacapitals.com
©2019 Asthma and Allergy Foundation of AmericaRisk Factors That Can Worsen
Asthma or Influence Asthma Rates
ASTHMA LONG-TERM CONTROLLER MEDICINE USE
Both controller and quick-relief medicines may be necessary for optimal asthma management.
Controller medicines help prevent and control asthma symptoms. You may need to take this type
of medicine every day for best results. There are several kinds of controller medicines, including
inhaled corticosteroids (ICS). ICS medicines prevent and reduce airway swelling, as well as reduce
mucus in the lungs. Combination inhaled medicines combine ICS with a long-acting beta agonist
(LABA). LABAs open the airways by relaxing the smooth muscles around the airways. Other types
of controller medicines include biologics or leukotriene modifiers. Always work with your doctor
to determine which medicine is best for you or your child.
Asthma controller medicines are prescribed for persistent cases of asthma. A high number of
these prescriptions may indicate that a city’s residents have more severe or uncontrolled cases
of asthma.
These cities have the highest rates of asthma controller medicine use:
Asthma
Overall
Long-Term
Asthma Capital
Controller Metropolitan Area
National
Medicine Use Ranking
Ranking
1 Jackson, MS 15
2 Toledo, OH 35
3 Omaha, NE 9
4 Louisville, KY 7
5 Chattanooga, TN 21
6 Dayton, OH 2
7 Greenville, SC 22
8 Tampa, FL 83
9 Knoxville, TN 61
10 Des Moines, IA 60
Jackson, MS
For people with persistent asthma, controller medicines are essential to keeping symptoms
under control. But they must be used regularly and consistently.
"I use [my long-term control medicine] every day in order to keep from wheezing and becoming
short of breath," shared Sharon B. of Richmond, Virginia (overall #12 on Asthma Capitals).
"As long as I take my medication, I don't have any attacks. But I will certainly have one, if
I don't take it within 48 hours."
For each city included in the 2019 Asthma Capitals, AAFA obtained the number of controller medicine prescriptions per
patient prevalence, for a recent 12-month period, for the MSA.
27
2019 asthmacapitals.com
©2019 Asthma and Allergy Foundation of AmericaRisk Factors That Can Worsen
Asthma or Influence Asthma Rates
SMOKING LAWS
According to the CDC, smoking is the leading cause of preventable death in the U.S.14 Smoking
is not only harmful to the person doing the smoking but also to those nearby who inhale
secondhand smoke or come into contact with thirdhand smoke. Many chemicals and
substances in secondhand and thirdhand smoke can irritate the lungs and airways.
Secondhand smoke refers to smoke that is released in the air when a smoker exhales, as well as
smoke released from a burning cigarette, cigar or pipe.
Thirdhand smoke is residue from tobacco smoke. When a cigarette is smoked, chemicals in the
smoke stick to surfaces and dust for months after the smoke is gone. The chemicals in the residue
then react to other pollutants in the air, like ozone, to create harmful particles you can easily inhale.15
Many state and local jurisdictions have passed laws that prohibit smoking in some places. These
may include workplaces, restaurants, hotels, parks and transit systems. Research your state or
county to see what the laws are in your area.
These cities do the least to protect their residents
and visitors from tobacco smoke and have What can cities do to help protect people
fewer smoke-free laws, comparatively: from the harmful effects of tobacco smoke?
Strengthen protection for residents by
Overall
Asthma Capital making additional smoke-free zones (like
Metropolitan Area public parks). Support smoking cessation
National
Ranking programs. Encourage anti-tobacco
campaigns that also teach about the
Atlanta, GA 68 dangers of vaping in schools.
Chattanooga, TN 21
What can states do to help protect people
Memphis, TN 29 from the harmful effects of tobacco smoke?
Oklahoma City, OK 32 Pass clean air laws that create smoke-free
zones for the public. All indoor, public
Tulsa, OK 37
buildings should be smoke-free, and a
Harrisburg, PA 53 buffer near entrances/exits should also be
Knoxville, TN 61 provided (e.g., no smoking within 25 feet of
Nashville, TN 43 a building door or window). Fund smoking
cessation programs.
Virginia Beach, VA 47
14. F
ast Facts and Fact Sheets | Smoking & Tobacco Use | CDC. (n.d.). Retrieved April 26, 2019, from https://www.cdc.gov/
tobacco/data_statistics/fact_sheets/index.htm?s_cid=osh-stu-home-spotlight-001
15. Emerging Evidence and Arguments for a Multidisciplinary Research Agenda. Environmental Health Perspectives, 119(9),
1218–1226. Retrieved March 27, 2019, from https://ehp.niehs.nih.gov/doi/pdf/10.1289/ehp.1103500
For each city included in the 2019 Asthma Capitals, AAFA obtained data on whether there was a 100% smoking ban for cars
with minors, non-hospitality workplaces, restaurants, bars, and multi-unit housing.
28
2019 asthmacapitals.com
©2019 Asthma and Allergy Foundation of AmericaRisk Factors That Can Worsen
Asthma or Influence Asthma Rates
ACCESS TO SPECIALISTS
One of the most important parts of asthma management is working with your health care team
to create a plan that keeps your asthma under control. In addition to a primary care doctor, a
person with asthma might need to be in the care of a specialist. Pulmonologists, allergists and
immunologists, for example, can provide specialized care for people with asthma and may have
more experience treating patients with severe asthma or allergic asthma than a primary care physician.
Access to appropriate medical care is dependent upon different factors, including socioeconomic
status, insurance status, and availability of specialists in nearby locations. The lack of availability of
nearby asthma specialists may be associated with poor asthma outcomes.
These cities have the fewest asthma specialists per asthma patient:
Overall
Fewest
Asthma Capital
Specialists Metropolitan Area
National
Ranking Ranking
1 Riverside, CA 82
2 Virginia Beach, VA 47
3 Ogden, UT 88
4 Modesto, CA 52
5 Bakersfield, CA 79
6 Dallas, TX 76
7 Atlanta, GA 68
8 New York, NY 39
9 Charlotte, NC 74
10 Greensboro, NC 3
Riverside, CA
Living in an area where there are fewer specialists can mean traveling long distances for care.
This can be a burden on personal finances and time, especially when frequent trips are needed.
And it may take months to get an appointment.
WHAT CAN CITIES WHAT CAN STATES
DO TO HELP THIS ISSUE? DO TO HELP THIS ISSUE?
Recruit allergists and Form a task force or asthma coalition
pulmonologists to work to outline how to support asthma
in your city. treatment in your state.
For each city included in the 2019 Asthma Capitals report, AAFA obtained an estimate of the number of certified
pulmonologists vs allergists and immunologists in each city and respective county and selected the largest number.
Then, AAFA calculated the total number of specialists per 10,000 asthma patients.
29
2019 asthmacapitals.com
©2019 Asthma and Allergy Foundation of AmericaYou can also read