Multimodal Imaging Brain Markers in Early Adolescence Are Linked with a Physically Active Lifestyle
←
→
Page content transcription
If your browser does not render page correctly, please read the page content below
The Journal of Neuroscience, 0, 2021 • 00(00):000 • 1

Behavioral/Cognitive

Multimodal Imaging Brain Markers in Early Adolescence
Are Linked with a Physically Active Lifestyle
Piergiorgio Salvan,1 Thomas Wassenaar,1 Catherine Wheatley,1 Nicholas Beale,2 Michiel Cottaar,1 Daniel Papp,1
Matteo Bastiani,1,3,4 Sean Fitzgibbon,1 Euguene Duff,1 Jesper Andersson,1 Anderson M. Winkler,5,6
Gwenaëlle Douaud,1 Thomas E. Nichols,1,7,8 Stephen Smith,1 Helen Dawes,2 and Heidi Johansen-Berg1
1
 Wellcome Centre for Integrative Neuroimaging, FMRIB Centre, Nuffield Department of Clinical Neurosciences, University of Oxford, John Radcliffe Hospital,
Oxford, OX3 9DU, United Kingdom, 2Centre for Movement, Occupational and Rehabilitation Sciences, Oxford Brookes University, Oxford, OX3 0BP, United
Kingdom, 3Sir Peter Mansfield Imaging Centre, School of Medicine, University of Nottingham, Nottingham, NG7 2RD, United Kingdom, 4National Institute
for Health Research Biomedical Research Centre, University of Nottingham, Nottingham, NG7 2UH, United Kingdom, 5Emotion and Development Branch,
National Institute of Mental Health, National Institutes of Health, Bethesda, MD 20892-9663, Maryland, 6Department of Psychiatry, Yale University School of
Medicine, New Haven, CT 06511, Connecticut, 7Oxford Big Data Institute, Li Ka Shing Centre for Health Information and Discovery, Nuffield
Department of Population Health, University of Oxford, Oxford, OX3 7LF, United Kingdom, and 8Department of Statistics, University of Warwick,
Coventry, CV4 7AL, United Kingdom

The World Health Organization promotes physical exercise and a healthy lifestyle as means to improve youth development.
However, relationships between physical lifestyle and human brain development are not fully understood. Here, we asked
whether a human brain–physical latent mode of covariation underpins the relationship between physical activity, fitness, and
physical health measures with multimodal neuroimaging markers. In 50 12-year old school pupils (26 females), we acquired
multimodal whole-brain MRI, characterizing brain structure, microstructure, function, myelin content, and blood perfusion.
We also acquired physical variables measuring objective fitness levels, 7 d physical activity, body mass index, heart rate, and
blood pressure. Using canonical correlation analysis, we unravel a latent mode of brain–physical covariation, independent of
demographics, school, or socioeconomic status. We show that MRI metrics with greater involvement in this mode also
showed spatially extended patterns across the brain. Specifically, global patterns of greater gray matter perfusion, volume,
cortical surface area, greater white matter extra-neurite density, and resting state networks activity covaried positively with
measures reflecting a physically active phenotype (high fit, low sedentary individuals). Showing that a physically active life-
style is linked with systems-level brain MRI metrics, these results suggest widespread associations relating to several biologi-
cal processes. These results support the notion of close brain-body relationships and underline the importance of
investigating modifiable lifestyle factors not only for physical health but also for brain health early in adolescence.
Key words: adolescence; canonical correlation analysis; fitness; lifestyle; multimodal MRI; physical activity

      Significance Statement
      An active lifestyle is key for healthy development. In this work, we answer the following question: How do brain neuroimag-
      ing markers relate with young adolescents’ level of physical activity, fitness, and physical health? Combining advanced whole-
      brain multimodal MRI metrics with computational approaches, we show a robust relationship between physically active
      lifestyles and spatially extended, multimodal brain imaging-derived phenotypes. Suggesting a wider effect on brain neuroi-
      maging metrics than previously thought, this work underlies the importance of studying physical lifestyle, as well as other
      brain–body relationships in an effort to foster brain health at this crucial stage in development.

Received May 4, 2020; revised Sep. 10, 2020; accepted Oct. 10, 2020.
                                                                                                                             Collett, Thomas Smejka, Jack Possee, Oliver Bushnell, Eneid Leika, and Cyrus Goodger for help with data
    Author contributions: P.S., T.W., H.D., and H.J.-B. designed research; P.S., T.W., C.W., and N.B. performed research;
                                                                                                                             collection; and all of the pupils, and their parents, who took part in, and fully engaged with, each aspect of
P.S., T.W., and C.W. analyzed data; P.S. wrote the first draft of the paper; P.S. and H.J.-B. wrote the paper; T.W., C.W.,
                                                                                                                             this brain imaging substudy.
N.B., M.C., D.P., M.B., S.F., E.D., J.A., A.M.W., G.D., T.E.N., S.S., H.D., and H.J.-B. edited the paper.
                                                                                                                                 The authors declare no competing financial interests.
    Fit to Study was supported by the Education Endowment Foundation and Wellcome Trust Education and
Neuroscience Program Grant 2681. H.J.-B. was supported by Wellcome Trust 110027/Z/15/Z and Oxford                               Correspondence should be addressed to Piergiorgio Salvan at piergiorgio.salvan@ndcn.ox.ac.uk.
National Institute for Health Research Biomedical Research Center. G.D. was supported by the United Kingdom                     https://doi.org/10.1523/JNEUROSCI.1260-20.2020
Medical Research Council MR/K006673/1. T.E.N. was supported by Wellcome Trust 100309/Z/12/Z. The                             Copyright © 2021 Salvan et al.
Wellcome Center for Integrative Neuroimaging was supported by core funding from Wellcome Trust 203139/                           This is an open-access article distributed under the terms of the Creative Commons Attribution License
Z/16/Z. We thank all the Fit to Study investigators (https://www.fit-to-study.org/investigators) for                         Creative Commons Attribution 4.0 International, which permits unrestricted use, distribution and reproduction
contributions to the trial; Emma Eldridge, Emily Plester, Emily Curtis, Andy Meaney, Patrick Esser, Johnny                   in any medium provided that the original work is properly attributed.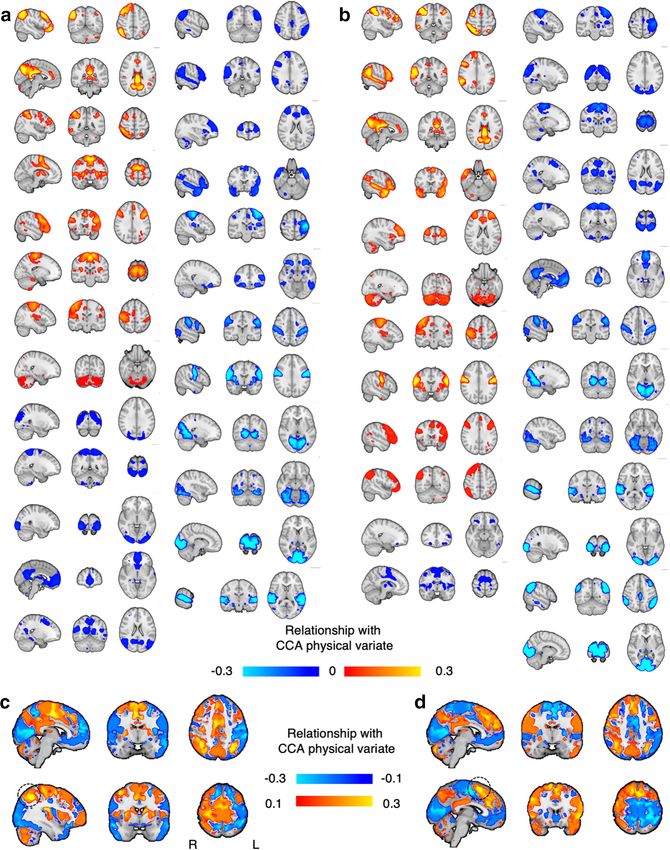
2 • J. Neurosci., 0, 2021 • 00(00):000                                                                       Salvan et al. · Brain–Physical Covariation in Adolescence

Introduction
The World Health Organization encourages early positive life-
style choices aimed to improve both physical and mental health
(World Health Organization, 2010). Physical activity is a power-
ful and rapid means to improve fitness and physical health
throughout the life-span (Cotman, 2002; Hillman et al., 2008).
During adolescence, however, levels of physical activity decline
(Guthold et al., 2020).
    Public health guidelines recommend that school-aged chil-
dren engage in 60 min of moderate-to-vigorous physical activity
daily (Piercy and Troiano, 2018), yet globally only ;22% of boys
and 15% of girls achieve that (Guthold et al., 2020). In addition      Figure 1. Summary of statistical analysis. In order to test the individual covariation
to its importance to physical health, there is growing evidence        between brain IDPs and physical measures of fitness, physical activity and physical health,
that a physically active lifestyle during childhood is associated      we aimed to identify one single mode of covariation using CCA, while taking into account
with improved mental and cognitive health through adulthood            the hierarchical structure represented by schools.
(Department of Health & Human Services Office of Disease
Prevention and Health Promotion, 2000). While there is limited         week time of brief bursts and long-lasting physical activity), and
available evidence in adolescents, similar patterns have been          reported (questionnaire item) and physical health (resting heart
reported (Lubans et al., 2016).                                        rate, blood pressure, and body mass index) (Fig. 1). We hypothe-
    A body of work has studied the relationship between single         sized that, across pupils, intersubject differences in brain pheno-
physical measures of activity, fitness, or body mass, and separate     types covaried with differences in physical lifestyle, independent of
MRI metrics of brain structure, microstructure, or function,           sex, socioeconomic status, age, pubertal level, and school. A single
showing focal neural correlates (for review, see Donnelly et al.,      holistic multivariate analysis allowed us to identify a latent mode
2016; Valkenborghs et al., 2019). However, it is unlikely that a       of covariation between brain and physical phenotypes, represent-
single physical measure fully captures active lifestyles, or that a    ing a pattern of active physical lifestyle features that significantly
single MRI metric fully quantifies the condition of the brain.         covaries with spatially extended patterns of brain metrics.
Rather, lifestyles are better characterized by a range of physical
measures, and the state of the brain is better quantified by com-
binations of metrics.
                                                                       Materials and Methods
    Multimodal MRI can probe different aspects of brain struc-         Participants and recruitment
                                                                       Year 7 pupils from a subset of 10 United Kingdom schools participating
ture and function. While each metric provides an indirect probe
                                                                       in the Fit to Study project Main trial (total 93 schools) were invited to
of the underlying biology, in combination they provide insights        take part in a brain imaging substudy (Wassenaar et al., 2019). The 10
into a range of biological processes (Tardif et al., 2016). Further,   recruitment schools were selected for being conveniently located for
these measures can be acquired simultaneously across the whole         travel to Oxford. Researchers visited recruitment schools to pitch the
brain. Many previous brain imaging studies of physical activity        study to pupils and collected pupils’ expressions of interest. For each
and fitness have focused on the hippocampus, where changes in          school, an upper limit was determined in order not to over-recruit from
noninvasive imaging measures of tissue volume or perfusion             a given school. For schools in which the number of interested pupils
have been argued to relate to processes of neurogenesis and            exceeded this limit, pupils with lower physical activity scores (based on
angiogenesis triggered by exercise (van Praag et al., 1999; Pereira    values already collected through the Main trial) were given priority to
et al., 2007; Chaddock et al., 2011; Thomas et al., 2012).             select a sample that was the most representative as possible of the entire
However, in addition to such focal changes, more global biologi-       population. The expressions of interest, however, varied greatly by
cal processes might also be triggered by exercise (Tardif et al.,      school. Some schools were therefore topped up with more pupils despite
2016). It remains unknown whether whole-brain patterns of              creating an imbalance to pragmatically increase study sample size.
multimodal brain metrics are related to cardiorespiratory fitness,         After taking consent and assent in accordance with the University of
                                                                       Oxford ethical guidelines (CUREC reference number: R51313/RE001),
physical activity, and physical health.
                                                                       61 pupils were recruited to the brain imaging substudy. Participants
    Physical activity influences physical health and contributes to
                                                                       attended a testing session at the University of Oxford during which brain
physical fitness, but both activity and fitness may be considered      imaging, cognitive, and behavioral data were collected.
part of an underlying, latent factor. In order to characterize a           The analysis required high-quality complete multimodal MRI data.
phenotype of physical lifestyle, measuring whole-day physical ac-      One participant withdrew during the scan session. One complete dataset
tivity levels during a normal school week is therefore at least as     was lost because of hardware failure. Of the remaining datasets, quality
important as assessing gold-standard measures of cardiorespira-        control process identified issues with data quality (e.g., head motion,
tory fitness, such as VO2max measured on an incremental step-          ringing artifacts, blurring, etc.) in one or more modalities in 9 pupils.
test on a cycle ergometer.                                             Therefore, only 50 pupils (median age: 12 years; 26 females, 52%; Table
    In this study, in 50 12-year-old pupils, we acquired multimo-      1) had high-quality, complete multimodal MRI data that could be taken
dal whole-brain MRI metrics to measure resting state networks          forward into our final analysis. This substudy population is representa-
(RSNs), gray matter (GM) volume and perfusion, cortical surface        tive of the larger Fit to Study population in terms of demographics
                                                                       (Table 1). However, the substudy pupils were more active and less likely
(area and thickness), white matter (WM) microstructure, and
                                                                       to qualify for free school meals. These differences can be explained by
myelin content (R1 and R2p), resulting in a total of 18 different      difficulties in recruitment (i.e., low socioeconomic status households
metrics. These metrics are combined into multimodal whole-             were less keen to travel and more active pupils might have been more
brain phenotypes whose variation across individuals can be inter-      interested in participation). All statistical analyses were conducted on
rogated. We also acquired a rich set of variables depicting physical   this sample of 50 pupils sampled from 10 schools (Table 2). The number
lifestyle, measuring cardiorespiratory fitness (VO2max and work-       of participants per school ranged from 1 to 13. We consistently followed
load), objective physical activity (7 d actigraphy, measuring total    the recruitment process described above, but levels of interest varied
Salvan et al. · Brain–Physical Covariation in Adolescence                                                                                         J. Neurosci., 0, 2021 • 00(00):000 • 3

Table 1. Demographics, socioeconomic status, and self-reported physical                             aged 8-14 (Phillips et al., 2013). The software identified nonwear time as
activitya                                                                                           periods of at least 30 consecutive minutes of zero activity counts. We
                                                                                                    used a bespoke program, designed to handle large volumes of data, to
                                                    MRI substudy (n = 50) Main trial (n = 15,956)
                                                                                                    apply the same cut-points to each 1 s epoch. Participants who had at
Demographics                                                                                        least three valid weekdays and one valid weekend day were included in
   Age, mean (SD), years                    12 (0.27)                       12.5 (0.294)            the analysis (Troiano et al., 2014). For both brief bursts and long-lasting
   Female, no (%), yes                      26 (52%)                       8931 (56.0%)             physical activity, participants’ total minutes of sedentary, moderate, and
   Pubertal development level, mean (SD) 2.216 (0.59)                      —                        vigorous activity per day were calculated.
Socioeconomic status
   IMD, mean (SD)                         7.82 (1.96)                      —                        Physical health
   FSM, no (%), yes                          1 (2%)                        2664 (16.7%)             Physical health was assessed on the day of testing at rest (prior cardiores-
Self-reported physical activity                                                                     piratory testing) by measuring heart rate and systolic and diastolic blood
   Reported active days, mean (SD)        5.43 (1.83)                      4.42 (1.92)              pressure. Compared with publicly available age-matched normative val-
a
IMD, Index of multiple deprivation; FSM, free school meal.                                          ues (Flynn JT et al., 2018), blood pressure (5th-95th percentiles) was
                                                                                                    found within healthy values (normative values for 12 years old pupils:
                                                                                                    systolic: 102-131 with average of 113; diastolic: 61-83 with average of 75;
Table 2. Sampling frequency by school                                                               study sample, systolic: median = 106, 5th-95th percentiles: 89-123; dia-
Schoola                                            No. of pupils                              %     stolic: median = 73, fifth-95th percentiles: 58-85).

S-1                                                 1                                          2    Negative behaviors not considered in the analysis
S-2                                                 2                                          4    As part of the study, we also obtained ethics to ask pupils information
S-3                                                10                                         20    about negative behaviors, such as smoking, drinking alcohol, or drug
S-4                                                 6                                         12    use. However, none of the pupils reported having used any of these
S-5                                                 8                                         16    substances.
S-6                                                 1                                          2
S-7                                                 1                                          2    MR imaging
S-8                                                 1                                          2    MRI acquisition parameters
S-9                                                13                                         26    All MRI scans were conducted during summer 2017 at the Oxford
S-10                                                7                                         14    Center for FMRIB using a 3T Siemens Magnetom Prisma scanner with a
a
Values in the first column School are arbitrary.                                                    32-channel head coil.
                                                                                                       The MRI protocol included the following:
considerably across schools because of several reasons, including variable                             T1 weighted (T1w) three-dimensional rapid gradient echo sequence
interest from pupils, concerns from parents regarding the study or travel                           (3D MPRAGE): TR = 1900 ms; TE = 3.97 ms; flip angle = 8°; FOV = 192
distance, and unavailability during summer holidays.                                                mm; voxel size: 1 1  1 mm. Sequence duration: 5 min 31 s.
                                                                                                    1. Resting-state functional MRI (rs-fMRI): multiband EPI sequence;
Behavioral testing                                                                                     TR = 933ms; TE = 33.40 ms; FOV = 192 mm; 72 slices; voxel size:
All pupils underwent a half-day testing session at the Functional                                      2  2  2 mm; multiband acceleration factor = 6. Sequence dura-
Magnetic Resonance Imaging of the Brain (FMRIB) building in Oxford                                     tion: 10 min 10 s. For each scan, 644 volumes were acquired.
during summer 2017. Over a period of ;5 h, and with multiple breaks,                                   Participants were asked to look at a fixation cross, blink normally,
pupils performed, in this order, cognitive testing, multimodal MRI scans,                              try not to fall asleep, and try not to think about anything in particu-
physical health monitoring, and physical activity testing. Actigraphy                                  lar. A field map was also acquired to correct for inhomogeneity dis-
monitoring aimed at capturing activity levels over a normal school week                                tortions. Sequence duration: 1 min 34 s.
time was conducted previous to the day of testing at FMRIB.                                         2. Diffusion-weighted MRI (DW-MRI): multishell, multiband EPI
                                                                                                       sequence; b values = 0, 1250, 2500 s/mm2, with, respectively 11, 60,
Cardiorespiratory fitness                                                                              60 diffusion-weighted directions; TR = 2483 ms; TE = 78.20 ms;
Objective measures of cardiorespiratory fitness were acquired through                                  FOV = 214 mm; voxel size: 1.75  1.75  1.75 mm; multiband accel-
an incremental step-test on a cycle ergometer (Lode Excalibur Sport).                                  eration factor = 4. Sequence duration: 5 min 40 s. In addition, 4 b =
We then extracted values for maximal oxygen consumption per kilo-                                      0 s/mm2 images were acquired with reversed phase encoding, for the
gram (VO2/kg max) (ml/min/kg), and work load maximum (Watts) as                                        purpose of EPI distortion correction. Sequence duration: 32 s.
primary measures of interest.                                                                       3. Quantitative FLASH-MRI (Weiskopf et al., 2013): two 3D multiecho
                                                                                                       FLASH datasets, one predominantly proton-density weighted (PDw,
Physical activity                                                                                      flip angle = 6 deg), and one predominantly T1w (flip angle = 21
Objective physical activity was assessed over 5 weekdays and 2 weekend                                 deg); FOV = 256 mm; voxel size: 1  1  1 mm; TR = 25 ms; first
days using the Axivity AX3 wrist-worn accelerometer (Open Lab,                                         TE = 2.34 ms; eight equally space echoes, echo spacing = 2.3;
Newcastle University) (Ladha et al., 2013). We therefore chose to define                               GRAPPA acceleration factor = 2 in both phase-encoded directions,
a valid wear day as 12 consecutive hours from 08:00 to 20:00 to capture                                with 40 reference lines in each direction. Duration for each FLASH
travel to and from school and after-school sports and activities. To                                   sequence: 5 min 11 s. Two single-echo, low-resolution (4 mm iso-
account for later weekend waking times, we accepted any consecutive                                    tropic) FLASH scans were acquired before each high-resolution
10 h period between 08:00 and 20:00 on Saturdays and Sundays, and                                      scan; identical FOV; TR = 4 ms; TE = 2 ms; one was acquired receiv-
standardized total activity to 12 h. We then aimed to capture both brief                               ing on the 32-channel receive head coil, the other receiving on the
bursts and long-lasting activity. We summarized raw accelerometer data                                 body coil. To correct for the effect of RF inhomogeneities, the local
from three axes of movement into the signal vector magnitude, or activ-                                RF field was mapped using a 2D DAM method with a FLASH
ity “count,” expressed per 60 s epoch and also per 1 s epoch to character-                             readout.
ize sustained bouts of activity and also shorter bursts of movement.                                4. Pseudo-continuous arterial spin labeling with background presatu-
Axivity’s Open Movement GUI software calculated whether each 60 s                                      ration (Okell et al., 2013): six imaging blocks, each with different
epoch was spent in sedentary, light, moderate, or vigorous activity by                                 post-labeling delays: 0.25, 0.5, 0.75, 1, 1.25, and 1.5 s. Arterial blood
applying “cut-points” or “count” thresholds corresponding to different                                 was magnetically tagged using a labeling duration of 1.4 s. Other
activity intensities derived from a validation study with young people                                 imaging parameters were as follows: single-shot EPI; TR = 4100 ms;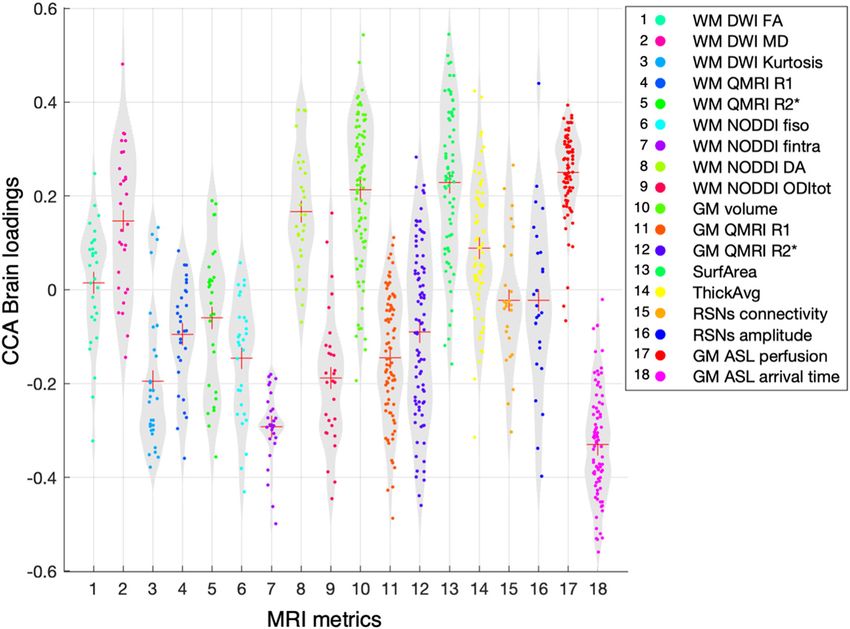
4 • J. Neurosci., 0, 2021 • 00(00):000                                                                             Salvan et al. · Brain–Physical Covariation in Adolescence

    TE = 14 ms; FOV = 220 mm; voxel size: 3.4  3.4  4.5 mm.                  Table 3. Descriptives of cognitive skills, reported mental health, and reported
    Sequence duration: 5 min 34 s.                                             general health
    In order to provide a more comfortable experience, during all struc-                                                                                        Mean (SD)
tural scans, a wildlife documentary was shown. A fixation cross was            Cognition
instead shown during rs-fMRI and ASL in order not to bias cognitive               Associative task (correct valid answers, %)                                    71 (11)
processing to certain areas/networks during assessment of resting brain           Task switching (switch cost, ms)                                              548 (333)
activity.                                                                         Object location task (identification errors, 8 s delay)                        11 (4)
                                                                               Mental health (Strengths and Difficulties Questionnaire)
MRI preprocessing                                                                 Prosocial scale                                                                  8 (1.4)
MRI data were processed primarily using FSL software (Jenkinson et al.,           Hyperactivity scale                                                              4 (2.5)
2012) and FreeSurfer (Dale et al., 1999).                                         Conduct scale                                                                    2 (1.5)
    Gradient distortion correction (GDC). GDC was applied within                  Peer scale                                                                       2 (1.9)
image analysis pipelines using tools developed by FreeSurfer and HCP              Emotional scale                                                                  3 (2.3)
groups (https://github.com/Washington-University/Pipelines), using the         General Health (Health Behavior in School-aged Children questionnaire)
Siemens scanner-specific table of gradient nonlinearities.                        Life satisfaction                                                               8 (1.6)
    Structural. Brain extraction was performed in native space after              Self-rated health                                                               4 (0.9)
GDC unwarping using FSL BET (Smith, 2002). Tissue-type segmenta-                  Multiple health complaints                                                     13 (4.8)
tion was estimated based on FSL FAST (Zhang et al., 2001), providing
hard segmentation as well as partial-volume images for each tissue type.
This tool was also used to provide a fully bias-field-corrected version of     2007), and 29 major WM bundles were reconstructed as implemented in
brain extracted structural brain images. Subcortical structures were           FSL AutoPtx (de Groot et al., 2013).
modeled using FSL FIRST (Patenaude et al., 2011).                                  Myelin and iron maps. Quantitative MRI data were processed to pro-
    Cortical surface reconstruction. Subject-specific cortical surface         duce the quantitative maps of myelination (1/T1) and iron level (1/T2p),
reconstruction and cortical parcellation were estimated based on the           using the Voxel-Based Quantification toolbox (Callaghan et al., 2014) in
GDC, brain-extracted T1 image, using the command recon-all from                Statistical Parametric Mapping (http://www.fil.ion.ucl.ac.uk/spm/). Although
FreeSurfer (Dale et al., 1999).                                                R1 (1/T1, longitudinal relaxation rate) and R2p (1/T2p, effective transverse
    Registration. Rigid registrations between multimodal MRI native            relaxation rate) are not direct quantitative maps of myelination or iron (as
spaces were estimated through FSL FLIRT with boundary-based cost               other biological factors can also affect them), these quantitative maps have a
function (Jenkinson et al., 2002; Greve and Fischl, 2009). Nonlinear           high degree of sensitivity to myelination and iron (Weiskopf et al., 2013;
warps to MNI152 standard-space T1 template were estimated through              Callaghan et al., 2014; Lutti et al., 2014).
FSL FNIRT. This set of nonlinear warps is then carried over to all MRI             Perfusion. Perfusion images were processed using FSL BASIL
modalities, such as in the case of rs-fMRI.                                    (Chappell et al., 2009). Images were first corrected with fieldmap and
    EPI distortion correction. B0 fieldmap processing was estimated            GDC unwarping; then, to obtain maps of cerebral blood flow and arrival
through FSL Topup (Andersson et al., 2003) based on AP-PA image                time in absolute units, a calibration step was implemented based on cere-
pairs from DWI-MRI protocol.                                                   brospinal fluid values.
    Functional. rs-fMRI data were preprocessed using a custom pipeline
previously validated on developmental datasets (Baxter et al., 2019;           Image-derived phenotypes (IDPs)
Fitzgibbon et al., 2020). rs-fMRI data were corrected for intervolume          Each MRI parameter was summarized in a series of IDPs: anatomy-spe-
and intravolume subject head motion and EPI distortions (Andersson             cific average values that span three sets of ROIs. For cortical and subcort-
and Sotiropoulos, 2015); high pass temporal filtering and GDC unwarp-          ical regions, we used the Desikan-Killiany Atlas (84 parcels, 68 cortical,
ing were also applied. Registration to structural was improved by an           and 16 subcortical) from the individual FreeSurfer parcellation (Fischl et
extra rigid registration step aided by a single-band EPI image. Structured     al., 2002). This parcellation was then warped into each (relevant) modal-
artifacts were removed by FSL ICA1FIX processing (Beckmann and                 ity in order not to interpolate MRI-map values. For ASL, we used this
Smith, 2004; Griffanti et al., 2014; Salimi-Khorshidi et al., 2014). The       parcellation while opting for a conservative approach to minimize cover-
FSL FIX classifier was specifically trained for these data and provided the    age issues in frontal and temporal pole ROIs (voxels size being too large
following scores in leave-one subject-out accuracy: true positive ratio        for these thin cortical ribbons). We removed bilaterally the frontal and
(TPR) = 98.8%; true negative ratio (TNR) = 95.3%; weighted ratio               temporal poles ROIs, thus resulting in 80 ROIs for ASL perfusion and 80
((3pTPR 1 TNR)/4) = 97.9%. Independent components (separately                  ROIs for ASL arrival time (instead of 84 and 84 ROIs). For the white
identified for each individual) classified as noise (i.e., motion-related,     matter, we used the 29 white matter bundles from the AutoPtx recon-
physiological artifacts, MRI acquisition/reconstruction artifacts, etc.), as   struction; first averaged at group level; optimally thresholded; and then
well as 24 motion confounds, were then regressed into the rs-fMRI signal       warped back to native spaces. For functional activity, 25 group-level
to obtain denoised (clean) rs-fMRI signal, thus minimizing the effect of       RNSs were identified.
head-motion, physiological, and MRI-related artifact at the individual              A total of 859 IDPs were then fed into statistical analysis. Functional
subject level. FSL MELODIC was then used to estimate 50 group-average          IDPs (RSNs and ASL IDPs) represented 25% of all IDPs, while WM and
independent components. We then calculated median absolute (ridge)             GM IDPs represented, respectively, 30% and 45% of all IDPs.
partial correlation (with a regularization value of 0.1) and amplitude for
each of the 25 independent components identified as RSNs.
    Diffusion. DWI-MRI data were first corrected for eddy currents, EPI        Cognitive testing and reported mental health and general health
distortions, and intervolume and intravolume subject head motion, with         measures
outlier-slice replacement, using FSL Eddy (Andersson and Sotiropoulos,         All measures acquired during the testing are reported in detail in
2015). GDP unwarping was then applied (Miller et al., 2016). Diffusion         Wassenaar et al. (2019).
tensor imaging (DTI) fitting was conducted with FSL DTIFIT using a
kurtosis model (Behrens et al., 2007). Neurite Orientation Dispersion          Cognitive skills
and Density Imaging (NODDI) modeling was estimated using FSL                   Here we considered a summary measure for three tasks of interest: the
cuDIMOT based on the Bingham-NODDI model (Tariq et al., 2016). In              relational memory task (correct valid answers, %) (Chaddock et al.,
order to resolve crossing-fiber configurations, multishell voxelwise diffu-    2010); task switching (switch cost, ms) (Hillman et al., 2014); and object-
sion was modeled using FSL BedpostX (Jbabdi et al., 2012). Probabilistic       location task (identification errors 8 s delay; Table 3) (Pertzov et al.,
tractography was then conducted with FSL ProbtrackX (Behrens et al.,           2012).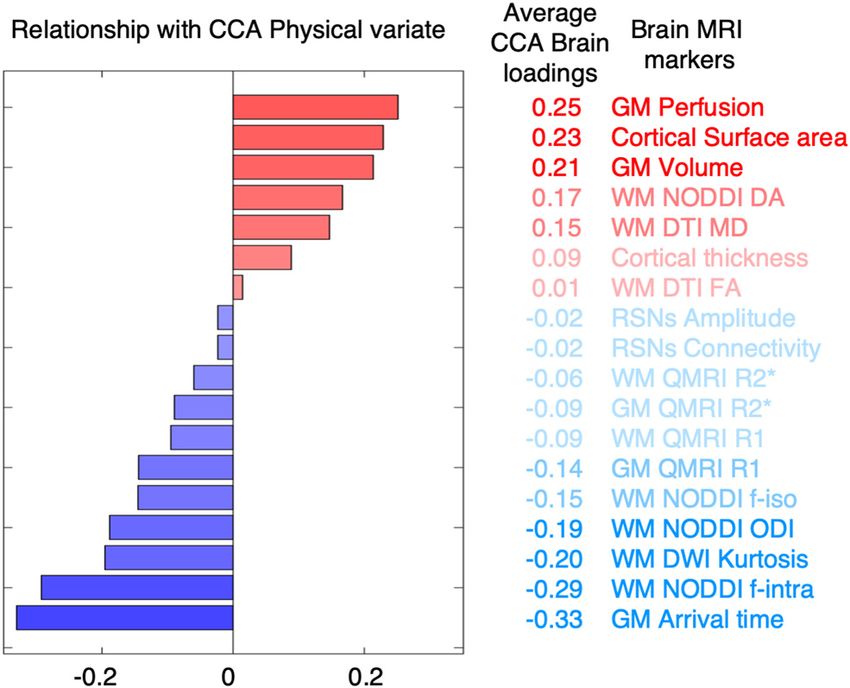
Salvan et al. · Brain–Physical Covariation in Adolescence J. Neurosci., 0, 2021 • 00(00):000 • 5
Table 4. MRI modalities and MRI metrics used to define IDPs of brain function Table 5. Descriptives of physical variablesa
and structurea Mean (SD)
MRI modality Metric ROI type No.
VO2max, VO2/kg max (ml/min/kg) 37.2 (8.5)
rs-fMRI Functional connectivity RSN 25 VO2max, workload max (Watts) 137.8 (25.9)
rs-fMRI Amplitude RSN 25 Vigorous PA, bursts (min per week) 41.0 (34.2)
ASL Perfusion GM 80 Moderate PA, bursts (min per week) 247 (106)
ASL Arrival time GM 80 Sedentary activities, bursts (min per week) 4075 (993)
T1w-MRI Volume (VBM-like) GM 84 Vigorous PA, long-lasting (min per week) 10 (14)
q-MRI R1 GM 84 Moderate PA, long-lasting (min per week) 320 (167)
q-MRI R2p GM 84 Sedentary activities, long-lasting (min per week) 3502 (369)
T1w-MRI Surface area Cortex 68 Days active during past week 4.9 (1.8)
T1w-MRI Surface thickness Cortex 68 Body mass index 19.5 (4.1)
DW-MRI DTI - FA WM 29 Resting heart rate (bpm) 75 (12)
DW-MRI DTI - MD WM 29 Blood pressure, systolic (mmHg) 106 (10)
DW-MRI DTI - Kurtosis WM 29 Blood pressure, diastolic (mmHg) 73 (7)
q-MRI R1 WM 29 a
Thirteen measures of physical activity, fitness, and physical health were considered in testing the relation-
q-MRI R2p WM 29 ship with brain IDPs. Here we report mean (SD) before correcting for demographics and socioeconomic sta-
DW-MRI NODDI f-iso WM 29 tus. PA, Physical activity.
DW-MRI NODDI f-intra WM 29
DW-MRI NODDI DA WM 29 neuroimaging metrics (Table 4) with a linear combination of physical
DW-MRI NODDI ODI WM 29 measures (Table 5). To this end, we used CCA, an approach that has suc-
a
Five MRI sequences were used to quantify 18 different MRI metrics. Specific sets of ROIs were then used for cessfully been applied in recent studies and that, compared with pairwise
each MRI metric to extract whole-brain MM IDPs quantifying brain structure, microstructure, function, myelin
content, and blood perfusion.
association testing, has shown greater sensitivity for complex biological
processes and greater explained variance (Smith et al., 2015; Miller et al.,
2016).
Mental health CCA is a symmetric, cross-decomposition method that characterizes
Mental health was assessed with the Strengths and Difficulties covariation modes between a pair of two-dimensional datasets. This is
Questionnaire (Goodman, 1997). achieved by finding two sets of free parameters (or canonical coefficients,
i.e., one set of coefficient vectors per set of brain metrics and one set of
Questionnaire on general health coefficient vectors per set of physical metrics) that maximize the correla-
From the Health Behavior in School-aged Children questionnaire tion of the projections of the two datasets into the identified latent space
(World Health Organization, 2016), we used the positive health items (or canonical variates or subject scores). In other words, the variation in
(self-rated health, life satisfaction, multiple health complaints) to mea- mode strength between subjects is maximally correlated. Here, this was
sure reported general health. computed using MATLAB ‘canoncorr’ function.
Experimental design and statistical analyses
This is a cross-sectional study with a sample size of N = 50 subjects. Unbiased statistical inference through block-aware permutation
Because of the limited sample size compared with the number of varia- testing
bles of interest, we strove to reduce input data and nuisance variables Deconfounding, as required to ensure that the CCA is not driven by nui-
dimensions as much as possible. Standardization of variables before sance factors, induces a dependency among the rows of the data submit-
decomposition methods (principal component analysis [PCA] and ca- ted to CCA. While this dependency is weak and diminishes with
nonical correlation analysis [CCA]) was applied to avoid variables with increasing sample size, it represents a violation of the exchangeability
disproportionately greater variance driving the decomposition. All statis- assumption required by permutation, which can inflate permutation sig-
tical analyses were conducted in MATLAB 2018. nificance. To account for this deconfounding-induced dependency that
violates exchangeability, we use a method that, without changing the ca-
Confounds nonical correlations, reduces the data from N observations to N-Nz
Before all statistical analyses, a series of relevant confounds was chosen: age; observations that are exchangeable and, thus, can be subjected to a per-
sex; pubertal developmental level (assessed through the Pubertal mutation test (Theil, 1965; Winkler et al., 2020). We randomly chose
Development Rating Scale) (Petersen et al., 1988), a self-report measure of 1000 sets of Nz rows for removal, conducting 1000 permutations for
physical development for youths under the age of 16); socioeconomic status each set.
(assessed through the United Kingdom Index of Multiple Deprivation); and Permutations were performed among subjects within school, respect-
head size/scaling factor (computed through FSL SIENAX). ing dependencies given by the hierarchical structure of the data (Winkler
On these nuisance variables, we perform a dimensionality reduction et al., 2015). For each of the 1000 repetitions, a p value was computed
through means of PCA (Nz = 2) accounting for 60% of total variance. based on this null distribution for the first CCA mode. Across repetitions,
These confounds were then regressed out of all IDPs and behavioral var- a distribution of statistical significance values was built and the final statis-
iables and the residuals standardized. tical significance level was computed as its average value. The results of
this analysis are shown in Figure 2b.
Dimensionality reduction of IDPs and physical variables
In order to avoid an overdetermined, rank-deficient CCA solution, and Unbiased estimation of effect size through leave-one school-out
to limit the chances of overfitting, a dimensionality reduction step was cross-validation
performed to both IDPs and physical variables. Using the same approach In order to derive an unbiased estimate of the CCA correlation strength
previously applied by Smith et al. (2015), IDPs were reduced into 10 that took into account the hierarchical structure in the data, we imple-
PCAs (Nx = 10; variance explained = 53%), whereas physical variables mented a leave-one school-out cross-validation (CV) approach. In all
were reduced into 5 PCAs (Ny = 5; variance explained = 79%). but one school, we performed all the above steps (except permutation
testing), learning all the coefficients of the standardization steps and of
CCA the linear transformations. On the left-out school, we then applied those
We sought to characterize a mode of brain–physical covariation across transformations and predicted left-out pupils’ scores in the CCA mode.
pupils: a data-driven latent factor linking a linear combination of We repeated this procedure for all folds (here schools). CV performance
6 • J. Neurosci., 0, 2021 • 00(00):000                                                                                               Salvan et al. · Brain–Physical Covariation in Adolescence

was then quantified as the Pearson’s r corre-
lation coefficient and mean squared error
(MSE) calculated between predicted brain and
physical canonical covariates (or predicted ca-
nonical variates). The results of this analysis
are shown in Figure 2a.

Supplementary analysis for robustness of
identified covariation when varying the
number of principal components (PCs) on
the IDPs
In order to assess whether the identified rela-
tionship changes when varying the number of
PCs of IDPs, we repeated the whole statistical
testing pipeline for a range of PCs numbers
(from Nx = 6-to-14, independently for each
PC number) around the previously chosen
PCs number (Nx = 10). The results of this
analysis are shown in Figure 2c–f.

Characterization of brain and physical
phenotypes
We then aimed to characterize the CCA phe-
notypes: the set of brain measures and the set
of physical measures symmetrically linked by
the CCA covariance mode. To do this (for-
mally, to characterize the CCA crossed load-
ings, hereafter referred to as loadings), we
follow the procedure described by Smith et al.
(2015). On the whole sample, CCA brain
loadings were calculated as the pairwise
Pearson’s partial correlation between CCA
physical variate (or subject scores) and the
original datasets of brain IDPs, while control-
ling for the full set of nuisance variables: CCA
brain loadings = partial correlation (brain
IDPs, CCA physical variate, nuisance varia-
bles). The results of this process are shown in
Figures 4–6. CCA physical loadings were cal-
culated with the following the same process:
CCA physical loadings = partial correlation
(physical variables, CCA brain variate, nui-
sance variables). The results of this process
(only for structural IDPs) are shown in
Figure 3. CCA loadings are therefore bound
between 1 and 1.
    For functional measures, each IDP is repre-
sented by a whole-brain RSN. To aid interpre-
tation, for each RSN, its CCA brain loading            Figure 2. Mode of brain–physical covariation across pupils. The results from CCA highlight one significant mode of brain–
was multiplied by the group RSN map. The               physical covariation across pupils. a, Scatter plot of cross-validated canonical variates between brain IDP scores and physical
results of this process are shown in Figure 5a,        scores. Each dot represents a pupil (cross-validated CCA: r = 0.34). Statistical significance of CCA was assessed 1000 times,
b. Then, to derive a summary representation,           each time comparing the real value against 1000 block-aware permutations taking into account school structure. b,
we concatenated all RSN maps in a 4D file and          Distribution of statistical significance values. The final significance value was assessed as the average of this distribution (p
computed standardized mean across RSNs,                = 0.0130). Red dashed line indicates cutoff of statistical significance of a = 0.05. c, Explained variance in IDPs as a function of
separately for both functional connectivity and        varying the number of PCs (from Nx = 6-14). d, For each number of PCs, the whole statistical testing pipeline was performed.
amplitude. The results of this process are             All analyses led to a statistically significant mode of covariation, showing robustness of identified brain–physical covariation.
shown in Figure 5c, d.                                 For each number of PCs, the whole CV pipeline was performed: CV r (e) and CV MSE (f) across the range of PCs on the IDPs.
    We then aimed to characterize the average
involvement for each type of MRI value. Across
IDPs of a MRI metric, we computed the average                                               multiple linear regression with nonparametric combination (NPC)
across CCA brain loadings. This provided a ranked list of MRI parameters                    implemented in FSL PALM (Winkler et al., 2016). NPC works by com-
representing the average relationship of each MRI metric with pupils’ physi-                bining test statistics or p values of separate (even if not independent)
cal scores. The results of this process are shown in Figure 7.                              analyses into a single, joint statistic, the significance of which is assessed
                                                                                            through synchronized permutations for each of the separate tests. Here
Joint-inferences with univariate measures of cognitive skills, mental                       we asked whether each CCA covariate (brain covariate while adjusting
health, and general health                                                                  for physical covariate, and vice versa) was associated with any domain of
The tests for association between the identified CCA mode and the mul-                      interest, and the NPC was tested via Fisher statistic with 1000 block-
tiple variables measuring the domains of cognitive skills, mental health,                   aware permutations while adjusting for nuisance variables in reduced
and general health were conducted (separately for each domain) using                        space. For each domain, NPC Fisher significance values were corrected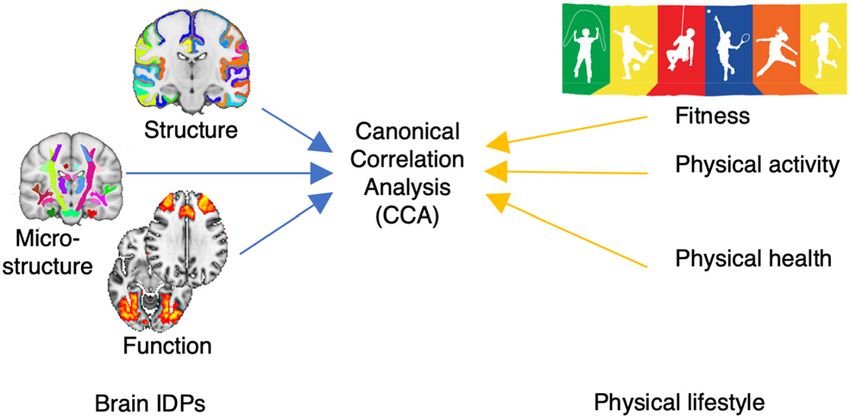
Salvan et al. · Brain–Physical Covariation in Adolescence J. Neurosci., 0, 2021 • 00(00):000 • 7
and functional IDPs, see, respectively, Fig. 4 and Fig. 5a,b; for
violin plot of CCA brain loadings for all IDPs, see Fig. 6).
We observed that some MRI metrics presented a global and
homogeneous involvement in the mode of covariation across
ROIs. In order to quantify this tendency, for each MRI metric, we
computed the average CCA brain loadings across all ROIs (Fig. 7).
We found that the strongest CCA brain loadings were found for
GM perfusion (and arrival time) as well as cortical surface area,
GM volume, and a number of WM diffusion metrics. MRI metrics
with the greatest average CCA brain loadings tended to be charac-
terized by spatially extended and homogeneous involvement
across the whole brain. Together, these results show that pupils
with greater physical scores were those who also showed global
patterns of higher blood perfusion (and lower arrival time, i.e.,
Figure 3. Physical phenotype linked to the brain–physical mode of covariation. Bar plot
represents the CCA physical loadings. Each coefficient represents the relationship between
faster perfusion) in the GM, greater GM volume, greater cortical
each physical metric and subjects’ brain IDP scores (or CCA brain variate). Bar plot and vari- surface area, greater neurite dispersion anisotropy across WM
able ranking are matched and color-coded in red/blue in accordance to a positive/negative tracts, as well as greater extraneurite fraction (equivalent to lower
relationship with the mode of covariation (the magnitude of involvement is further repre- intraneurite fraction), and lower neurite orientation dispersion.
sented through transparency). We also observed that, although the average CCA brain load-
ings for RSNs functional connectivity and BOLD amplitude was
for multiple comparison testing across CCA covariates (brain and physi- close to zero, there was great variance across RSNs (Fig. 5).
cal) via family-wise error correction (FWE-corr). Because RSNs are not binary masks but are instead characterized
by spatial distributions, to summarize their pattern of involve-
Results ment in the mode of covariation, for each voxel we computed
the standardized mean CCA brain loadings across RSNs (Fig. 5c,
Brain–physical mode of covariation across pupils
d). The resulting maps for functional connectivity (Fig. 5c) and
Using CCA, we tested the hypothesis that, across pupils, inter-
amplitude (Fig. 5d) showed both similarities and differences in
subject differences in multimodal whole-brain IDPs covaried
their patterns of involvement in the mode of covariation. In
significantly with differences in physical lifestyle variables, inde-
pendent of nuisance variables. We found one significant mode of Figure 5c, RSN functional connectivity shows greater positive
brain–physical covariation across pupils, linking differences in involvement bilaterally in the parietal cortices, supplementary
brain IDPs with individual differences in physical lifestyle (Fig. motor cortex, putamen, and right primary motor cortex, whereas
2a, CCA: r = 0.34, MSE = 1.38, using leave-one school-out CV; it shows greater negative involvement broadly in the occipital cor-
Fig. 2b, p = 0.0130, significance assessed on 1000 repetitions, tices. The peak of positive involvement was localized in the right
each with 1000 block-aware permutations; results remained the parietal cortex, whereas the negative involvement was localized in
same if adjusted for the full set of nuisance variables, p = 0.0312, the occipital cortex. In Figure 5d, RSN BOLD amplitude shows
significance assessed on 1000 repetitions). We also show that greater positive involvement in the anterior cingulate gyrus
varying the number of PCs on the IDPs (from Nx = 6 PCs to 14 (dACC), superior frontal gyrus, parietal cortices, right inferior
PCs) consistently produces the same results (Fig. 2c–f), showing frontal gyrus, whereas it shows greater negative involvement
robustness of the identified relationship across a range of PCs on broadly in the occipital cortices, and left primary somatosensory
the IDPs. This mode represents a pattern of brain IDPs that cortex. The peak of positive involvement was localized in the
covaries with a pattern of physical variables. We next interro- dACC, whereas the negative involvement was localized in the
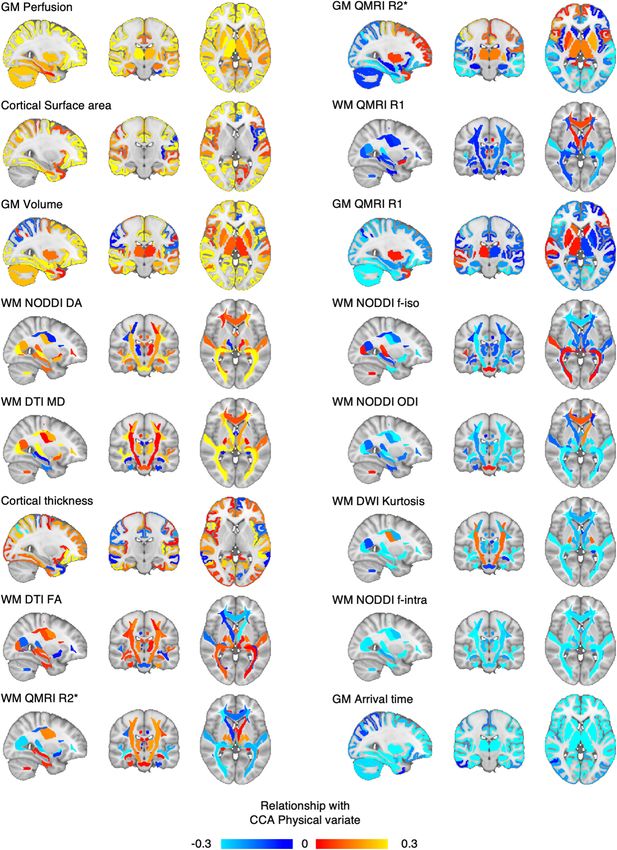
gated this physical phenotype and brain phenotype separately, to occipital cortex. These maps show a common pattern of greater
determine the patterns that underlie this mode. positive involvement bilaterally in the parietal cortices, and a com-
mon pattern of negative involvement in the occipital cortices.
Physical phenotype of covariation
For each physical variable, we calculated the loadings of the Relationship with measures of cognition, mental health, and
physical phenotype relating to the CCA mode (or CCA physical general health
loadings) representing the relationship between each physical We then tested the hypothesis that the identified CCA mode of
variable and the CCA brain variate (or subjects’ brain scores) brain–physical covariation was significantly associated with meas-
(Fig. 3). We found that pupils who scored higher in the brain– ures of (1) cognitive skills, (2) mental health, and (3) general
physical mode of covariation were those with higher cardiovas- reported health. We used a multiple linear regression to test the
cular fitness; those with lower body mass index; those who spent association between the CCA variates (brain covariate while
more time doing long-lasting (both moderate and vigorous) adjusting for physical covariate, and vice versa) and the outcome
physical activity during a normal school week and spent less measures. Testing an NPC joint-inference for each domain, we
time being sedentary. found no statistically significant association with cognitive skills
(respectively, for brain covariate and physical covariate, NPC
Brain phenotypes of covariation Fisher FWE-corr p = 0.2600, 0.2360) or general reported health
In order to interpret brain phenotypes of physical covariation, (respectively, for brain covariate and physical covariate, FWE-corr
we calculated the canonical loadings for each IDP of brain struc- p = 0.7240, 0.4910). We found a trend toward an association
ture, microstructure, and function. These loadings (or CCA between individual differences in the brain covariate and differen-
brain loadings) represent the relationship between each brain ces in mental health (NPC Fisher FWE-corr p = 0.0640), whereas
IDP and the CCA physical variate (or subjects’ physical scores) no significant association was found for the physical covariate
(to explore the spatial patterns of all structural, microstructural, (NPC Fisher FWE-corr p = 0.1830).8 • J. Neurosci., 0, 2021 • 00(00):000 Salvan et al. · Brain–Physical Covariation in Adolescence Figure 4. Structural IDPs and their relationship with the identified phenotype of physically active lifestyle. For each MRI metric and for each structural ROI (thus, for all structural IDPs), the relationship with the identified phenotype of active lifestyle. Hot colors represent a positive relationship with the physical phenotype. Cold colors represent a negative relationship. Structural maps are ranked from top to bottom (left column to right) in accordance to average CCA brain loadings (as shown in Fig. 7). Discussion multimodal brain phenotypes are linked with a specific, In this work, we show that, in 12-year-old pupils, physical latent pattern of physical measures that capture a physically activity, fitness, and physical health are linked with global active lifestyle (high fit, high active, low sedentary individu- patterns of brain structure, microstructure, and function. als). This finding hints at the involvement of multiple In this relationship, whole-brain, homogeneous patterns of underlying biological processes and suggests that physical
Salvan et al. · Brain–Physical Covariation in Adolescence                                                                                                     J. Neurosci., 0, 2021 • 00(00):000 • 9

Figure 5. Functional IDPs and their relationship with the identified phenotype of physically active lifestyle. For each RSN, and for both metrics functional connectivity (a) and amplitude (b),
the relationship with the identified phenotype of active lifestyle. Hot colors represent a positive relationship with the physical phenotype. Cold colors represent a negative relationship. To aid
interpretation, for each RSN, its CCA brain loading was multiplied by the group RSN map. RSNs are here ranked from top to bottom in accordance to their CCA brain loadings. We then con-
catenated all RSNs maps in a 4D file and computed the mean and SD across RSNs, separately for both functional connectivity and amplitude. c, Standardized mean of CCA brain loadings for
RSN functional connectivity. d, Standardized mean of CCA brain loadings for RSN amplitude. c, d, Top row represents the same brain coordinates. Bottom row represents the respective peak of
greater CCA brain loadings. c, d, Dashed circle represents the peak value.

health and aerobic exercise might have a wider effect on                                            index are negatively related. Furthermore, we showed that long-
brain processes than previously thought.                                                            lasting physical activity, either moderate or vigorous, is more
    We applied a holistic approach to provide novel insight into                                    important to this relationship than brief bursts of activity, sug-
the importance of different aspects of a physically active lifestyle                                gesting that regular moderate-to-vigorous physical activity might
in relation to brain structure and function. While high cardiovas-                                  be a better driver to promote brain changes. Together, these
cular fitness and physical activity are positively linked with the                                  findings situate pupils along a latent axis according to their
identified brain phenotypes, sedentary activity and body mass                                       physical phenotype: pupils with high cardiorespiratory fitness
10 • J. Neurosci., 0, 2021 • 00(00):000 Salvan et al. · Brain–Physical Covariation in Adolescence
and performance and with high weekly levels of
physical activity, contrast with pupils spending
most time in sedentary or low-energy behaviors.
The novelty of this work is the finding of mul-
timodal global brain phenotypes linked with a
physically active lifestyle. Although prior work has
studied the relationship between single measures
of brain structure or function and, separately,
physical activity or fitness (Valkenborghs et al.,
2019), our approach allowed us to identify latent
patterns of multimodal brain IDPs characterized
by the involvement of multiple brain regions in
the covariation with physical scores. Specifically,
greater physical scores were linked with spatially
extended patterns of greater blood perfusion and
faster arrival time in the GM, greater GM volume,
and larger cortical surface area, and in the WM
with lower intraneurite density and kurtosis. This
result shows that high fitness and physical activity
are associated with more global patterns of brain Figure 6. Relationship with physical lifestyle phenotype for all brain IDPs. CCA brain loadings for all 859 brain
structure than previously thought. Further work is IDPs divided into each MRI metric. Each dot represents one single IDP.
needed to better understand multimodal, spatially
extended phenotypes of brain structure (Groves et
al., 2012; Douaud et al., 2014). Indeed, it remains
unknown how spatially extended brain patterns
relate to individual differences in cognition, their
level of heritability, as well as to what extent they
are susceptible to plasticity. Although it is not pos-
sible to infer the presence of a specific biological
process or cellular component solely on the basis
of MRI measures (Zatorre et al., 2012), these
results suggest that high fitness and regular physi-
cal activity might have a more widespread impact
on brain structure than previously thought.
Previous literature has explicitly focused on
studying the effects of aerobic exercise on the hip-
pocampus (Cotman, 2002; Pereira et al., 2007;
Chaddock-Heyman et al., 2016; Thomas et al.,
2016). Cardiorespiratory fitness is indeed known
to promote hippocampal neurogenesis and angio-
genesis that, in turn, determines macroscale
changes that are also visible via noninvasive neu- Figure 7. Brain phenotype linked to the brain–physical mode of covariation. Bar plot represents the average
roimaging (van Praag et al., 1999). Here, we CCA brain loadings. Each coefficient represents the relationship between each MRI metric (average across ROIs)
extend the current knowledge beyond a uniquely and pupils’ physical lifestyle scores. Bar plot and variable ranking are matched and color-coded in red/blue in ac-
cordance to a positive/negative relationship with the mode of covariation (the magnitude of involvement is further
hippocampal pattern, highlighting the global na- represented through transparency).
ture of greater volume and faster perfusion across
the whole-brain GM. In other words, variation in
hippocampal structure alone does not underlie to a lesser extent, with lower neurite orientation dispersion and
the brain–physical relationship characterized here. Rather, we with greater dispersion anisotropy. It is relevant that the DW-
observed homogeneous loadings across GM areas. The strongest MRI protocol used in this study would be sensitive to diffusion
contributions to our brain phenotype came from perfusion properties within large glial cells, such as astrocytes and oligo-
measures. These robust associations found with perfusion met- dendrocytes. Our gradient strength provides sensitivity to
rics are in line with a body of literature showing positive effects length-scales of ;4-6 mm, with the body size of astrocytes and
of physically active lifestyle on vascular health (Department of oligodendrocytes being, respectively, in the order 20 mm
Health and Human Services Office of Disease Prevention and (Oberheim et al., 2009) and of 14 mm (Bakiri et al., 2011), much
Health Promotion, 2000; Vaynman et al., 2004), as well as animal larger than the average myelinated axon diameter (,1 mm)
studies linking physical exercise to angiogenesis (Kleim et al., (Liewald et al., 2014). Indeed, astrocytes and oligodendrocytes
1996; Rhyu et al., 2010). are the most abundant cells in WM (based on cell counts),
Further key insights derive from spatially extended patterns accounting for more than half the volume of an MRI voxel
of WM covariation. Although the myelin-sensitive metrics (Walhovd et al., 2014). It is thus possible that an increase in size
(Quantitative-MRI) in the current study made little contribution or number of macroglia cells would have a significant effect on
to the mode of variation, higher scores on the physical phenotype the DW-MRI signal, thus contributing to the positive association
were associated with lower intraneurite density and kurtosis and, here observed between physical lifestyle scores and WMSalvan et al. · Brain–Physical Covariation in Adolescence J. Neurosci., 0, 2021 • 00(00):000 • 11
extraneurite fraction (by construction 1 minus intraneurite den- In conclusion, this work provides novel insight into the com-
sity, and specifically, the hindered space outside the neurites pre- prehensive relationship between physically active lifestyle and
scribed through anisotropic diffusion). Crucially, there exists key brain structure and physiology in early adolescence. These find-
histologic evidence from animal studies in support of an increase ings have broad implications for future research, suggesting
in astrocyte proliferation and in GFAP levels (Li et al., 2005; Uda novel avenues to study the effect of modifiable lifestyle factors as
et al., 2006) and in oligodendrocyte number (Luo et al., 2019) in part of wider brain-body relationships. Understanding how
several areas of the rat brain. Together with this previous litera- physical pathways may foster healthy human brain development
ture, the findings here reported may suggest a positive relation- can help us to develop better intervention studies aimed at
ship between physically active lifestyle and macroglia cell density informing public health and education policies.
across multiple WM tracts, perhaps reflecting a role in providing
enhanced metabolic support for neurons. This hypothesis should
be tested using imaging alongside more direct measures from ex
References
Andersson JL, Sotiropoulos SN (2015) Non-parametric representation and
vivo studies, or using alternative techniques with greater specific- prediction of single- and multi-shell diffusion-weighted MRI data using
ity, such as detecting MRS-visible metabolites with greater sensi- Gaussian processes. Neuroimage 122:166–176.
tivity to astrocytes (Brand et al., 1993). Andersson JL, Skare S, Ashburner J (2003) How to correct susceptibility dis-
We also report two patterns of RSNs involvement in the tortions in spin-echo echo-planar images: application to diffusion tensor
mode of brain–physical covariation. We found that a physically imaging. Neuroimage 20:870–888.
active lifestyle was linked with greater connectivity in the parietal Bakiri Y, Káradóttir R, Cossell L, Attwell D (2011) Morphological and electri-
cal properties of oligodendrocytes in the white matter of the corpus cal-
cortices and with lower connectivity in the occipital cortices,
losum and cerebellum. J Physiol 589:559–573.
showing, respectively, increased and decreased BOLD coupling Baxter L, Fitzgibbon S, Moultrie F, Goksan S, Jenkinson M, Smith S,
with all RSNs in more active participants. The same phenotype Andersson J, Duff E, Slater R (2019) Optimising neonatal fMRI data anal-
of a physically active lifestyle was also positively related with ysis: design and validation of an extended dHCP preprocessing pipeline
greater amplitude in local BOLD fluctuations in the dACC and to characterise noxious-evoked brain activity in infants. Neuroimage
in the parietal cortices, and with lower amplitude in the occipital 186:286–300.
cortices. Studying both RSNs amplitude (BOLD variance) and Beckmann CF, Smith SM (2004) Probabilistic independent component anal-
functional connectivity (BOLD covariance) can be important to ysis for functional magnetic resonance imaging. IEEE Trans Med
Imaging 23:137–152.
understand possible sources of change and the related neural
Behrens TE, Berg HJ, Jbabdi S, Rushworth MF, Woolrich MW (2007)
processes (Garrett et al., 2010; Duff et al., 2018). While greater Probabilistic diffusion tractography with multiple fibre orientations: what
activity both in functional connectivity and in BOLD amplitude can we gain? Neuroimage 34:144–155.
may suggest greater coactivation between the parietal cortices Brand A, Richter-Landsberg C, Leibfritz D (1993) Multinuclear NMR studies
and multiple RSNs across the whole brain, greater BOLD ampli- on the energy metabolism of glial and neuronal cells. Dev Neurosci
tude with no increase in functional connectivity, as observed in 15:289–298.
the dACC, may suggest greater local activity that results in a Callaghan MF, Freund P, Draganski B, Anderson E, Cappelletti M,
decoupling of the dACC from the rest of brain activity. Greater Chowdhury R, Diedrichsen J, FitzGerald TH, Smittenaar P, Helms G,
Lutti A, Weiskopf N (2014) Widespread age-related differences in the
dACC activity during a cognitive control task was previously
human brain microstructure revealed by quantitative magnetic resonance
associated with higher fitness levels in preadolescent children, imaging. Neurobiol Aging 35:1862–1872.
with greater dACC activity in the high fit group positively related Cassim L, Ladha K, Jackson D, Olivier P (2013) Shaker table validation of
to accuracy in task performance (Voss et al., 2011). In this study, OpenMovement AX3 accelerometer. In: Ahmerst (ICAMPAM 2013
however, we found no significant association between pupil’s AMHERST): In 3rd International Conference on Ambulatory
scores in the mode of brain–physical covariation and differences Monitoring of Physical Activity and Movement, pp 69–70.
in cognitive skills. Only a trend for an association with mental Chaddock L, Erickson KI, Prakash RS, Kim JS, Voss MW, VanPatter M,
health was found, thus not allowing us to infer on the cognitive Pontifex MB, Raine LB, Konkel A, Hillman CH, Cohen NJ, Kramer AF
(2010) A neuroimaging investigation of the association between aerobic
or mental health relevance of this brain pattern.
fitness, hippocampal volume, and memory performance in preadolescent
Overall, our findings lend support to the growing body of evi- children. Brain Res 1358:172–183.
dence demonstrating a close relationship between the body and Chaddock L, Pontifex MB, Hillman CH, Kramer AF (2011) A review of the
the brain. Although the relatively small sample size given the relation of aerobic fitness and physical activity to brain structure and
number of variables of interest and the possible cluster effect of function in children. J Int Neuropsychol Soc 17:975–985.
schools may represent a limitation of this study, here we used Chaddock-Heyman L, Erickson KI, Chappell MA, Johnson CL, Kienzler C,
thorough statistical procedures (i.e., block-aware permutation Knecht A, Drollette ES, Raine LB, Scudder MR, Kao SC, Hillman CH,
testing and leave-one cluster-out cross-validation) to explicitly Kramer AF (2016) Aerobic fitness is associated with greater hippocampal
cerebral blood flow in children. Dev Cogn Neurosci 20:52–58.
deal with this factor, thus producing robust and unbiased statis-
Chappell MA, Groves AR, Whitcher B, Woolrich MW (2009) Variational
tics. Larger samples might provide power to detect multiple Bayesian inference for a nonlinear forward model. IEEE Trans Signal
modes of covariation. Also, the results here reported are correla- Process 57:223–236.
tional; therefore, caution is required in interpreting directional- Cotman C (2002) Exercise: a behavioral intervention to enhance brain health
ity. It is possible that this relationship also represents the other and plasticity. Trends Neurosci 25:295–301.
direction of association, and indeed brain structure, microstruc- Dale AM, Fischl B, Sereno MI (1999) Cortical surface-based analysis: I.
ture, and function are key drivers of behavioral choices. Segmentation and surface reconstruction. Neuroimage 9:179–194.
Nevertheless, our findings suggest that a complex physical phe- de Groot M, Vernooij MW, Klein S, Arfan Ikram M, Vos FM, Smith SM,
Niessen WJ, Andersson JL (2013) Improving alignment in tract-based
notype that is influenced by physiology, and lifestyle choices,
spatial statistics: evaluation and optimization of image registration.
might have widespread effects on biological processes influenc- Neuroimage 76:400–411.
ing brain phenotypes. Future studies may test whether improv- Department of Health and Human Services Office of Disease Prevention and
ing physical health and fitness through means of activity Health Promotion (2000) Healthy People 2010: understanding and
interventions promotes diffuse neuroplasticity. Improving Health. PsycEXTRA Dataset.You can also read