About this Meeting Canadian Science Advisory Secretariat (CSAS) introduction.
←
→
Page content transcription
If your browser does not render page correctly, please read the page content below
About this Meeting
Canadian Science Advisory Secretariat (CSAS) introduction.

1
CSAS Peer Review Process
• Objective is to provide sound, objective and
  impartial science advice.

• The issue of resource allocation is strictly a Resource
  Management consideration, and as such will not be
  part of the discussions at today’s technical briefing.

• Resource allocation considerations will be discussed
  at the upcoming consultations led by DFO’s
  Resource Managers.

2
Outline for today’s Technical Briefing
• The Department’s lead Research Scientist for
  Snow crab, Julia Pantin, will present the
  conclusions from the peer reviewed stock
  assessment process.

• Followed by question and answer period.

• Same presentation will then be given to
  media outlets.

• To be added to the speakers list, please
  raise your hand in Microsoft Teams. If you
  are joining by telephone only, then please
  e-mail Erika to be added to the speakers list.

• If you run into any technical difficulties, you
  can also e-mail Erika or message in the
  Teams chat forum for assistance.
Guidelines for Respectful Meeting
1. Listen to the entire message, without interrupting.
2. Explain why you agree or disagree.
3. Maintain a respectful tone and volume when
   sharing opinions.
4. Be respectful of time when making comments.
5. Value the many different sources of knowledge in
   the room.
6. Turn off your webcam and mute your phone until
   ready to ask a question during the Q&A period.
Technical
Briefing
Snow Crab Stock Assessment
2HJ3KLNOP4R

Newfoundland & Labrador
February 26, 2021

Julia Pantin, Biologist
Outline
•   Purpose of this briefing
•   Key points to understand about Snow crab
•   Science advice
•   How we estimate the Snow crab stock size
•   Stock status
•   Key takeaways
•   Next steps
•   Questions

7
Purpose of this briefing

 • February 16-18, DFO virtually held its Canadian Science
   Advisory Secretariat (CSAS) peer review meeting on Snow
   crab in the Newfoundland and Labrador Region.

 • Science advice on the Snow crab stock was determined at
   this meeting and will be provided throughout this presentation.

                                What is CSAS?
  A national body that oversees the review and provision of science advice to inform DFO
    management decisions. Specifically, this group helps organize meetings where DFO
 scientists, biologists and others, which may include provincial government, fish harvesters,
   Indigenous groups, university researchers, and other technical experts get together to
8 review scientific information and help inform how commercial fish stocks are managed.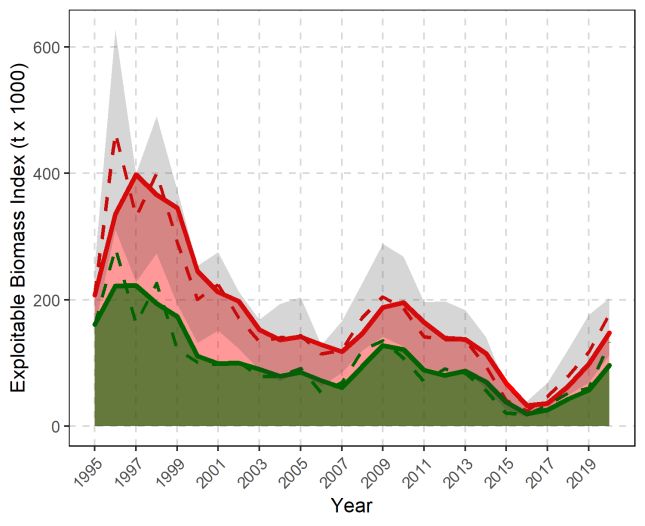
Key points to understand about
Snow crab
• Male Snow crab take approximately 10-13 years to reach
  exploitable size. An additional year is required after they enter
  the fishery to progress from a soft- to hard-shelled condition.

• Snow crab are most common in waters below 2°C.

• Male and female Snow crab terminally molt (i.e., stop
  growing) at 40–150 mm and 30-70 mm carapace width,
  respectively. The smaller females are not affected by fishing.

• Most available information indicates biological productivity
  and fishery success are predominately influenced by climate
  and fishing.

9
Science advice
• The Snow crab stock is managed based on changes to
  exploitable biomass (changes in the overall weight of male
  crab ≥ 95 mm).

• The overall exploitable biomass increased in 2020.

• There are some positive signs for future recruitment.

• We are seeing modest improvements in most Snow crab
  assessment divisions, which are likely to continue in the short-
  term. This stock is continuing to increase from record low
  levels. So, while current trends are positive, the overall stock is
  still not near levels we have seen in past.

10
Science advice

 • All Snow crab Assessment Divisions are above the Limit
   Reference Points.

 • Upper Stock Reference lines defining the cautious and
   healthy zones remain under development through a
   DFO and stakeholder working group.

 • Limit Reference: represents the stock status below which serious harm is
   occurring to the stock. Fishing is to be kept to the lowest possible level
   below the Limit Reference Point.

  • Upper stock Reference: represents a threshold below which catch must
    be progressively reduced in order to avoid reaching the Limit Reference
11  Point.
HOW WE ESTIMATE STOCK SIZE The science behind our advice 12
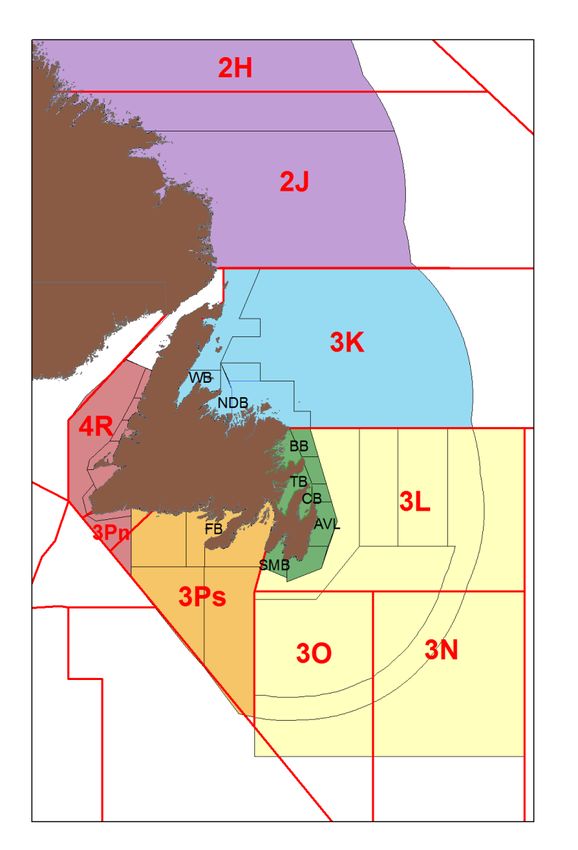
Snow crab management & assessment areas

                   • Snow crab are targeted by
                     the commercial fishery
                     throughout NAFO Divisions
                     2HJ3KLNOP4R (red lines).

                   • The resource is assessed at
                     the Assessment Division
                     scale (coloured blocks) and
                     managed at the Crab
                     Management Area scale
                     (grey lines).

                   • Snow crab assessments
                     occur annually.

13
How we assess
Collaborations
Snow crab - Collaborative Post-season
surveys (catch, maturity, size
frequencies, recruitment,
condition)
DFO Science
Fisheries
- DFO Fall and Spring multispecies
- Reported catch
- DFO Inshore Snow crab surveys
- Logbooks (catch, effort)
(catch, distribution, maturity, size
- Observer (catch, effort, maturity, frequencies, recruitment, predators,
size frequencies) bottom temperatures, condition)
Stock
Assessment
Advice
- DFO Management
- Harvesters, Industry
Stakeholders
14How we monitor changes to the stock • Exploitable Biomass. The estimated combined weight of male crab with a shell width over 94 mm. This is one of the main indicators of the stock status. • Recruitment. The new-shelled male crab available to the fishery for the first time. • Residual Biomass. The weight of intermediate and old-shelled male crab available to the fishery. • Exploitation Rate. The percentage of crab that are removed from the exploitable biomass by fishing. • Assessment Division. Geographic areas divided for the evaluation of stock status. Crab has six Assessment Divisions. 15
STOCK STATUS

16
Overall stock status
       Exploitable Biomass Indices

• The overall stock                  Trawl survey-based                                        Trap survey-based

  exploitable biomass
  index has increased
  in both trawl and
  trap surveys during
  the last 3 years from
  historic lows.

• Overall stock                         Left: Dashed line is annual estimates (red = residuals, green = recruits), shaded area is 2-year moving
  exploitable biomass                   average of annual estimates, and grey band is 95% confidence intervals of annual estimate.
                                        Right: Dashed line is annual estimate, solid line is 2-year moving average, and shaded band is 95%

  indices are near or                   confidence intervals of annual estimate

  below long-term
  average levels.

  17
Overall stock status
Fishery Landings
• Fishery landings increased
from a 25 year low in 2019
to ~ 29,000 t in 2020. This
reflects some increases in
Total Allowable Catches
(TACs).
• Slight increases in landings
have occurred in all
Assessment Divisions except
2HJ (Labrador) and 4R3Pn
(west coast).
18Overall stock status
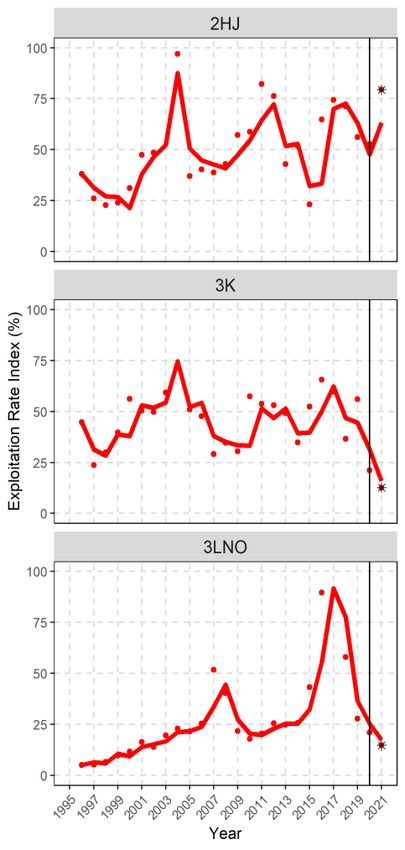
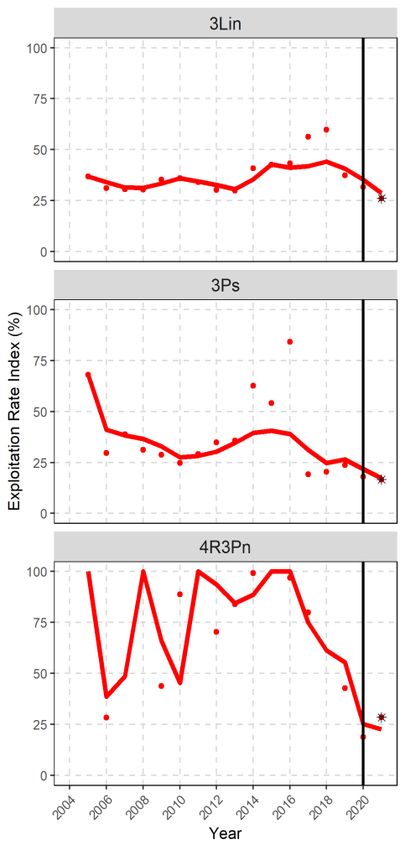
Exploitation Rate Indices
Trawl survey-based Trap survey-based
• Overall, fishing pressure
decreased to its lowest level
in a decade in 2020.
• The exploitation rate – or
percent of crab removed
from the exploitable portion
of the population – was near
time series lows in all
Assessment Divisions in 2020,
with the exception of 2HJ
where exploitation remained
high.
19Overall stock status
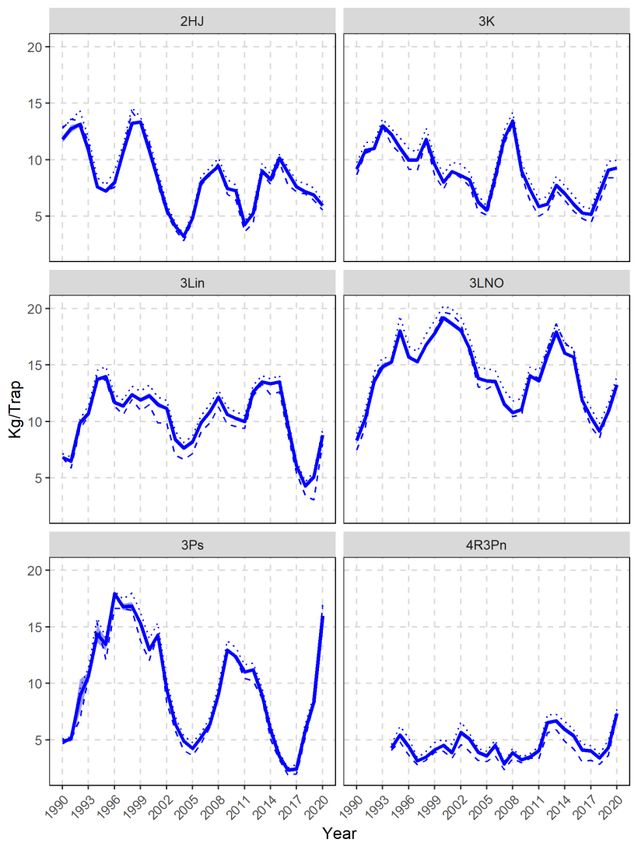
Fishery Catch Per Unit Effort
• Catch Per Unit Effort (CPUE) is a
measure of how much crab is
caught per fishing effort.
• CPUE has increased overall since
2018 and is at or above time
series averages in most
Assessment Divisions.
Solid line is average standardized CPUE, dotted line is average raw
CPUE, and dashed line is median raw CPUE.
20Overall stock status
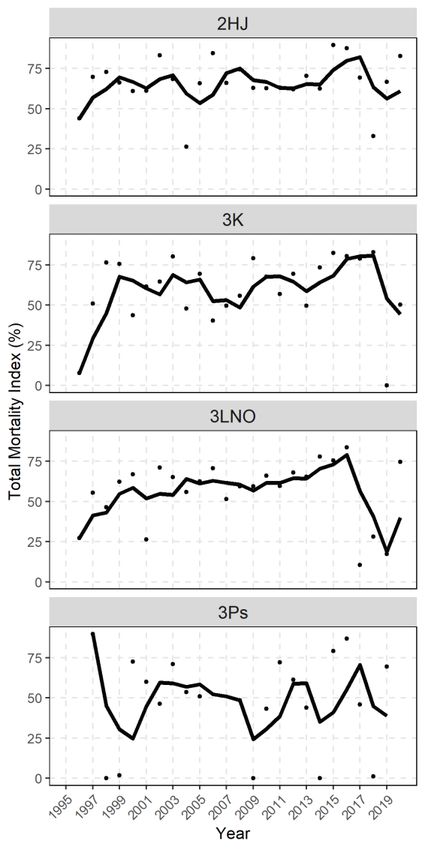
Total Mortality
• Total mortality of exploitable crab
has decreased in all Assessment
Divisions in recent years.
Solid line is 3-year moving average and points
are annual estimates.
21Overall stock status
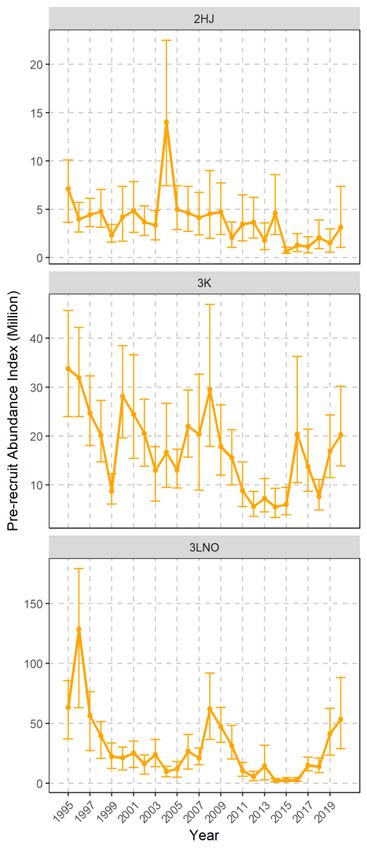
Recruitment Indices Trawl survey-based Trap survey-based
• Recruitment – the
number of new-shelled
crab becoming
available to the fishery –
is expected to increase
over the next two to four
years in most
Assessment Divisions.
• This is due to recent
climate conditions and
increasing numbers of
young, pre-recruitment-
sized crab.
2-4 Year Outlook
22Overall stock status
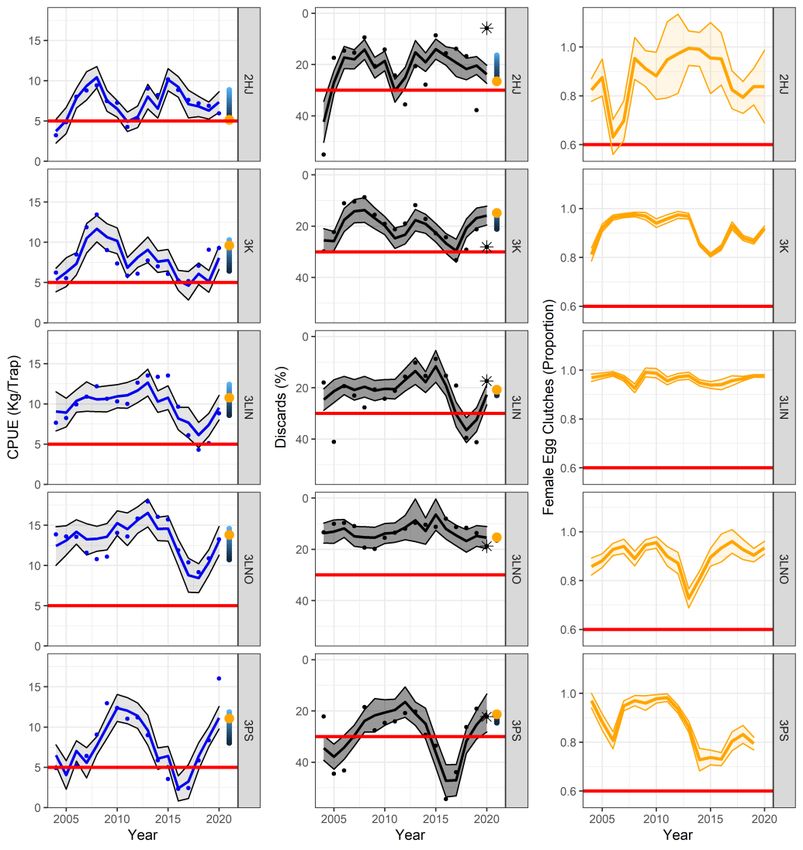
2021 Projections
• In 2021, CPUE, %
discards, and
proportion of females
with full egg clutches
are projected to be
above the Limit
Reference Points (red
lines) in all Assessment
Divisions.
• These projections
assume status quo
landings in 2021.
23Positive indicators for the future
• There are indications that several
ecosystem-related factors may
be encouraging for short-term
growth of the stock, including
cool water temperatures in
previous years and a decline in
finfish predation.
• Recruitment – the number of new-
shelled crab becoming available
to the fishery – is expected to
increase over the next two to four
years in most Assessment Divisions Short-term biomass projection using
due to these recent favourable lagged proxy climate indices
ecosystem-related factors and
increasing numbers of young, pre-
recruitment-sized crab.
So,
24
how was this advice formed?Stock status – 2HJ
Exploitable Biomass & Recruitment
• Both the exploitable
biomass and recruitment
indices have changed little
during the past 16 years.
• Surveys suggest recruitment
will remain low in 2021.
• High fishing pressure, low
residual biomass, declines in
male size-at-maturity and
declines in mature female
abundance are a concern Dashed line is annual estimates (red = residuals, green = recruits), shaded area
in this area. is 2-year moving average of annual estimates, and grey band is 95%
confidence intervals of annual estimate.
25Stock status – 3K
Exploitable Biomass & Recruitment
• Exploitable biomass and
recruitment indices
increased again in 2020.
• Recruitment indices in
the last 2 years suggest
some further increases.
Dashed line is annual estimates (red = residuals, green = recruits), shaded area
is 2-year moving average of annual estimates, and grey band is 95%
confidence intervals of annual estimate.
26Stock status – 3L Inshore Exploitable Biomass & Recruitment • The trap survey-based exploitable biomass index increased from a time series low in 2017-18. • Recruitment into the fishery increased in 2018 from a time series low and remains near low levels in 2020. • Improvements in pre-recruit Dashed line is annual estimate, solid line is 2-year moving average, and abundance in recent years suggest shaded band is 95% confidence intervals of annual estimate there could be improvements in the fishery in 2-4 years. 27
Stock status – 3LNO (Offshore)
 Exploitable Biomass & Recruitment

• The exploitable biomass
  and recruitment indices
  showed an increase in
  2020 nearing time series
  averages.

• Pre-recruit abundance
  indices suggest further
  improvements in 2-4 years.

                                Dashed line is annual estimates (red = residuals, green = recruits), shaded area
                                is 2-year moving average of annual estimates, and grey band is 95%
                                confidence intervals of annual estimate.

28
Stock status – 3Ps
Exploitable Biomass & Recruitment
• The trap survey-based
exploitable biomass index
increased to near a time
series high in 2020.
• Recruitment indices remain
above long-term average
levels suggesting sustained
recruitment.
Dashed line is annual estimate, solid line is 2-year moving average, and
shaded band is 95% confidence intervals of annual estimate
29Stock status – 4R3Pn
Exploitable Biomass & Recruitment
• The trap survey-based
exploitable biomass index has
oscillated throughout the time
series and remained near
time series average levels in
2020.
• Pre-recruitment indices
suggest there may be signs of
improvement in the major
fishing areas in 2-4 years. Dashed line is annual estimate, solid line is 2-year moving average, and
shaded band is 95% confidence intervals of annual estimate
30Key takeaways
• We are seeing modest improvements in most Snow crab assessment
divisions, which are likely to continue in the short-term. This stock is
continuing to increase from record low levels. So, while current trends
are positive, the overall stock is still not near levels we have seen in
past.
• However, we are particularly concerned about 2HJ (Labrador) where
there is persistently high fishing pressure, low residual biomass, declines in
male size-at-maturity and declines in mature female abundance.
• There are indications that several ecosystem-related factors may be
encouraging short-term growth of the stock, including cool water
temperatures in previous years and a decline in finfish predation.
• All Snow crab Assessment Divisions are projected to be above the Limit
Reference Points in 2021.
31Next steps • Stock assessment results will be posted to the CSAS website. • The recent Snow crab stock assessment results will be presented and discussed at industry consultations held throughout the province, which are scheduled to begin on March 1. • DFO senior regional officials will consider information from DFO Science and input from industry in developing future Total Allowable Catch (TAC) and other management actions. 32
QUESTIONS?

33
You can also read


