Absolute Clean Energy Public Company Limited - Brief Company Information October 2019
←
→
Page content transcription
If your browser does not render page correctly, please read the page content below

Absolute Clean Energy Public Company Limited
Brief Company Information
October 2019
Disclaimer
This presentation is for information purposes only and does not constitute or form whole or part of any offer, invitation or solicitation by or on behalf of the Company for sale or
subscription of or solicitation or invitation of any offer to or recommendation to buy or subscribe for any securities of the Company, nor shall it or any part of it form the basis of or
be relied on in connection with any contract, commitment or investment decision in relation thereto (“Securities”) in Thailan d, the United States or any other jurisdictions. Any
recipient considering a purchase of Securities is hereby reminded that any such purchase should be made solely on the basis o f the information contained in a final offering
document (which may be different from the information contained in this presentation ) and subject to the selling restriction s set out therein. No public offering of the Securities will
be made in the United States or in any other jurisdiction outside of Thailand where such an offering is restricted or prohibi ted. This presentation should not be construed as legal,
tax, investment or other advice. The information contained herein does not take into consideration the investment objectives, financial situation or particular needs of any particular
investor, and should not be treated as giving investment advice.

In addition, this presentation contains certain financial information and results of operation, and may also contain certain projections, plans, strategies, and objectives of the
Company, that are not statements of historical fact which would be treated as forward looking statements that reflect the Company's current views with respect to future events and
financial performance. These views are based on a number of estimates and current assumptions which are subject to business, economic and competitive uncertainties and
contingencies as well as various risks which are in many cases beyond the control of the Company, and which may change over time and may cause actual events and the
Company's future results to be materially different than expected or indicated by such statements. No assurance can be given that future events will occur, that projections will be
achieved, or that the Company's assumptions are correct. Such forward‐looking statements are not guarantees of future performance and accordingly, the actual results, financial
condition, performance or achievements of the Company may differ materially from those anticipated by the Company in the forward looking statements. The recipient is cautioned
not to place undue reliance on these forward looking statements.

In providing this presentation, the Company does not undertake to provide any recipient with access to any additional informa tion or to correct any inaccuracies herein which may
become apparent.

2
Table of Contents

     I    Company Overview

    II    Industry Overview and Growth Potential

    III   Company Core Competitive Advantages

    IV    Financial Highlights

    V     Key Takeaways

3
Company Overview
Company Overview
Who is ACE?

                     40 Years Strong foundation in Integrated Agricultural Industry

       “To be the world practical model of Clean energy powerplant, which is responsible for
                              environment, society, and shareholders”
               “เป็ นโรงไฟฟ้าพลังงานสะอาดต้ นแบบของโลกที่มีความรับผิดชอบต่ อสิ่งแวดล้อม สังคม และผู้ถือหุ้น”

              Thailand’s Current Largest “Professional-Run” Biomass Power Producer

                           Thailand’s Leading Renewable Power Producer

                                    The Green & Clean Energy Leader

5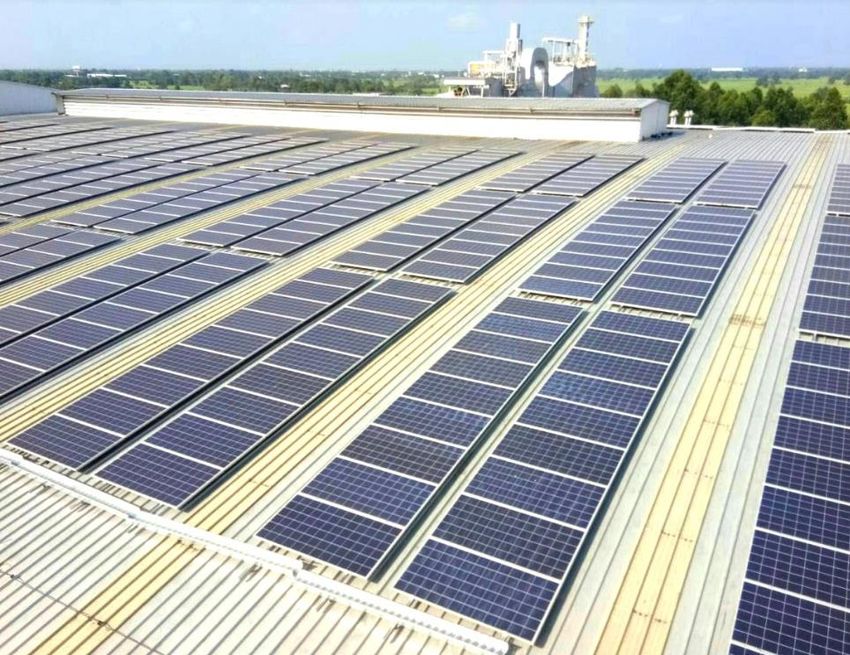
Company Overview
ACE at a Glance

                      Strong foundation          Abundant biomass feedstock
Innovative         of Major Shareholder in    support from community surrounding
  Private          Integrated Agricultural               the power plants
  Power                    Industry
 Producer
    for
 Absolute
  Clean
  Energy

    Ongoing Improvement with
      Innovative Technology

                                             Innovative Technology and
                                               Experienced R&D Team

6
Company Overview
ACE at a Glance

                                 32+1 Power Plants/1                                                       Biomass (9+14+1)/1
                                   (13 in Operations)                                                             291.0 MW/1
                                     411.47+9.9 MW/1
Innovative
  Private
  Power
 Producer
    for                                                                                                                                             MSW (1+1)
 Absolute                                                                                                                                            11.0 MW
  Clean
  Energy
                          Solar (2+4)
                            5.02 MW

                                                              Co-generation (1+0)
                                                                      114.35 MW
                                                                                                                                   Expected Installed Capacity
                                                                                                                                   1 GW (Gross)
                                                                                                                                   +36% MW CAGR/2

    Remark: /1 Including APP’s capacity MW of 9.9, Currently, APP’s shareholders sent LOI for APP share purchase proposal to ACE
7           /2 Compound Annual Growth Rate in term of MW from 2019-2024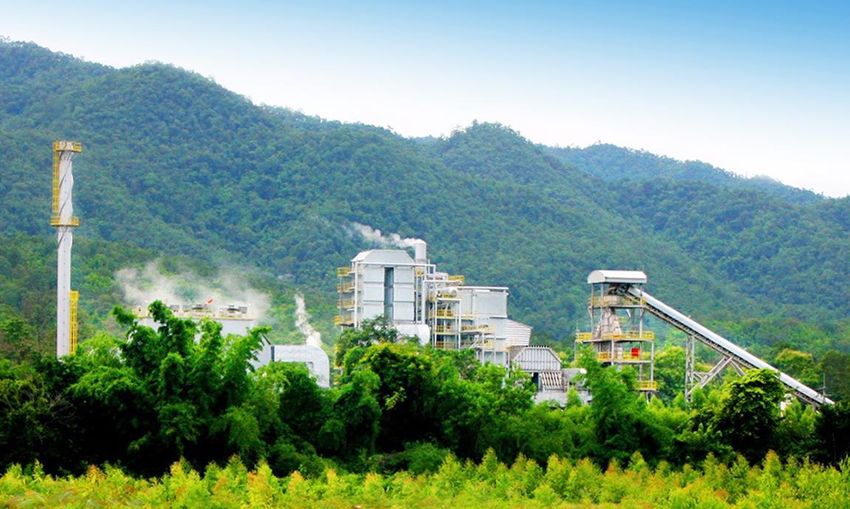
Company Overview
ACE’s Biomass Powerplant (9+14+1, 291 MW)/1,/2

                     ACP1 Ban Bueng                                            ALCP1 Sri Chiang Mai                                AAPP2 Chokchai

                      ACP2 Ponthong                                               ALCP2 Sirinthorn                                 AAP1 Nam Pong

                       ACP3 Bo Ploy                                                  AAPP1 Tanee                                     ABA1 Thern

    Remark: /1 Including APP’s capacity MW of 9.9, Currently, APP’s shareholders sent LOI for APP share purchase proposal to ACE
8           /2 Capacity MW
Company Overview
ACE’s MSW Powerplant (1+1, 11MW)/1

                                 MSW Khon Kaen

    Remark: /1 Capacity MW
9
Company Overview
ACE’s Co-generation Powerplant (1+0, 114.35 MW)/1

                                  AAA Chachoengsao
     Remark: /1 Capacity MW
10
Company Overview
ACE’s Solar Powerplant (2+4, 5.02 MW)/1
Remark: /1 Capacity MW
11Company Overview
ACE at a Glance
>90% Capacity Factor/1 Feedstock Burn Capability
Biomass: 97% > Listed Peer : 96% ACE: Up to 65% moisture
MSW: 95% > Listed Peer : 72% content/2 of mixed
Innovative Cogeneration: 82% > Listed Peers: 81%
fuel
Private Others: Up to 40%
Power
Producer
Unit : MW
for
Absolute
Clean 76
Energy
196
Largest Portion Bidding Winner in
the SPP Hybrid Firm Bidding
Source: ERC, company website/annual report
12 Remark: /1 Average capacity of all powerplant type of ACE Strictly Private & Confidential
/2 Feedstock burn capacity for biomass powerplantCompany Overview
ACE’s Key Development Milestones
“To be the world practical model of Clean energy powerplant, which is responsible for environment, society, and shareholders”
2017: 2022:
2012: 2016: Estimated to
Won and secured 4
First COD of VSPP First COD of VSPP COD all
SPP Hybrid Bidding
“ACP1” Biomass “ALCP” MSW Power projects/2
of total 93 capacity
Power Plant Plant (421.37 MW)/3
MW
1979/1 (40 years 2015: 2017: 2018: 2024:
ago): Shaiyo Triple Established First COD of SPP First COD of VSPP Expected to secure
A Group Absolute Clean “AAA” Cogeneration Solar Rooftop an installed capacity
Board of directors Energy (ACE) as a Power Plant of 1,000 PPA MW
have experienced to Holding Company and becomes
lead rice, corns, with initial paid-up Thailand’s largest
cassavas and capital of THB 0.5 biomass power
woodchips producer mm. producer
and exporter, has ACE’s Total Capacity MW/3 over time
expertise in
agriculture industry 1,000
Unit: MW
and R&D in the fast
growing tree and
intrigued in exploring
the energy sector.
421.37 421.37 421.37
214.47
209.5 210.5 212.2
85.2
2016 2017 2018 2019 2020 2021 2022 2024
Remark : /1 http://www.saaa.co.th/SAA_ENG/home.php
/2 Estimated timeline: Currently, Arbitration result states that PEA has to return PPA to ACE and with the assumption that normally power project’s
13 construction period is approx. 2 years
/3 Including APP’s capacity MW of 9.9, Currently, APP’s shareholders sent LOI for APP share purchase proposal to ACECompany Overview
Overview of ACE’s Portfolio
ACE Business Portfolio in Thailand
Power Type
Biomass Co-generation MSW Solar
ACE’s Holding
100.0% 100.0% 100.0% 100.0% 100.0%
Stake in Projects
Existing + Pipeline COD: 13
9+14+1/1 1+0 1+1 2+4 Pipeline: 20/1
Projects
Total: 33/1
Capacity MW 89.1 COD: 211.18
1.73
(Total Capacity 114.35 5.0
6.0
3.29
Pipeline: 210.19
/1
MW) 201.9
Total: 421.37
Total: 291.0/1 Total: 114.35 Total: 11.0 Total: 5.02
PPA MW to 72 1.73 COD: 168.23
/1 90 4.4 4.5
Government & IU 164.31 3.29 Pipeline: 172.00
(Total PPA MW)
Total: 236.31/1 Total: 90 Total: 8.9 Total: 5.02/2
Total: 340.23
Existing Under Development + Pending for Development
14 Remark: /1 Including APP’s capacity MW of 9.9. Currently, APP’s shareholders sent LOI for APP share purchase proposal to ACE Strictly Private & Confidential
/2 Electricity Sale Agreement (ESA) with IUCompany Overview
Well-Balanced Portfolio with Diversified Locations
Assets Overview Installed/ Equity COD / SCOD
Type PPA MW Location Status
MW Date
Khonkaen: 1 VSPP - Biomass 9.9 8.0 Chonburi 24/04/2012
Operating projects
• No. 2 and 9 Under development projects and
Pracheenburi: 2 VSPP - Biomass 9.9 8.0 Khonkaen 02/05/2012
Pending for development projects
• No. 25 3 VSPP – Biomass 9.9 8.0 Surin 30/10/2012
1 4 VSPP – Biomass 9.9 8.0 Nakhon Ratchasima 16/01/2013
Chachoengsao:
• No. 10
5 VSPP – Biomass 9.9 8.0 Roi-et 04/06/2013
Existing 6 VSPP – Biomass 9.9 8.0 Nongkhai 26/12/2013
Projects
Nongkhai: 7 VSPP – Biomass 9.9 8.0 Lampang 09/07/2014 COD
• No. 6
Lopburi: (13 Projects) 8 VSPP – Biomass 9.9 8.0 Ubonratchathani 14/08/2015
Lampang: Roi-et:
• No. 7
• No. 24 9 VSPP – MSW 6.0 4.5 Khonkaen 29/11/2016
• No. 5
10 SPP - Cogen 114.35 90.0 Chachoengsao 10/02/2017
Kampangphet: Amnatcharoen: 11 VSPP – Biomass 9.9 8.0 Kanchanaburi 16/08/2017
• No. 17, 18 • No. 23 12 VSPP – Solar Rooftop 1.0 Chonburi 20/11/2018
• SPP – Hybrid 13 VSPP – Solar Rooftop 0.73 Nakhon Ratchasima 22/02/2019
4 SPP – Hybrids 93.0 76.31 2021 EIA process
Ubonratchathani:
• No. 8
15 VSPP – MSW 5.0 4.4 Krabi 2021 Under Construction
Kanchanaburi: Quality
• No. 11 16 1 Solar Rooftop 1.0 Chonburi 2019 assessment /under
Srisaket:
construction
• No. 26
Supanburi:
17 VSPP – Biomass 9.9 8.0 Kampangphet Within 2022
• No. 19 18 VSPP – Biomass 9.9 8.0 Kampangphet Within 2022
Surin:
2 19 VSPP – Biomass 9.9 8.0 Supanburi Within 2022
• No. 3
Ranong: 20 VSPP - Biomass 9.9 8.0 Nakornpathom Within 2022
• SPP - Biomass Under Under negotiation
21 VSPP - Biomass 9.9 8.0 Nakhon Ratchasima Within 2022
Nakhon Ratchasima: Development SCOD/2
22 VSPP - Biomass 9.9 8.0 Chonburi Within 2022
Nakornpathom: • No. 4, 13 ,21,29 and 30 and
• No. 20 pending for 23 VSPP - Biomass 9.9 8.0 Amnatcharoen Within 2022
Samut Sakhon:
• No.28 development 24 VSPP - Biomass 9.9 8.0 Lopburi Within 2022
Krabi: (20 projects) 25 VSPP - Biomass 9.9 8.0 Pracheenburi Within 2022
Chonburi:
• No. 15 Under
• No. 1, 12, 16,22, 27
consideration of
26 VSPP – Biomass 9.9 8.0 Srisaket Within 2022
Administrative
Court
Nakhon Si Thammarat:
• 2 SPP - Biomass Under negotiation
27 VSPP – Biomass/1 9.9 8.0 Chonburi Within 2022
COD Biomass SCOD/2
SCOD Biomass SCOD MSW 28 1 Solar Rooftop 0.83 Samut Sakhon 2020 Under construction
29 1 Solar farm 0.77 Nakhon Ratchasima 2020 Under construction
COD Cogeneration SCOD 4 SPP-Hybrid
30 1 Solar farm 0.69 Nakhon Ratchasima 2020 Under construction
COD MSW Solar
Total Projects 421.37 335.21
Source: Company information as of 28 August 2019
15 Remark: /1 Including APP’s capacity MW of 9.9, Currently, APP’s shareholders sent LOI for APP share purchase proposal to ACE
/2 Estimated timeline: Currently, Arbitration result states that PEA has to return PPA to ACE and with the assumption that normally power project’s construction period is approx. 2 yearsCompany Overview
ACE’s Group Structure
(Holding Company)
COD
Under Development +
Pending for Development
100%
Asia Clean Energy (“ASCE”)
(Holding Company)
Operating Company
100% 100% 100% 100% 100% 100% 100% 100% 100% 100% 100% 100%
Advance
Advance Alliance Advance Asia Advance Bio Advance Bio Advance Prasatporn Advance Power
Agro Power ACE Solar
Clean Power Clean Power Power Plant Asia Farm Tree Powerplant Agro Asia Rungrueng Power Plant Supply and
Plant (“ACE Solar”)
(“ACP”) (“ALCP”) (“AAP”) (“ABA”) (“AFT”) (“BPP”) (“AAA”) (“PSPR”) (“APP”)/1 Maintenance
(“AAPP”)
Service
Operating Assets (“PSMS”)
7 VSPP 4 VSPP + 2 MSW 3 VSPP 1 VSPP 1 VSPP 1 VSPP 2 SPP +1 VSPP 2 SPP + 6 VSPP 1 SPP 1 VSPP 1 VSPP
(69.3 MW) (50.6 MW) (29.7 MW) (9.9 MW) (9.9 MW) (9.9 MW) (54.9 MW) (53.02 MW) (114.35 MW) (9.9 MW) (9.9 MW)
ACP 1 ALCP 1 AAPP 1 AAP 1 ABA1 Rooftop AAA 1
AFT 1 BPP 2 1 PSPR 1 APP 1
(Apr 12) (Dec 13) (Oct 12) (May 12) (Jul 14) (Nov 18) (Feb 17)
ACP 2 ALCP 2 AAPP 2 Rooftop
BPP 3 2
(Jun 13) (Aug 15) (Jan 13) (Feb 19)
ACP 3 ALCP 3 ACE
AAPP 3 BPP 1
(Aug 17) (Nov 16) SOLAR 1
ACP 4 ALCP 4 ACE
SOLAR 2
ACP 5 ALCP 5 Rooftop 1
expansion
ACP 6 ALCP 6 Rooftop 2
expansion
ACP 7 Farm 1
expansion
Farm 1
expansion
16
Remark: /1 Including APP’s capacity MW of 9.9, Currently, APP’s shareholders sent LOI for APP share purchase proposal to ACECompany Overview
ACE’s Board of Directors
PRANAI SUWANRATH,
Independent Director
Chairman of the Board of Directors
• Current: The Thai Red Cross- Director
• Ex-Chairman of the BOD, MEA
• Ex-Permanent secretary of the Ministry of Interior
CHAROON INTACHAN, CHONTICHA CHITRARPORN, PATCHANEE SUTHEEVITANUNT,
Independent Director Independent Director Independent Director
• Current: Office of the Council of State- Council Chairman of Audit Committee Audit Committee, Chairman of Nomination &
Committee • Current: Advance Life Assurance- Remuneration Committee
• Ex-President of the Constitutional Court Independent Director / Chairman of the Risk • Current: Advance Life Assurance – Audit
• Ex-Secretariat of the House of Management Committee Committee
Representatives- Constitution Drafting • Current: Dhanarak Asset Development – • Experience: Government Pension Fund- Assistant
Committee Risk Management Committee Secretary General
• Ex-Justice of The Supreme Court
• Ex-Justice of The Supreme Administration
Court
NUEKRAK BAINGERN, JIRATHA SONGMETTA, TANAVIJIT ANKAPIPATCHAI,
Independent Director Director Director
Audit Committee, Nomination & Chairman of Executive Committee, CFO, Management Committee
Remuneration Committee Nomination & Remuneration Committee • Current: Inter Care & Service- Director
• Current: Advance Life Assurance- • Experience: Double A (1991) – Director • Experience: Shaiyo AA- Executive Director
Chairman of the Audit Committee • Experience: Thai Power Supply - Director • Experience: Advance Agro Asia- Co-CEO
• Experience: CIMBT- Executive Vice • Experience: 304 Industrial Park - Director
President- Operation
TEERAWUT SONGMETTA, PORNMETT SONGMETTA, TANACHAI BUNDITVORAPOOM,
Executive Director Executive Director Director
Chief Technology & Innovation Officer Chief Operation Officer CEO, Management Committee
• Current: Songmetta Corporation- • Current: Songmetta Corporation-Director • Current: Synergetic Auto Performance-
Director • Experience: Asia Clean Industrial Park – Director/the Nomination and Remuneration
• Experience: Advance Agro Asia- Director Committee
Director • Experience: TISCO Securities- First Senior Vice
President- Head of Investment Banking
17Company Overview
ACE’s Strategy, Core Value & Competency
ACE’s Core Competency ACE’s Core Value Operation
สร ้างประสิทธิภาพ
ส่งเสริมพัฒนา
Sustainable ทีมงาน สะสาง
growth
สร ้างสรรค ์ความ
ปลอดภัย 9ส สะดวก
Research & Innovation for สร ้างนิ สย
ั
Development production
Efficiency สะอาด
Improvement ใส่ใจ
่
สิงแวดล้ อม สร ้างนิ สย
ั
สุขลักษณะ
ACE’s Strategy ACE’s Corporate Culture
Development for Stakeholders Wisdom
Empower
Production
Profitability
Innovation Result
for Efficiency
with CSR Synergy ACE’s
Oriented
Systemetic
Managerial Sustainable
Potential Social Growth
Management Honest
Development Long Term Responsibility
Feedstock
Sustainability Adaptability
Development
Plan
Enterpreneur
18Table of Contents
I Company Overview
II Industry Overview and Growth Potential
III Company Core Competitive Advantages
IV Financial Highlights
V Key Takeaways
19Industry Overview and Growth Potential
Industry Overview and Growth Potential
Electricity Consumption, Resilience Growth Throughout Country Crisis
                                                      Electricity consumption is gradually growing amid the country’s instability

World Electricity Consumption
Unit: tWh
    25,000

    20,000

    15,000

    10,000

      5,000

         -
                     2008              2009             2010             2011              2012             2013             2014             2015            2016            2017                2018

Thailand Electricity Consumption VS SET index
                                                                                                                                                                                                           SET Index
 Unit: tWh
                                                                                                                                                                                                                 2,000
       400
                                                                                                                                                                                                                 1,600
       300

                                                                                                                                                                                                                 1,200
       200

       100                                                                                                                                                                                                       800

          0                                                                                                                                                                                                      400
                    2008              2009             2010             2011              2012              2013             2014            2015            2016            2017                 2018

              - A crisis in the   - Red Shirt start - Red Shirt took   - Major        - Flooding attack - Year of GDP     - Bangkok       - Bomb at      - High market     - Certain           - Uncertainty
                sub-prime           protesting and    over the           flooding       the Southern      Curtailment       Shutdown        Ratchaprasong volatility due     market              from interest
                mortgage            stormed a hotel   Ratchaprasong      around         part of                                                            to domestic       volatility with     rate hike by
                                                                                                        - Anti-Gov’t by   - Military
                market in USA       in Pattaya that - State of           Bangkok        Thailand                                                           unprecedente      improved            FED
                                                                                                          PDRC              Government
                (Hamburger          was the venue     Emergency          Metropolitan                                       in action                      d negative        market
                Crisis)             for ASEAN         announced by       Area                                                                              factor            condition
                                    summit                                                                                - Coup d’etat
                                                      Thai Gov’t

21 Source : Global Energy Statistical 2018
Industry Overview and Growth Potential
Global and Domestic Trend to Support Renewable Energy
Paris Agreement: Around 88% of the world have ratified or acceded to the Agreement. Thailand government has ratified the agreement.
Ratified
Signed
Not Signed/Withdrawing
World Zero Carbon: Government around the world is collaborating to aim for net zero carbon by 2050.
Norway France California United Kingdom
Sample
Approach from
Countries and
States:
Target Date: 2030 Target Date: 2050 Target Date: 2045 Target Date: 2050
Status: In law Status: In law Status: Executive Order Status: In law
EV Revolution: EV trend is coming with 1) Fossil fuel vehicle bans 2) Renowned automakers are making promises on EV
United Kingdom France Netherlands
Parliament voted
Announced end Announced end
through motion to
sales of gas and sales of gas and
end all gas and
diesel cars by 2040 diesel cars by 2040 Plans to sell only 100% EV or hybrid/electric onward
diesel car by 2025
22 Source : Paris Agreement, Climate change, VoxIndustry Overview and Growth Potential
International and Domestic Trend to promote and support Renewable Energy
Paris Agreement
Set a global goal to reach zero carbon emissions in the second half of the century
Thailand
Constitution of the Kingdom of
Reformation Plan of the Country PDP 2018 Proposal
Thailand
Section 72(5): To promote energy Set up biomass quality and pricing Recently, Ministry of Energy has
conservation and cost-effective use standard and develop market informed that there could be
of energy, as well as to develop and Initiate database of biomass adjustment to the PDP 2018 where
support the production and use of producer renewable portion could increase
alternative energy to enhance Study/develop technology to even further.
sustainable energy security. transform biomass feedstock for A professor from Thailand’s leading
Thus, current and ongoing value added institution has proposed an opinion
government policies and actions Encourage firm contract for biomass of increasing the renewable portion
shall comply with this Section. power plant PPA up to 40%.
Global and domestic trend are in the same direction to promote and support “Renewable Energy”
23Industry Overview and Growth Potential
Constitution of the Kingdom of Thailand, 20 years National Strategy, Country
Reformation and Government Commitment to Support Renewable Energy
ตามร ัฐธรรมนู ญแห่งราชอาณาจ ักรไทย หมวดที่ 6 แนวนโยบายแห่งร ัฐ
ข้อ 5 ส่งเสริมอนุ ร ักษ ์พลังงานและการใช้พลังงานอย่างคุม ้ ฒนาและสนับสนุ นให้มก
้ ค่า รวมทังพั ี ารผลิตและการใช้พลังงานทางเลือก
่ ่
เพือเสริมสร ้างความมนคงทางด้
ั ่ น
านพลังงานอย่างยังยื
่ มข
ประเทศไทยต้องดาเนิ นการตามข้อตกลงระหว่างประเทศทีได้ ี อ ่ ยวข้
้ ผู กพันไว้ในเวทีโลกทีเกี ่ ่
องก ับสิงแวดล้
อม
1 2 3 4 5
• ร ัฐบาลจะพัฒนาอุตสาหกรรม • สนับสนุ นให ้เกิดโครงสร ้างตลาด • แก ้ไขปัญหาก๊าซเรือนกระจกและ • ่
การจัดการขยะหรือของเสียเพือ • นโยบายเร่งด่วนของร ัฐข ้อ 4
ภายใต ้แนวคิดเศรษฐกิจชีวภาพ/ ไฟฟ้ ารูปแบบใหม่ อาทิเช่น ่
ผลกระทบจากการเปลียนแปลง นาไปใช ้ในกระบวนการผลิตและ
เศรษฐกิจหมุนเวียนและเศรษฐกิจ แพลตฟอร ์มตลาดกลางซือขาย ้ ของสภาพภูมอ ิ ากาศ ทาให ้เกิดประโยชน์จาก • ให ้ความช่วยเหลือเกษตรกร
สีเขียว (Bio-Circular Green พลังงานไฟฟ้ า ทร ัพยากรอย่างคุ ้มค่า
Economy) ส่งเสริมการใช ้ • โดยมุ่งเน้นการลดการปล่อยก๊าซ • ส่งเสริมเกษตรพันธสัญญา
พลังงานทดแทน การใช ้ประโยชน์ • ส่งเสริมการผลิตและการใช ้ เรือนกระจก สร ้างสังคมคาร ์บอน • แก ้ไขปัญหาการจัดการขยะและ
จากวัสดุเหลือใช ้ทางการเกษตร พลังงานทดแทนตามศักยภาพ ต่าและปลอดฝุ่ นละอองขนาดไม่ ของเสียอย่างเป็ นระบบ • ส่งเสริมการใช ้ผลผลิตทาง
่ ลค่า
มาเพิมมู ้
ของแหล่งเชือเพลิ ้ ่
งในพืนที เกิน 2.5 ไมครอน (PM 2.5) การเกษตรในอุตสาหกรรม
• พัฒนาโรงงานกาจัดขยะและของ พลังงาน
่ ้มาตรฐาน
เสียอันตรายทีได
ร ัฐบาลสนับสนุ นการเพิมก่ าลัง บริษท
ั ผู ้ผลิตไฟฟ้ าสามารถขาย บริษท ั สามารถขยายหรือเพิม่ บริษทั สามารถขยายหรือเพิม่ โรงไฟฟ้ าชีวมวลของบริษท ั
การผลิตของโรงไฟฟ้ าชีวมวลและ ไฟฟ้ าให ้ผู ้ใช ้ไฟฟ้ าได ้โดยตรงทัง้ กาลังการผลิตในอนาคตได ้อีก กาลังการผลิตของโรงไฟฟ้ าขยะ ้
สามารถหาเชือเพลิ งคุณภาพสูง
โรงไฟฟ้ าจากขยะชุมชน ในช่วง peak และ off-peak มากเพราะเป็ นผู ้นาของตลาด ่
ได ้มาก เพราะมีความเชียวชาญ และต ้นทุนต่าได ้มากยิงขึ
่ น้
เนื่ องจากโรงไฟฟ้ าชีวมวลสร ้าง ่
เกียวกั บโรงไฟฟ้ าชีวมวลและ ่
อย่างมืออาชีพเกียวกับโรงไฟฟ้ า
รายได ้ให ้กับเกษตรกร โรงไฟฟ้ าชีวมวลสามารถ ขยะ
แก ้ปัญหาเรือนกระจกและสร ้าง
สร ้างสังคมคาร ์บอนต่าและปลอด
ฝุ่ นละอองได ้
24 Source : Constitution of the Kingdom of ThailandIndustry Overview and Growth Potential
Total Societal Impact(TSI) and Environmental, Social and Government (ESG)
Biomass Powerplant
Contribute to the Paris Agreement Decreasing Greenhouse Gas Emission.
Future Potential To provide base-load to grid instead of conventional energy
• Saves government’s spending on putting down forest fires and farm fires
Solves PM 2.5 problem at the root
• Saves government’s spending on PM 2.5 related health problems such as respiratory
complications, masks distributions, water spraying in cities, etc.
• Prevents economic loss from the decrease in tourism due to PM 2.5 problem
• Additional income to farmers
• Stabilize income for farmers under market uncertainty → reduce empty subsidies that government
Positive Economic and Societal have to give out
Impact • Stabilize electricity price preventing electricity price from increasing in the future
• Distribution of revenue to grassroots : Shift from LNG import from the Middle East to purchasing fuel
from Thai farmers
GDP Contribution/1 1.8 Billion THB / year / 9.9 MW biomass power plant
MSW Powerplant
Contribute to the Paris Agreement decreasing Greenhouse Gas Emission.
Future Potential To provide base-load to grid instead of conventional energy
Solves MSW mountain problems Save healthcare and environmental spending for government from problems caused by MSW in landfills
25 Source: Thailand Energy AcademyIndustry Overview and Growth Potential
Renewable Energy Contribute Largest Portion (37%) of Increased Capacity
According to the Power Development Plan (PDP) 2018 hearing, Renewable Energy is targeted to contribute the largest portion, or 37%,
of the total new increased capacity by 2037.
Potential MW during 2017-2037 PDP 2018 New Installing Capacity for the Next 20 Years (MW)
Up to ~105,000 Potential MW within 20 years Largest portion of increased capacity (37%) come from renewable
Unit : MW PDP2018 With EV Potential/1
+49,429 126,640 Pumped storage hydropower
Cogeneration
+56,431 -25,310 4% Lignite or coal-fired 1%
3%
Saving programme
77,211 7%
1
Renewable
46,090 Imports
10% 37%
New or
replacement
power plants
15% Combined cycle
23%
Total New installing Retiring Total Potential Total
Electricity capacity for capacity in Electricity MW from Electricity
Capacity the next 20 the next 20 Capacity in EV/1 Capacity
as of 2017 years years 2037 with EV
Potential in
2037
26 Source: Power Development Plan (PDP) 2018
Remark: /1 Based on crude oil used for in-land transport data in 2018 (EPPO) converted into Barrel of Oil Equivalent (BOE) with 35% cusionIndustry Overview and Growth Potential
Renewable Energy Contribute Largest Portion (37%) of Increased Capacity
According to the Power Development Plan (PDP) 2018 hearing, Renewable Energy is targeted to contribute the largest portion, or 37%,
of the total new increased capacity by 2037.
Potential MW during 2017-2037 PDP 2018 New Installing Capacity for the Next 20 Years (MW)
Up to ~105,000 Potential MW within 20 years Largest portion of increased capacity (37%) come from renewable
Unit : MW PDP2018 With EV Potential/1
+56,431 MW
+49,429 126,640 Pumped storage hydropower
Cogeneration
+56,431 -25,310 4% Lignite or coal-fired 1%
3%
Saving programme
77,211 7%
1
Renewable
46,090 Imports
10% 37%
New or
replacement
power plants
15% Combined cycle
23%
Total New installing Retiring Total Potential Total
Electricity capacity for capacity in Electricity MW from Electricity
Capacity the next 20 the next 20 Capacity in EV/1 Capacity
as of 2017 years years 2037 with EV
Potential in
2037
27 Source: Power Development Plan (PDP) 2018
Remark: /1 Based on crude oil used for in-land transport data in 2018 (EPPO) converted into Barrel of Oil Equivalent(BOE) with 35% cusionIndustry Overview and Growth Potential
Renewable Energy will provide 46% of Thailand’s Electricity by 2037
Renewable energy portion will move from 26% in 2018 to 46% in 2037
% Electricity Capacity by Source of Total Capacity for 2018 and 2037 Electricity Capacity of Each Renewable Source for 2017 and 2037/1
% Installed Capacity Unit: MW
1%
389%
13%
12,573
2018 13%
48%
73%
Renewable 8,357
Conventional 211%
Hydro
5,632
5,155
Others
6% 252%
2,573
2,075 254% 178%
1,659
32% 48% 852
2037 590 619
306
175
2017 2037 2017 2037 2017 2037 2017 2037 2017 2037 2017 2037
14% Solar Biomass Hydro Wind Waste Biogas
28 Remark : /1 Excluding retiring capacity in the next 20 years
Source: Power Development Plan (PDP) 2018Industry Overview and Growth Potential
Biomass : The largest renewable energy contributor in Thailand
Looking at GWh contribution to grid, Biomass is the largest contributor to renewable energy growth in Thailand
Electricity contribution/1 of Each Renewable Source of from 2017 to 2037/2
Unit: GWh
45,000
39,740
40,000
35,140
35,000
30,000
25,000 23,682
22,027
20,000
15,000 12,790
10,000
5,822
4,507 4,544 3,958
5,000 2,091
1,291 1,119
-
2017 2037 2017 2037 2017 2037 2017 2037 2017 2037 2017 2037
Solar Biomass Hydro Wind Waste Biogas
Capacity factor applied to each plant type
20% 88% 48% 25% 73% 78%
Remark : /1 Assume 365 days, 24 hours and specific capacity factor of each plant type for electricity contribution calculation
/2 Excluding retiring capacity in the next 20 years
29 Source : Power Development Plan (PDP) 2018
Average capacity factor of each power type from EGAT, EIAIndustry Overview and Growth Potential
ACE’s Historical, Current and Future Growth
Continuous growth with existing PPA along with future potential growth supported by favorable government renewable energy policy
Existing and Pipeline of Company’s MW/1,/2
Existing, Under-Development and Pending for Development projects
Future Projects to reach company goal
1,000
421.37 421.37
421.37
214.47
209.5 210.5 212.2
85.2
2016 2017 2018 2019 2020 2021 2022 2024
Source: Power Development Plan 2018
30 Remark: /1 Including APP’s capacity MW of 9.9, Currently, APP’s shareholders sent LOI for APP share purchase proposal to ACE
/2 Estimated timeline : Currently, Arbitration result states that PEA has to return PPA to ACE and with the assumption that normally power project’s construction period is approx. 2 yearsIndustry Overview and Growth Potential
Future Growth
Continuous growth with existing PPA along with future potential growth supported by favorable government renewable energy policy
Existing and Pipeline of Company’s MW/1,/2 2025 – 2037 Contract Capacity MW according to PDP 2018
Biomass
Existing
Biogas
Under-Development and Pending for Development
MSW 35 44
Future Growth acc. to plan Industrial Waste 21
343 371
6
314
286 546 546
257
546
514 546
229
200 399
335
171
244 3,376 3,376
143 3,176
2,891 2,950
244
114 2,117
209 1,920
86 1,530
29 57 174 1,221
105 139 834
348 377 481
1,000
2025 2026 2027 2028 2029 2030 2031 2032 2033 2034 2035 2036 2037
209 209 209 209
2
212 212 212 212 212 212
2019 2020 2021 2022 2023 2024
Source: Power Development Plan 2018
31 Remark: /1 Including APP’s capacity MW of 9.9, Currently, APP’s shareholders sent LOI for APP share purchase proposal to ACE
/2 Estimated timeline : Currently, Arbitration result states that PEA has to return PPA to ACE and with the assumption that normally power project’s construction period is approx. 2 yearsIndustry Overview and Growth Potential
ACE’s 3 Core Value Represent Competitive Advantage to Secure New PPAs
Key Competitive Advantages of ACE to Win The Bidding
1 Advance Technology
Low Plants heat rate
Artificial Intelligence, IoTs and Big
R&D
data for cost control and
Potential Fuel Crops from Major improvement
Shareholders’ plantation Environmental friendly
business
New Biomass Fuel Types
Machinery and Powerplant Knowhow
Design
Low O&M cost
Big & strong Professional Teams get
ready to handle New Projects.
2 Operational Expertise & 3 Relationship with Key
Economy of Scale Stakeholder
Proven track record in building and Major shareholders’ plantation
running 13 projects business can support long-term
Continuous operational improvement feedstock development plan
Economy of scale Strong & long-term relationship with
Strong feedstock purchasing team community and farmers
Strong relationship with lender
Sustainability
Feed stock security
32 Financial security
Community supportIndustry Overview and Growth Potential
Proven by Recent Bidding
Won the largest portion of MW in the 2017 SPP Hybrid Bidding (Renewable)
2017 Biomass Bidding Potential Upcoming Community Biomass/Biogas PPA/1
Largest bidding winner out of 42 candidates in the 2017 SPP Hybrid
Bidding (Renewable)
Unit : MW
ACE got 28% share in Biomass bidding winner
1 Biomass
2,997
76
MW MW
196 MW
Biogas
1,128
MW
ACE
Other Bidding Winners in Biomass
Total PPA Capacity available for Bidding: 272 MW Total Potential Capacity available for Bidding: 4,125 MW
Source : ERC, PEA
33 /1 Community Power Plant Project Concept, PEA Strictly Private & ConfidentialTable of Contents
I Company Overview
II Industry Overview and Growth Potential
III Company Core Competitive Advantages
IV Financial Highlights
V Key Takeaways
34Company Core Competitive Advantages
Company Core Competitive Advantages

                       1        Thailand’s Leading Integrated Power Producer with highest growth potential                        /1

                                     2        Proven Operational Capabilities

                       3         Secured Cash Flow Supported by PPA with EGAT/PEA

36   Remark: /1 Estimated approximate MW growth during 2019-2022; Estimated MW growth of peers based on public information only
Company Core Competitive Advantages– Leading Integrated Renewable Power Producer
Target to Secure 1 GW Installed Capacity within 2024
2019 2022/1,/2 2024
COD Capacity : 211 MW COD Capacity : 421.37 MW COD Capacity : 421.37 +[x] MW
COD + Secure Pipeline : 421.37 MW /1 COD + Secure Pipeline : 421.37+[x] MW Target Capacity/3 : 1,000 MW
Solar: 1.2%
Solar: 0.8%
MSW: 2.6%
MSW: 2.8% Additional Biomass: 29.1%
- Biomass,
Biomass: 42.2% Co-generation: 27.1% Biomass: 69.1% - Biogas,
- MSW,
- Solar/4 Co-generation: 11.4%
Co-generation: 54.2%
MSW: 1.1%
Solar: 0.5%
+26% MW CAGR +36% MW CAGR
From 2019 - 2022 From 2019 - 2024
Remark: /1 Including APP’s capacity MW of 9.9, Currently, APP’s Shareholders sent LOI for APP’s share purchase proposal to ACE
/2 Estimated timeline: Currently, Arbitration result states that PEA has to return PPA to ACE and with the assumption that normally power project’s
construction period is approx. 2 years
37 /3 Company Target to COD+ secure 1,000 MW within 2024
/4 Additional capacity is subject to management guidance, but will focus in renewable field.Company Core Competitive Advantages – Proven Operational Capabilities
Leading Biomass Power Producer in Thailand
ACE’s in-house R&D capabilities results in feedstock and O&M cost reduction with the target to reduce feedstock cost approx. 5% – 15% for
current plant and 24.7%-27.8% on top for pipeline plant and O&M cost reduction approx. 15% – 25% in the next 2-3 years
Advanced Continuing
Professional Run Proven Track Record Upside Potential
Technology Improvement
• Biggest professional-run • ACE’s ability to burn • Target to decrease • 3 year performance track • Potential electricity sales
biomass power player in various types of high feedstock cost of 5% -15% record of continued of ~24 MW to IUs
Thailand moisture content biomass by 2-3 years efficiency and profit
• Additionally, potential plant • +15 operational years
efficiently up to 60-65% margin improvement
• More than 1 year heat rate decrease of after PPA expire/3
continuing operation • Various type of biomass 24.70%-27.81%/2 for • Proven ability to source
before requiring shutdown mix with controllable cost pipeline plant (VSPP, SPP biomass feedstock (no
maintenance Hybrid) record of supply
• ISO 9001, 14001, 18001
• Target to decrease its shortage)
• Advanced Technology
O&M cost 15% -25% by 2-
leading to feedstock 3 years
flexibility
Capacity Factor/1
Biggest professional-run
97% 98% 97% 96%
100 %
More than 1 year continuing operation
90%
80%
80%
Ability to burn high moisture content 60%-65%
70%
60%
50%
40%
32%
30%
20%
2017
2017 2018
2018 6M19
2Q19 2017
Listed Peers 2018 Others
Others Distinguished Efficiency
Listed
Peer
Source : Company annual report and presentation publicly available for peers’ information
Remark: 1/ Selling capacity factor (Selling Electricity /(Total Operating hours * Selling Capacity))
38 2/ Due to new technology ( high temp, high pressure turbine) and verified by third party technical advisor
3/ Third party technical report stated that general biomass powerplant has an average useful life of 25-30 years or greater in case of proper recurring maintenanceCompany Core Competitive Advantages – Proven Operational Capabilities
Leading Biomass Power Producer in Thailand
ACE’s in-house R&D capabilities results in feedstock and O&M cost reduction with the target to reduce feedstock cost approx. 5% – 15% for
current plant and 24.7%-27.8% on top for pipeline plant and O&M cost reduction approx. 15% – 25% in the next 2-3 years
Advanced Continuing
Professional Run Proven Track Record Upside Potential
Technology Improvement
• Biggest professional-run • ACE’s ability to burn • Target to decrease • 3 year performance track • Potential electricity sales
biomass power player in various types of high feedstock cost of 5% -15% record of continued of ~24 MW to IUs
Thailand moisture content biomass by 2-3 years efficiency and profit
• Additionally, potential plant • +15 operational years
efficiently up to 60-65% margin improvement
• More than 1 year heat rate decrease of after PPA expire/3
continuing operation • Various type of biomass 24.70%-27.81%/2 for • Proven ability to source
before requiring shutdown mix with controllable cost pipeline plant (VSPP, SPP biomass feedstock (no
maintenance Hybrid) record of supply
• ISO 9001, 14001, 18001
• Target to decrease its shortage)
• Advanced Technology
O&M cost 15% -25% by 2-
leading to feedstock 3 years
flexibility
Feedstock & O&M Cost
Feedstock Cost O&M Cost
(THB/ kWh produced) (THB/ kWh produced) To decrease Feedstock cost 5%-15% by 2-3 years
24.70%-27.81% Plant heat rate decrease on top for
2
1.6 1.54
VSPP, SPP Hybrid pipeline
1.32
1.34 0.8 0.74 0.7
1.5
0.58 To decrease O&M cost 15%-25% by 2-3 years
0.6
1
0.4
0.5
0.2
0 0
2017 2018 Q2’19
2019Q2 2017 2018 Q2’19
2019Q2
(3 M)
Potentially Improving Margin
(3M)
39 Remark: 1/ Selling capacity factor (Selling Electricity /(Total Operating hours * Selling Capacity))
2/ Due to new technology ( high temp, high pressure turbine) and verified by third party technical advisor
3/ Third party technical report stated that general biomass powerplant has an average useful life of 25-30 years or greater in case of proper recurring maintenanceCompany Core Competitive Advantages – Proven Operational Capabilities
Leading Biomass Power Producer in Thailand
ACE’s in-house R&D capabilities results in feedstock and O&M cost reduction with the target to reduce feedstock cost approx. 5% – 15% for
current plant and 24.7%-27.8% on top for pipeline plant and O&M cost reduction approx. 15% – 25% in the next 2-3 years
Advanced Continuing
Professional Run Proven Track Record Upside Potential
Technology Improvement
• Biggest professional-run • ACE’s ability to burn • Target to decrease • 3 year performance track • Potential electricity sales
biomass power player in various types of high feedstock cost of 5% -15% record of continued of ~24 MW to IUs
Thailand moisture content biomass by 2-3 years efficiency and profit
• Additionally, potential plant • +15 operational years
efficiently up to 60-65% margin improvement
• More than 1 year heat rate decrease of after PPA expire/3
continuing operation • Various type of biomass 24.70%-27.81%/2 for • Proven ability to source
before requiring shutdown mix with controllable cost pipeline plant (VSPP, SPP biomass feedstock (no
maintenance Hybrid) record of supply
• ISO 9001, 14001, 18001
• Target to decrease its shortage)
• Advanced Technology
O&M cost 15% -25% by 2-
leading to feedstock 3 years
flexibility
Gross Profit Margin
Q2/19
37%
Track record with Improvement
1400
28%
~24 Potential MW sales to IUs
1200
1000 24% +15 operational years/3 after PPA
800 736
555 2H19
600
400
243 Q2’19
200
186 Q1’19
0
2017 2018 2019
2019 Upside potential in the near future
40 Remark: 1/ Selling capacity factor (Selling Electricity /(Total Operating hours * Selling Capacity))
2/ Due to new technology ( high temp, high pressure turbine) and verified by third party technical advisor
3/ Third party technical report stated that general biomass powerplant has an average useful life of 25-30 years or greater in case of proper recurring maintenanceCompany Core Competitive Advantages – Proven Operational Capabilities
Most Efficient MSW Power Producer in Thailand
ACE’s early engagement in MSW, reputable bidding track record and renowned expertise will secure the upcoming MSW bidding opportunity
Advanced International
Professional Run Proven Track Record Upside Potential
Technology Recognition
• Most efficient MSW power • ACE’s high technological • Received 3Rs Awards in • Nearly 3 year performance • Potential electricity sales
plant operator in Thailand plant could burn high 2016 for being an track record with high of 0.4 MW (9% increase
moisture content municipal environment friendly efficiency and high profit in excess of current PPA
• Strong in-house O&M
solid waste up to 80% with power operator. margin MW)
Team
efficiency
• Thailand’ Minister of • Abundant supply of waste • Tipping fee will enhance
• Target to decrease its
• Zero discharge Interior , Minister of project return (fee
O&M cost 15% -25% by 2-
Energy and government increase 10%/3 years)
3 years • Odorless
officials of other countries
• ISO 9001, 14001, 18001 to visit the plant as MSW
prototype
Availability Factor and Capacity Factor/1
Availability Factor Capacity Factor
95% Most efficient MSW
100 %
94%
92%
100 %
95% 95%
95%
92%
90%
88%
90%
Ability to burn high moisture content up to 80%
85%
85%
85%
80%
75% 72%
Zero discharge and Odorless
80%
70%
75%
65%
70%
60%
65%
55%
Distinguished Efficiency
60% 50%
2017
2017 2018
2018 Q219
6M19 Listed
Listed 2017
2017 2018 2Q19 Listed
Listed
2018 6M19
Peers
Peer Peers
Peer
and Eco friendly
41 Source : Company annual report and presentation publicly available for peers’ information
Remark: 1/ Capacity factor (Produced Electricity /(Total Operating hours * Total Capacity)), For Selling capacity factor of 2017,2018 and 6M2019 are 98%,100% and 99% respectively.Company Core Competitive Advantages – Proven Operational Capabilities
Thailand’ Minister of Interior and Minister of Energy visited MSW KK Plant
ACE’s early engagement in MSW, reputable bidding track record and renowned expertise will secure the upcoming MSW bidding opportunity
Advanced International
Professional Run Proven Track Record Upside Potential
Technology Recognition
• Most efficient MSW power • ACE’s high technological • Received 3Rs Awards in • Nearly 3 year performance • Potential electricity sales
plant operator in Thailand plant could burn high 2016 for being an track record with high of 0.4 MW (9% increase
moisture content environment friendly efficiency and high profit in excess of current PPA
• Strong in-house O&M
municipal solid waste (Up power operator. margin MW)
Team
to 80%) with efficiency
• Thailand’ Minister of • Abundant supply of waste • Tipping fee will enhance
• Target to decrease its
• Zero discharge Interior , Minister of project return (fee
O&M cost 15% -25% by 2-
Energy and government increase 10%/3 years)
3 years • Odorless
officials of other countries
• ISO 9001, 14001, 18001 to visit the plant as MSW
prototype
Gen. Anupong Paojinda (Minister of Interior) visited MSW powerplant at 3 May 2018 Mr. Siri Jirapongphan (minister of Energy) visited MSW powerplant at 12 Dec 2018
42Company Core Competitive Advantages – Proven Operational Capabilities
Energy Regulatory Commission visit MSW KK Plant
ACE’s early engagement in MSW, reputable bidding track record and renowned expertise will secure the upcoming MSW bidding opportunity
Advanced International
Professional Run Proven Track Record Upside Potential
Technology Recognition
• Most efficient MSW power • ACE’s high technological • Received 3Rs Awards in • Nearly 3 year performance • Potential electricity sales
plant operator in Thailand plant could burn high 2016 for being an track record with high of 0.4 MW (9% increase
moisture content environment friendly efficiency and high profit in excess of current PPA
• Strong in-house O&M
municipal solid waste (Up power operator. margin MW)
Team
to 80%) with efficiency
• Thailand’ Minister of • Abundant supply of waste • Tipping fee will enhance
• Target to decrease its
• Zero discharge Interior , Minister of project return (fee
O&M cost 15% -25% by 2-
Energy and government increase 10%/3 years)
3 years • Odorless
officials of other countries
• ISO 9001, 14001, 18001 to visit the plant as MSW
prototype
Kraisi Kanasuta (Former member of ERC) visited MSW KK powerplant Mr. Kurujit Nakornthap Chairman of Energy Affairs Committee and Member of
the National Reform Steering Assembly (NRSA)visited MSW KK powerplant
43Company Core Competitive Advantages – Proven Operational Capabilities
Sri Lanka’ Supreme Ambassadors visit MSW KK Plant
ACE’s early engagement in MSW, reputable bidding track record and renowned expertise will secure the upcoming MSW bidding opportunity
Advanced International
Professional Run Proven Track Record Upside Potential
Technology Recognition
• Most efficient MSW power • ACE’s high technological • Received 3Rs Awards in • Nearly 3 year performance • Potential electricity sales
plant operator in Thailand plant could burn high 2016 for being an track record with high of 0.4 MW (9% increase
moisture content environment friendly efficiency and high profit in excess of current PPA
• Strong in-house O&M
municipal solid waste (Up power operator. margin MW)
Team
to 80%) with efficiency
• Thailand’ Minister of • Abundant supply of waste • Tipping fee will enhance
• Target to decrease its
• Zero discharge Interior , Minister of project return (fee
O&M cost 15% -25% by 2-
Energy and government increase 10%/3 years)
3 years • Odorless
officials of other countries
• ISO 9001, 14001, 18001 to visit the plant as MSW
prototype
H.E.Mrs.Kshenuka Dhireni Senewiratne (Sri Lanka’s Supreme Ambassdor) visited MSW KK powerplant at 11 Dec 2018
44Company Core Competitive Advantages – Proven Operational Capabilities
Bangladesh’s Minister visit MSW KK Plant
ACE’s early engagement in MSW, reputable bidding track record and renowned expertise will secure the upcoming MSW bidding opportunity
Advanced International
Professional Run Proven Track Record Upside Potential
Technology Recognition
• Most efficient MSW power • ACE’s high technological • Received 3Rs Awards in • Nearly 3 year performance • Potential electricity sales
plant operator in Thailand plant could burn high 2016 for being an track record with high of 0.4 MW (9% increase
moisture content environment friendly efficiency and high profit in excess of current PPA
• Strong in-house O&M
municipal solid waste (Up power operator. margin MW)
Team
to 80%) with efficiency
• Thailand’ Minister of • Abundant supply of waste • Tipping fee will enhance
• Target to decrease its
• Zero discharge Interior , Minister of project return (fee
O&M cost 15% -25% by 2-
Energy and government increase 10%/3 years)
3 years • Odorless
officials of other countries
• ISO 9001, 14001, 18001 to visit the plant as MSW
prototype
H.E.Mrs.Kshenuka Dhireni Senewiratne (Sri Lanka’s Supreme Md. Tajul Islam (Minister of Local Government and Rural
Ambassador) visited MSW KK powerplant at 11 Dec 2018 Development) visited MSW KK powerplant at 16 Feb 2019
45Company Core Competitive Advantages – Proven Operational Capabilities
MSW KK Plants Intrigued Regional Municipal
Environmental Inspection Division Team Indonesia Vice President Deligation visited Director-General of the Department of Local
visited MSW KK powerplant MSW KK powerplant Administration visited MSW KK powerplant
Director-General of the Pollution Control Deputy Director-General of the Department of Amnat Charoen Governor visited MSW KK powerplant
Department visited MSW KK powerplant Local Administration visited MSW KK powerplant
46Company Core Competitive Advantages – Proven Operational Capabilities
MSW KK Plants Intrigued Regional Municipal
Phuket Municipal visited MSW KK powerplant Udonthani Municipal visited MSW KK powerplant Executive Committee of local administrative organization
from Surat Thani visited MSW KK powerplant
Management team from Choomporn Municipal Nonsira, Khon Kaen Municipal Management team from Roi Et Municipal
visited MSW KK powerplant
47Company Core Competitive Advantages – Proven Operational Capabilities
MSW KK Plants Intrigued Regional Municapal
Management team from Maha Sarakham Municipal Board of Directors, Ministry of Energy and Ministry of Local Local government leaders from Songkhla
Administration from Bangladesh visted MSW KK powerplant province visited MSW KK powerplant in order to
solve the local waste issues
Management team from Krabi Municipal Municipal team team from Udonthani Municipal team team from Banpai, Khon Khaen
48Company Core Competitive Advantages – Proven Operational Capabilities
Most Efficient MSW Power Producer in Thailand
ACE’s early engagement in MSW, reputable bidding track record and renowned expertise will secure the upcoming MSW bidding opportunity
Advanced International
Professional Run Proven Track Record Upside Potential
Technology Recognition
• Most efficient MSW power • ACE’s high technological • Received 3Rs Awards in • Nearly 3 year performance • Potential electricity sales
plant operator in Thailand plant could burn high 2016 for being an track record with high of 0.4 MW (9% increase
moisture content environment friendly efficiency and high profit in excess of current PPA
• Strong in-house O&M
municipal solid waste (Up power operator. margin MW)
Team
to 80%) with efficiency
• Thailand’ Minister of • Abundant supply of waste • Tipping fee will enhance
• Target to decrease its
• Zero discharge Interior , Minister of project return (fee
O&M cost 15% -25% by 2-
Energy and government increase 10%/3 years)
3 years • Odorless
officials of other countries
• ISO 9001, 14001, 18001 to visit the plant as MSW
prototype
Gross Profit and Gross Profit Margin
Unit : THB mm / (%) Q2/19
50% Track record with Improvement
200
180 43% ~0.4 Potential MW sales to IUs
160 36%
140 Additional Tipping fee enhance return
120 114
100 82 2H19
80
60
40 35 Q2’19
20
28 Q1’19
0
2017 2018 2019 Upside potential in the near future
49Company Core Competitive Advantages – Proven Operational Capabilities
Competitive SPP Co-Generation Power Producer
Defensive scheme of Co-Generation Power Plant would help balance risk scheme of company’s powerplant portfolio
Advanced Continuing
Professional Run Proven Track Record Upside Potential
Technology Improvement
• One of the most efficient • ACE’s high technological • Strong in-house O&M • Nearly 3 year performance • Potential sales to IUs of
SPP Co-Generation to control and manage Team track record with high ~20 MW
powerplant operator in plant according to EGAT efficiency and competitive
• Target to decrease its • Potential steam sales
Thailand demand margin
O&M cost 15% - 25% by from IUs for more than
• ISO 9001, 14001, 18001 2-3 years • Cost pass-through scheme 100,000 tons/year
could result in stable
• +25 operational years
margin
after PPA expire /2
• Long term gas purchase
contract with PTT
Availability Factor and Capacity Factor/1
Availability Factor Capacity Factor One of the most efficient SPP Co-Gen
100% 99%
Strong in-house O&M
98% 98%
98% 85% 83%
82% To decrease O&M cost of 15%-25% by 2-3 years
96% 80% 81%
96% 80%
94%
75%
92%
90% 70%
2017 2018ACE6M19 Listed 2017 2018
ACE
6M19 Listed Balance company risk profile
Peer Peer
50 Remark: 1/ Selling capacity factor (Selling Electricity /(Total Operating hours * Selling Capacity))
2/ Third party technical report stated that general natural gas powerplant has an average useful life of 30 -60 yearsCompany Core Competitive Advantages – Proven Operational Capabilities
Competitive SPP Co-Generation Power Producer
Defensive scheme of Co-Generation Power Plant would help balance risk scheme of company’s powerplant portfolio
Advanced Continuing
Professional Run Proven Track Record Upside Potential
Technology Improvement
• One of the most efficient • ACE’s high technological • Strong in-house O&M • Nearly 3 year performance • Potential sales to IUs of
SPP Co-Generation to control and manage Team track record with high ~20 MW
powerplant operator in plant according to EGAT efficiency and competitive
• Target to decrease its • Potential steam sales
Thailand demand margin
O&M cost 15% -25% by from IUs for more than
• ISO 9001, 14001, 18001 2-3 years • Cost pass-through scheme 100,000 tons/year
could result in stable
• +25 operational years
margin
after PPA expire /2
• Long term gas purchase
contract with PTT
Gross Profit and Gross Profit Margin
Unit : THB mm / (%)
Q2/19
Stable Gross margin Track record with stable margin
29% 29% 27%
~20 Potential MW sales to IUs
600
484
567 +25 operational years/2 after PPA
400 2H19
200 142 Q2’19
141 Q1’19
-
2017 2018 2019 Upside potential in the near future
51Company Core Competitive Advantages – Secure Cash Flow Supported by PPAs with EGAT/PEA
Secured Cash Flow Supported by PPA with EGAT/PEA
Reliable revenue source with high efficiency and controlled cost can guarantee cash flow to the company
Biomass MSW Co-Generation
8% 10%
Industrial Users Industrial Users Industrial Users
18%
2022 Revenue
Contribution
92% 90% 82%
Availability Factor AF : 92% AF : 95% AF : 99%
Capacity Factor CF : 97% CF : 95% CF : 82%
Feedstock • ~10,000 MW available • MSW service agreement • Long term purchase
Sufficiency • Feedstock development plan with government agreement with PTT
Feedstock Cost
Controllable No feedstock Cost Cost pass-through
Control
Potential Sales to IUs Tipping fee Potential Sales to IUs
Upside Potential ~15 operation years after PPA/1 Potential Sales to IUs ~25 operation years after PPA/2
Result Secured cashflow with upside potential
Remark: 1/ Third party technical report stated that general biomass powerplant has an average useful life of 25-30 years or greater in case of proper recurring maintenance
52 2/ Third party technical report stated that general natural gas powerplant has an average useful life of 30-60 yearsTable of Contents
I Company Overview
II Industry Overview and Growth Potential
III Company Core Competitive Advantages
IV Financial Highlights
V Key Takeaways
53Financial Highlights
Financial Highlights
Robust Revenue Growth with Diversified Revenue Mix
Revenue/1 Revenue Breakdown by Customer
(THB mm)
7500
1%
6500
5500
4,833
4500 4,243
99%
3500
2,335 2,462
2500
1,886
1500
Q2: 1,185 Q2: 1,249 2018
Electricity sales to EGAT and PEA
500
Q1: 1,150 Q1: 1,213
Sales to IUs
-500
2016 2017 2018 1H18 1H19
Revenue Breakdown by Type of Power Plant Key Observation
5.0%
0.0% ACE’s Revenue increase at
1.0% 5.0% significant rate of 60% each year
Biomass and co-generation
41.0%
accounts for the majority of ACE’s
40.0%
99.0% 55.0% 54.0%
revenue at 54% and 41%
respectively.
ACE’s primary source of revenue is
2016 2017 2018 secured by EGAT and PEA.
Biomass Co-Generation MSW Solar Others
Remark: /1 Exclude revenue from construction cost under concession agreement and other revenue
55Financial Highlights
Robust Financial Performance
Financial track record shows strong and consistent revenue, EBITDA and net profit growth with continuous margin expansion.
Gross Profit and Gross Profit margin/2 EBITDA/3 and EBITDA margin/2
(THB mm)
(THB mm)
2,5 00 40. 0%
3,00 0
35.5% 35.8% 39.5%
40. 0%
30.3%
35. 0%
42.1% 34.7%
33.6%
29.3% 34.1%
35. 0%
33.8%
2,0 00
2,50 0
26.4% 29.2% 30. 0%
/1
26.1%/1 29.6% 32.8% 34.8% 30. 0%
2,00 0
1,417
25. 0%
1,5 00
25. 0%
1,635
1,121 20. 0%
1,50 0
1,472 20. 0%
1,0 00
775
15. 0%
699
15. 0%
669 1,00 0
825 907
10. 0%
793 10. 0%
500
Q2: 351 Q2: 420 500
Q2: 413 Q2: 493
5.0 %
494/1
5.0 %
618/1
Q1: 348 Q1:355 Q1: 412 Q1: 414
0 0.0 % - 0.0 %
2016 2017 2018 1H18 1H19 2016 2017 2018 1H18 1H19
Gross Profit %GP to Sales Q1 %GP to Sales Q2 %GP to Sales
EBITDA % EBITDA to Sales Q1 %EBITDA Q2 %EBITDA
to Sales to Sales
Key Observation
ACE’s gross profit increase at significant CAGR of 46% (2016-2018), however removing the adjusted supply penalty will boost the Group’s gross
profit at CAGR of 70% (2016-2018).
Group’s margin improved over time as the Group achieved in 1) decreasing the cost 2) increasing efficiency in generating electricity (longer operating
hours) 3) launching new COD projects to the pipeline.
Remark: *In 2016, ACE Group purchased biomass fuel from related parties and received the fuel cost adjustment fee through the purchasing agreement where the
contracted suppliers were unable to meet the Group’s purchasing conditions.
/1 Adjusted figures by removing supply penalty
/2 Margin divided by sale and service revenue (not including construction revenue)
/3 EBITDA is calculated from net income + tax+ interest +depreciation/amortization+ other non cash items
56You can also read