First Quarter Fiscal 2022 Ended June 30, 2021 - Azure Power

Page created by Donald Bell
 
CONTINUE READING
First Quarter Fiscal 2022 Ended June 30, 2021 - Azure Power
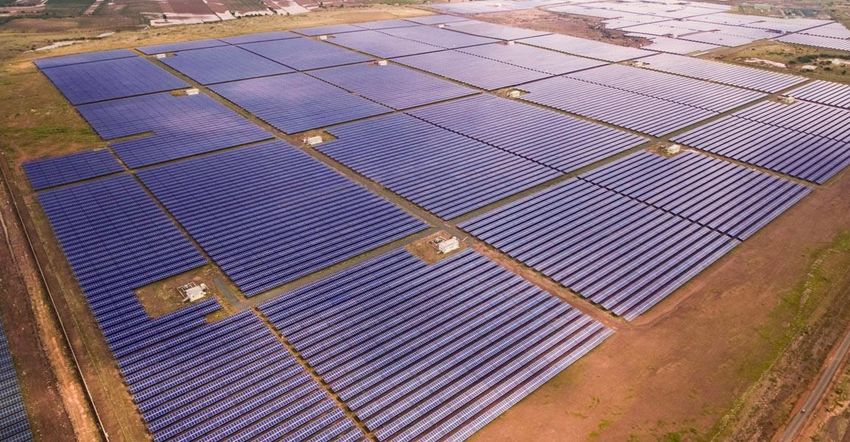
~7 GW* Pan India Portfolio of Solar Assets
India’s First Private Grid Connected MW Solar Plant
India’s lowest cost Solar Green Bond

First Quarter Fiscal 2022
Ended June 30, 2021
Earnings Presentation
August 31, 2021

*~7 GWs include 4 GWs for which LOA has been received
but 1|Copyright
    PPA has not © 2020
                been   Azure Power |www.azurepower.com
                     signed.
First Quarter Fiscal 2022 Ended June 30, 2021 - Azure Power
Disclaimer
Forward-Looking Statements

This information contains forward-looking statements within the meaning of Section 21E of the Securities Exchange Act of 1934
and the Private Securities Litigation Reform Act of 1995, including statements regarding our future financial and operating
guidance, operational and financial results such as estimates of nominal contracted payments remaining and portfolio run rate,
and the assumptions related to the calculation of the foregoing metrics. The risks and uncertainties that could cause our results to
differ materially from those expressed or implied by such forward-looking statements include: the availability of additional financing
on acceptable terms; changes in the commercial and retail prices of traditional utility generated electricity; changes in tariffs at
which long term PPAs are entered into; changes in policies and regulations including net metering and interconnection limits or
caps; the availability of rebates, tax credits and other incentives; the availability of solar panels and other raw materials; our ability
to attract and retain our relationships with third parties, including our solar partners; our ability to meet the covenants in debt
facilities; meteorological conditions; impact of the COVID-19 pandemic and lockdowns in India and globally; supply disruptions;
power curtailments by Indian state electricity authorities and such other risks identified in the registration statements and reports
that we have filed with the U.S. Securities and Exchange Commission, or SEC, from time to time. In the presentation, portfolio
represents the aggregate megawatts capacity of solar power plants pursuant to PPAs, signed or allotted or where we have been
cleared as one of the winning bidders or won a reverse auction but has yet to receive a letter of allotment. There is no assurance
that we will be able to sign a PPA even though we have a letter of award. All forward-looking statements in this presentation are
based on information available to us as of the date hereof, and we assume no obligation to update these forward-looking
statements.

This presentation also contains non-GAAP financial measures. We have provided a reconciliation of such non-GAAP financial
measures to the most directly comparable measures prepared in accordance with U.S. GAAP in the Appendix to this presentation.

2|Copyright © 2021 Azure Power |www.azurepower.com
First Quarter Fiscal 2022 Ended June 30, 2021 - Azure Power
Q1 FY 2022
                                                     Key Developments
3|Copyright © 2021 Azure Power |www.azurepower.com
First Quarter Fiscal 2022 Ended June 30, 2021 - Azure Power
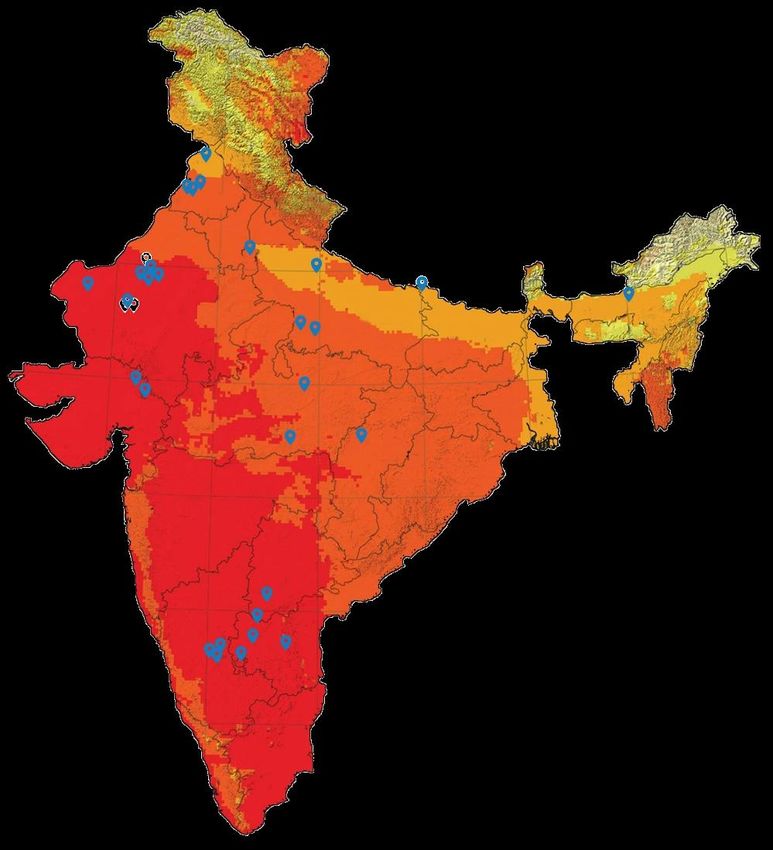
Key Highlights of Recent Developments
            Second Largest Solar                                          Operational(2)                                     Under Construction(2)                                      Awarded(3)
             Portfolio in India(1)                                2,102 MW AC                                                 853 MW AC                                           4,000 MW
                6,955 MW                                         (2,672 MW DC)

•    ESG Highlights:
        •    99% eligible employees vaccinated
        •    ESG score improved to “Low Risk” category by Sustainalytics; AA rating by MSCI
        •    UN Global Compact signatory

•    Positive steps on 4GW with SECI signing PSAs for 800 MW with DISCOMs
•    OMERS acquired stake from IFC/IFC GIF underlining Azure’s platform strength
•    Expanded addressable market through participation in Wind/Hybrid auctions
•    Operational Highlights:
        ▲EBIDTA from Operating Assets was $53.2 Mn for 1Q’ 22; 11% higher from 1Q’ 21
                                                         (4)

        ▲Cash Flow to Equity (CFe) from Operating Assets was $24.8 million for 1Q’ 22, up 12% from 1Q’ 21
                                                                                   (4)

        ▲Commissioned 112.5 MW AC since last quarter, delay due to second wave disruptions but largely on                                                                                              Under Construction

                                                                                                                                                                                                       Operating
             track with guidance for the fiscal

1) Based on portfolio size: Mercom, 2) includes 50 MW commissioned in Rajasthan 6 project in July’21 and excludes 153 MW of Rooftop portfolio for which we have entered into an agreement to sell in April 2021. 3) LOA
received but PPA not yet signed. PPA will follow after power is contracted by SECI with DISCOMs under a power sale agreement (PSA) and there is no assurance that we will be able to sign a PPA even though we have a letter
of award. We expect a tariff markdown from the price discovered in the auction. Capital costs, interest rates and foreign exchange rates have improved since Azure Power won the 4 GW auction. Once the final tariff is
determined, our forecast will be updated.4) For a reconciliation of EBITDA and CFe from Operating Assets, refer to the Appendix. Our CFe has no debt amortization for the Restricted Group entities, however, as we may look to
refinance these assets there may be change in the debt amortization for these assets. Exchange rate INR 74.33 to US$1 (New York closing rate of June 30, 2021).
    4|Copyright © 2021 Azure Power |www.azurepower.com
First Quarter Fiscal 2022 Ended June 30, 2021 - Azure Power
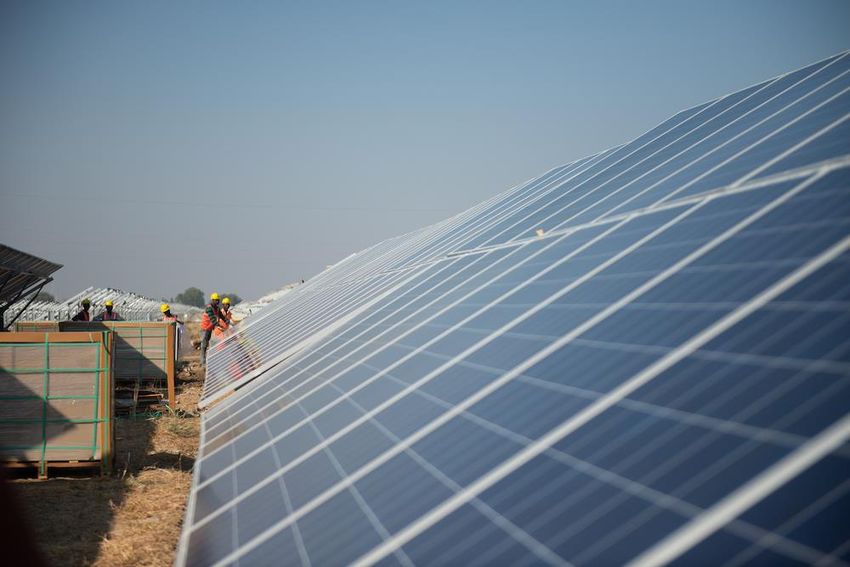
Projects Under Construction Update                                                                                               Assam

                                                                          Rajasthan

                        Rajasthan 6              Rajasthan 8            Rajasthan 9                                                                               Assam - 90 MW
                          600 MW                   300 MW                 300 MW
   Revised             400MW - Done                                                                                                                           • 37.5
                                                                                                                                                                Q2 CY’21
                                                                                                                                                                     MW - Done
                                                      Q3(1)                   Q4(1)
  PPA COD               200 MW – Q3                                                                                                                      27.5 MW - Q3 / 25 MW - Q4(2)

  Financing                                                               Document                                                                                    Completed
                             100%                    100%
                                                                          Signed (3)
                                                                                                                          Under Construction

     Land                    100%                    100%                    80%(4)                                        Operating                                     100%

Transmission                 100%                    100%                    100%                                                                                        ~95%

1) Extension in SCD applied for in line with MNRE order dated 12.05.2021 providing extension in project SCD due to Covid second wave which pushed many State Governments to impose
lockdown | Quarters refer to FY2022. This extension is over and above the earlier granted extension of 5 months 2) Extension applied for 3) Considering increase in project cost on account of
change in technology etc-sanction of additional debt is in process 4) Additional land procurement is under process basis some changes in technology being deployed
.    5|Copyright © 2021 Azure Power |www.azurepower.com
First Quarter Fiscal 2022 Ended June 30, 2021 - Azure Power
ESG Highlights
                                                                                           Q1 Highlights
                                                              ◼   Azure became signatory to UN Global Compact.
                                                              ◼   World environment day celebrated with plantation of 1500+ tree saplings
                                                              ◼   Avoided around 1 million tons of CO2 in current Quarter, 10.5 million ton equivalents since
                                              Environment         inception.
                                                              ◼   Projects registered under Verified Carbon Standard (VCS) and Gold Standard (GS) program
                                                                  under the UNFCCC Clean Development Mechanism.
                                                              ◼   Proposal for plantation of 15,000 trees in our SECI 600 Site approved. Plantation will be
                                                                  undertaken this year.

                                                              ◼   28 Stakeholder consultation undertaken across different sites
    ESG score improved from                                   ◼   Cohort system was formalized to act as support group for employees and their families during
   “Medium Risk” to “Low Risk”                                    second wave of COVID Pandemic.
                                                     Social   ◼   2 vaccination drives organized for employees and families. 99% of eligible employees
                                                                  vaccinated.
                                                              ◼   15 Oxygen cylinder and 5 Oxygen concentrators reserved for use of employees.
                                                              ◼   30 BIPAP Machines, 21 Oxygen concentrators, 160 Oximeters and 375 PPE Kits donated to
                                                                  health care facilities pan India (Rajasthan, UP, Karnataka)​

                                                              ◼   All projects comply with World Bank Equator Principles
                                                              ◼   Comply with SEC, NYSE, SGX governance standards
                                               Governance     ◼   Gender diverse Board with majority of Directors independent.
                                                              ◼   40 internal SHES audits reported no significant noncompliance
                                                              ◼   Sustainability charter under finalization, to be rolled out in Q2

6|Copyright © 2021 Azure Power |www.azurepower.com
First Quarter Fiscal 2022 Ended June 30, 2021 - Azure Power
Industry and Regulatory Update

    • India achieves 100GW of installed Renewable Energy capacity in August
      2021, making India the 4th largest globally. Additionally, 50 GW is under             •   MNRE grants additional 2.5 months blanket SCD extension to under-
      installation and 27 GW is under tendering.                                                construction projects, owing to disruption due to the 2nd wave of COVID-19. This
                                                                                                is over and above the earlier granted extension of 5 months on account of Covid
    • Prime Minister, at his Independence Day address, announced                                disruption.
      Government of India’s vision of self reliance in energy by 2047, i.e., 100
      years of Indian independence, and also reiterated 450 GW renewable energy             •   SC order to make all Transmission lines underground in GIB areas. With
      capacity mission by 2030, which will play crucial role in energy independence             respect to Hon’ble Supreme Court’s order to make all existing and upcoming
      for India. At present India is world’s 3rd biggest oil importer and imports ~85% of       transmission lines underground in GIB areas, Ministry of New & Renewable Energy
      its hydrocarbon requirements.                                                             is working with multiple stakeholders and is planning to file an application for
                                                                                                exclusion of potential area in the order. Azure has a total of 875 MW projects,
    • Solar and Wind Capacity auction, 33 new tenders aggregating to a total                    entirely in the potential area, which includes 275 MW operational and 600 MW under
      capacity of 8.05 GW were issued across the solar and wind segment and                     construction. Any cost incurred on account of this order will be pass through for
      auction of 3,050 MW of tenders was completed since April 2021.                            these projects.

•     Government of India announced reform-based result-linked power                        •   APTEL orders compensation for solar curtailment: In a landmark judgement,
      distribution sector scheme through an outlay of US$ 40 billion with an                    the Appellate Tribunal for Electricity (APTEL) has directed Tamil Nadu State Load
      estimated gross budgetary support of US$ 13 billion. The scheme aims to                   Despatch Centre (TNSLDC) and The Tamil Nadu Generation and Distribution
      reduce pan India AT&C losses to 12-15% and ACS-ARR gap to zero by 2024-                   Corporation (TANGEDCO) to compensate developers at 75% of PPA tariff per kWh
      25. The duration of the scheme is 5 years (FY 22 to FY 26).                               on solar curtailment. APTEL issued the order as it found curtailment instructions
                                                                                                were issued to developers for reasons other than grid security during the period.
•     Investments galore in Indian Renewable as per IEEFA, with investments                     APTEL issued these directions to all the State Electricity Regulatory Commissions,
      reaching US$ 6.6 billion during April-July 2021. Global investors like Scatec,            DISCOMs and State Load Despatch Centres which will help developers to get
      Engie, Actis, ORIX, Thailand’s GPSC, Norfund, OMERS have acquired stakes                  compensation if curtailment is done without any grid security reason.
      Indian renewable energy assets during this period. Green bonds are also
      playing a huge role in the increase in renewable energy investments in India,
      with Azure Power raising lowest coupon Solar Green Bond from India till date in
      August 2021.

    7|Copyright © 2021 Azure Power |www.azurepower.com
First Quarter Fiscal 2022 Ended June 30, 2021 - Azure Power
Q1 FY 2022
                                                     Overview
8|Copyright © 2021 Azure Power |www.azurepower.com
First Quarter Fiscal 2022 Ended June 30, 2021 - Azure Power
Q1’22 Key Performance Metrics

    2,052 MW* Operating                              6,955 MW* Operating,                                      US$ 0.52m Project                        US$ 57.3m Q1 Revenue(4)
       23% increase(1)                                   Contracted &                                           Cost/MW (DC)(3)                              13% increase
                                                          Awarded(2)
• 387 MW (560 MW DC) commissioned                    • 2,052 MW Operating                            • AC cost per MW US$ 0.53m for Q1 FY22                • US$ 50.6m for Q1 FY 21#
  since June 2020*                                   • 903 MW under construction                     • AC cost per MW US$ 0.59m for FY 21
• 62.5 MW (63.8 MW DC)                               • 4 GW LOA received, PPA awaited                • DC cost per MW US$ 0.39m for FY 21
  commissioned in Q1 FY22*
% increase/reduction over figures from June 2020 (for $ numbers, the change has been computed over their INR values) | #Exchange rate INR 74.33 to US$1 (New York closing rate of June 30, 2021)
1. Operating capacity excludes 153 MW of Rooftop portfolio for which we have entered into an agreement to sell in Q1 FY2022. Accordingly for the prior comparable period we have excluded 144 MW
   from the capacity reported (1,808 MW) as at June 30, 2020 | * Excludes the RT portfolio
2. Operating, Contracted and Awarded capacity excludes 160 MW of Rooftop portfolio as on June 30, 2021, as well as from prior comparable period, we have entered into an agreement to sell. We have
   included the 4 GW for which we have received the LOA, however, the PPA has not yet been signed.
3. Cost per MW are reported Year to date (YTD). The Cost per MW is higher due to higher input cost and low DC installed capacity.
4. Excluding revenue relating to Rooftop companies for Q1 FY22 US$ 2.4 million (June 30 , 2020 US$2.4 million).
  9|Copyright © 2021 Azure Power |www.azurepower.com
Review of Q1 FY’22 Results
                                                                                                                   % Change
                           Reported       Adjusted         Reported       Reported              1Q FY’22 After
                                                                                   Adjustments*                adjusted Q1 FY’22
      (in million)         1Q FY’21       1Q FY’21         1Q FY’22       1Q FY’22               Adjustments                                                                    Comments
                                                                                       US$                      vs adjusted Q1
                             INR            INR              INR            US$                      US$
                                                                                                                     FY’21
                                                                                                                                                     Primarily driven by projects commissioned since Q1
       Revenue                3,940         3,940            4,440            59.7              -               59.7                  13%
                                                                                                                                                     FY21 ~US$ 6.7m.
                                                                                                                                                     Cost of operations increased primarily due to projects
                                                                                                                                                     commissioned since Q1 FY 21. Adjustment of
 Cost of Operations            263           313               345            4.6               -                4.6                  10%
                                                                                                                                                     ~US$0.7m in Q1 FY21 is on account of lower cost of
                                                                                                                                                     operations due to outbreak of Covid-19.
     General &
                                                                                                                                                     G&A after adjustment is in line with increase in revenue.
   Administrative              373           311               427            5.7             1.3                4.4                   5%
                                                                                                                                                     Adjustment is of SAR provision.
     Expenses

Non-GAAP Adjusted
                              3,304         3,316            3,668            49.4            1.3               50.7                  14%                     A 14% YoY increase after adjustments
     EBITDA*
  Depreciation and
                               755           755               819            11.0              -               11.0                   8%            Primarily due to projects commissioned since Q1 FY21
   Amortization
                                                                                                                                                     ~US$ 5m on borrowings related to projects
Interest Expense, net                                                                                                                                commissioned since Q1 FY’21, partially offset by higher
   (including other           2,169         1,905            2,251            30.3              -               30.3                  18%            interest income of ~US$ 1.3m. Adjustment in Q1 FY21
      expenses)                                                                                                                                      is for one time charges related to refinancing of a loan
                                                                                                                                                     incurred.
 Loss on Foreign
Currency Exchange,              17            17               19             0.3               -                0.3                  12%            Limited FX exposure after refinancing earlier in year
       net
                                                                                              0.3                                                    Impairment loss recognised on Rooftop assets part of
  Impairment Loss                -             -               26             0.3                                 -                    n/a
                                                                                                                                                     the disposal group
    Income tax                                                                                                                                       On account of movement in the carrying amount of
                               317           317              (144)          (1.9)              -               (1.9)               (145%)
 expense/(benefit)                                                                                                                                   certain assets and liabilities and their tax base
 Net profit after tax           46           322               697            9.4             1.6               11.0                 154%            1Q’FY22 adjusted net profit of US$ 11.0 million
 Exchange rate INR 74.33 to US$1 (New York closing rate of June 30, 2021) | *For a reconciliation of Non-GAAP measures to comparable GAAP measures, refer to the Appendix. Refer to earnings press release for further information.
 Adjustments are charges or additional items that are non-recurring, recurring but expected to be materially higher or lower going forward or we expect recovery of in the future.
      10|Copyright © 2021 Azure Power |www.azurepower.com
Improved Overhead and DSO

                G&A Excluding Stock Compensation &
                      Management Transition                                                                                             Accounts Receivable DSO
   Millions                                                                                                             Days
                Excluding SAR, G&A increased by 5% for
     $24        1Q 22(1)                                                                                                150
     $22
     $20                                                                                                                140
     $18
     $16
                                                                                                                        130
     $14
     $12
                                                                                                                        120
     $10
      $8
      $6                                                                                                                110

                                                                                                                  DSO
      $4
      $2                                                                                                                100
      $0
     -$2      1Q'20   2Q'20   3Q'20   4Q'20   1Q'21   2Q'21   3Q'21   4Q'21   1Q'22                                      90                                                    Average time to
     -$4                                                                                                                                                                       bill combined
     -$6                                                                              Share price increased              80                                                    with grace
     -$8                                                                              from US$ 15.85 in Q1                                                                     period is ~75
    -$10                                                                              FY21 to US$ 26.92 in Q1                                                                  days
                                                                                      FY22,      resulting   in          70
                          Stock Comp/Management Transition*                           increase of provision.
                          G&A ex Stock Comp/Management Transition                                                        60
                                                                                                                               1Q'20   2Q'20   3Q'20   4Q'20   1Q'21   2Q'21   3Q'21   4Q'21     1Q'22

  ___________________________
  *As of June 30, 2021, 1,875,000 SARs were outstanding of which 1,682,500 SARs cannot be exercised until 2024 on which the Company will not incur any cash
  payments until that time
  Exchange rate- INR 74.33 to US$1 (New York closing rate of June 30, 2021 | 1) Compares 1Q’21 vs 1Q’22
11|Copyright © 2021 Azure Power |www.azurepower.com
Operating Assets Review: EBITDA, CFe, & Leverage
                         12% growth in CFe from Operating Assets YoY(1)
          EBITDA from Operating                          CFe(1) from Operating Assets
            Assets (in US$ Mn)                                     (in US$ Mn)

                                    $53.2
                                                                                       $24.8
                 +11%
                                                                          +12%
                                                                                                                               Positive Drivers:

            $47.8                                                 $21.9                                                       Revenues: +$6.7 million

      1Q'21 EBITDA            1Q'22 EBITDA                    1Q'21 CFe             1Q'22 CFe
                                                                                        As at March. 31, 2021                               As at June 30, 2021
                                                                                           (in INR million)                      (in INR million)             (in US$ million)
                      Net Debt for Operating Assets                                             82,650                                88,731                    1,193.7
                   LTM EBITDA for Operating Assets                                              13,146                                13,546                     182.2
             Net Debt/LTM EBITDA for Operating Assets (x)                                        6.3x                                   6.6x
  ___________________________
  ​Exchange rate- INR 74.33 to US$1 (New York closing rate of June 30, 2021) | For a reconciliation of EBITDA and CFe from Operating Assets, refer to the Appendix
   (1) Our CFe has no debt amortization for the Restricted Group entities, however, as we may look to refinance these assets there may be change in the debt amortization for
   these assets.
12|Copyright © 2021 Azure Power |www.azurepower.com
A Growing Balance Sheet

                                                                                                  As at March 31,
                                                                                                                                                 As at June 30, 2021
                                                                                                        2021
                                                                                                                                                     (in million)
                                                                                                    (in million)

                                                                                                                                                                                   (3)
                                                                                                           INR                              INR                              US$

             Cash, Cash Equivalents and Current Investments(1)                                           11,107                            6,736                              90.6

                          Property, Plant & Equipment, Net                                              108,847                          115,023                            1,547.5

                                          Net Debt(2)                                                    86,928                           99,900                            1,344.0

                                   Hedging Asset (net)                                                   5,488                             7,867                             105.8

1) Does not include Current and Non-Current Restricted cash of INR 10,800 million (US$ 145.3 million) as on June 30, 2021 and of INR 5,051 million (US$ 68.0 million) for the year ended March
   31, 2021.
2) Net debt is presented after net of hedging derivative value and cash and cash equivalents. The hedging asset (net) is directly related to hedging foreign debt from variances in foreign exchange
   changes and is included in Other Assets on the Balance Sheet. The hedging asset (net) was US$ 105.8 million for quarter ended June 30, 2021 and US$ 73.8 million for the year ended March
   31, 2021 respectively.
3) Exchange rate- INR 74.33 to US$1 (New York closing rate of June 30, 2021).

  13|Copyright © 2021 Azure Power |www.azurepower.com
Q2’22 and FY’22 Guidance

                      Q2’22 Guidance                                                                                                      FY’22 Guidance

  Q2 FY’22 Revenue: INR                                                                                                2,750 – 2,955(1) MW
   3,600 – 3,800 million(1)                                                                                           Operating by March 31,
Q2 FY’22 PLF: 20.5% - 21.5%                                                                                                   2022

                                                                                                                             INR 17,900 – 18,900
                                                                                                                                  million(1)
                                                                                                                            of Revenue for FY’22

 _________________________

 1) Q2 FY’22 revenue guidance is US$ 49.0 - $51.7 mn and FY’22 revenue guidance is US$ 241 - $254mn at the June 30, 2021 exchange rate- INR 74.33 to US$1. Excludes our rooftop portfolio for
    which we have entered into an agreement to sell in the current quarter.

14|Copyright © 2021 Azure Power |www.azurepower.com
Long Term Outlook
                                             MW Operational Guidance
        MW
        7,000                                                                                                                                                             Gross Margin(2,4), Cash Flow to Equity for
        6,000                                                                                                                                                              Operating Assets(3,4) and Debt Forecast
        5,000                                                                                            CAGR 24%
                                                                                                                                                                  US$ Millions
        4,000
                                                                                                                                                                   $350
        3,000                         CAGR 43%                                                                                                                                                                                          Gross Margin:
                                                                                                                                                                                                                                         $270 - $285
        2,000                                                                                                                                                      $300
                                                                                                                                                                                                      Gross Margin:
        1,000                                                                                                                                                      $250                                $198 - $218

              -                                                                                                                                                                   Gross Margin:
                     IPO(a)

                                  FY'17(a)

                                             FY'18(a)

                                                         FY'19(a)

                                                                        FY'20(a)

                                                                                       FY'21(a)

                                                                                                    FY'22(a)

                                                                                                                  FY'22(e)

                                                                                                                             FY'23(e)

                                                                                                                                          FY'24(e)

                                                                                                                                                       FY'25(e)
                                                                                                                                                                   $200               $194

                                                                                                      Q1
                                                                                                                                                                   $150

                                                                                                                                                                   $100
                                                        Capex Forecast(1)
      US$ Millions                                                                                                                                                  $50
      $600                                                                                                                                                                             CFe:                                                 CFe:
                                                                                                                                                                                                          CFe:
                                                                                                                                                                                       $79                                                $50 - $100
      $300                                                                                                                                                           $0                                 $41 - $66
                                                                                                                                                                                      LTM         Current Operational         Total Contracted Portfolio (2,955
         $0                                                                                                                                                                                          (2,052 MWs)                           MWs)
                              FY'22                                 FY'23                                      FY'24                                 FY'25             Net Debt                        ~$1,140                            ~$1,550
                                                                                   Equity         Debt
                                                                                                                                                                                                  Gross Margin          CFe
(US$ millions)                FY'22                             FY'23                                     FY'24                           FY'25

Cap Ex                $450 - $550                       $500 - $650                                  $500 - $650                        $500 - $650

  Exchange rate- INR 74.33 to US$1 (New York closing rate of June 30, 2021) (1) The forecast for FY23 onwards assumes capex for 4GW awarded capacity which is subject to PPA’s being signed on a timely basis with
  SECI and does not factor impacts from events such as COVID/supply challenges etc (2) Revenue less cost of operations equals Gross Margin. Corporate G&A as overhead is covered during construction in cap ex. (3)
  CFe (cash flow to equity) for Operating Assets is profit before tax (the most comparable GAAP metric), adjusted for net cash provided for used/in operating activities, other than changes in operating assets and liabilities,
  income and deferred taxes and amortization of hedging costs; less: cash paid for income taxes, debt amortization and maintenance capital expenditure. Our CFe has no debt amortization for the Restricted Group
  entities, however, as we may look to refinance these assets there may be change in the debt amortization for these assets. 4) Outlook range is generation from P90 to P50 and normalized debt amortization ranging from
  20 to 25 years. LTM actual debt amortization was $8.2 million due to the majority of debt in non amortizing Green Bonds.

     15|Copyright © 2021 Azure Power |www.azurepower.com
Appendix

16|Copyright © 2021 Azure Power |www.azurepower.com
Historical Plant Load Factor (PLF); Annual, Quarterly

               25.0%

               24.0%                              23.7% Q1 F22
                                                                                                                  23.4%
               23.0%
                         22.7%                                                                                    22.3%
               22.0%             21.5%                           20.5% – 21.5% PLF
                                                                  2Q FY’22 forecast                                          Annual PLF
               21.0%                                                                                                      FY’21     20.9%
                                                                                                                          FY'20     19.5%
               20.0%                                                                                                      FY'19     18.6%
                                                                                                                          FY'18     18.2%
               19.0%
                                                                                            17.7%
                                                                                                     19.3%
               18.0%
                                                                           18.8%
               17.0%
                                                      16.8%
               16.0%

               15.0%
                                     1Q                          2Q                             3Q           4Q

                                                                  FY'20a           FY'21a   FY'22a

17|Copyright © 2021 Azure Power |www.azurepower.com
Historical Plant Load Factor (PLF); Green Bonds Performance

                PLF: Azure Power Energy Limited (RG1)                                PLF: Azure Power Solar Energy Private Limited (RG2)

      22.0%                                                                      29.0%
                                                                                         26.4% Q1 F22
                 21.0%                                                                                                                            27.4%
      21.0%                                                                      27.0%
                                 20.2% Q1 F22                                                      26.3%
                                                                         20.6%
                                                                                                                                                  25.5%
      20.0%     20.1%                                                    20.0%   25.0%

      19.0%                                                                      23.0%
                                                                                                   22.7%
                                                                                                            21.0%                 22.4%

      18.0%                                                                      21.0%
                                       17.3%          17.2%
                                                                                                                                  20.1%
      17.0%                                                                      19.0%
                               17.0%

      16.0%                                                                      17.0%
                                                           15.9%
                                                                                                                16.6%
      15.0%                                                                      15.0%
                    Q1              Q2                Q3            Q4                        Q1           Q2                Q3              Q4

                 RG1 - FY'20           RG1 - FY'21            RG1 - FY'22                     RG2 -FY'20        RG2 -FY'21          RG2 -FY'22

18|Copyright © 2021 Azure Power |www.azurepower.com
DSO by Counterparty

                                                                                                        Amounts in US$ million

                                                                                                        On time/
                                                                                                                                   Past due
                                                                                       Net               Within      Past due up                  DSO
                  Customer Name                              Capacity (MW)                                                       more than 365
                                                                                    Receivables          grace       to one year                 days (2)
                                                                                                                                     days
                                                                                                        period(1)

                                                                     1,039               15.8              15.8          -             -           63
                SECI , NTPC, NVVN
                                                                      50                 12.7               1.2         5.6           5.9         646
                   Andhra Pradesh
                                                                     250                 22.3               5.5         9.9           6.9         261
                       Karnataka
                                                                      30                  1.2               0.9         0.3            -           116
                     Chhattisgarh

                     Other States                                    683                 15.4              12.1         3.3            -           80

                                                                     2,052               67.4              35.5         19.1         12.8         120

(1) Includes revenue generated but yet to be billed of US$18.2 mn.
(2) DSO is computed on an INR basis

______________________
Exchange rate- INR 74.33 to US$1 (New York closing rate of June 30, 2021). Figures may not add up due to rounding.
    19|Copyright © 2021 Azure Power |www.azurepower.com
Use of Non-GAAP Financial Measures: EBITDA
 Adjusted EBITDA is a non-GAAP financial measure. We present Adjusted EBITDA as a supplemental measure of its performance. This
 measurement is not recognized in accordance with USGAAP GAAP and should not be viewed as an alternative to USGAAP GAAP
 measures of performance. The presentation of Adjusted EBITDA should not be construed as an inference that the Company’s future results
 will be unaffected by unusual or non-recurring items.
 We define Adjusted EBITDA as net loss (income) plus (a) income tax expense, (b) interest expense, net, (c) depreciation and amortization,
 (d) loss (income) on foreign currency exchange, (e) Other expenses/ (income) and (f) Impairment loss. We believe Adjusted EBITDA is
 useful to investors in evaluating our operating performance because:
 • Securities analysts and other interested parties use such calculations as a measure of financial performance and debt service
    capabilities; and
 • it is used by our management for internal reporting and planning purposes, including aspects of its consolidated operating budget and
    capital expenditures.
 Adjusted EBITDA has limitations as an analytical tool, and you should not consider it in isolation or as a substitute for analysis of the
 Company’s results as reported under USGAAP GAAP. Some of these limitations include:
 • it does not reflect its cash expenditures or future requirements for capital expenditures or contractual commitments or foreign exchange
    gain/loss;
 • it does not reflect changes in, or cash requirements for, working capital;
 • it does not reflect significant interest expense or the cash requirements necessary to service interest or principal payments on its
    outstanding debt;
 • it does not reflect payments made or future requirements for income taxes; and
 • although depreciation and amortization are non-cash charges, the assets being depreciated and amortized will often have to be replaced
    or paid in the future and Adjusted EBITDA does not reflect cash requirements for such replacements or payments.
 Investors are encouraged to evaluate each adjustment and the reasons we consider it appropriate for supplemental analysis. For more
 information, please see the table captioned “Reconciliations of Non-GAAP Measures to Comparable GAAP Measures” in this presentation.

 20|Copyright © 2021 Azure Power |www.azurepower.com
Reconciliation of Non-GAAP Measures to Comparable GAAP measures
                                                                                    Quarter Ended June 30,
                                                                                          (in million)
                                                                               2020          2021         2021
                                                                               INR            INR          US$
       Net Profit                                                               46          697           9.6
       Income tax expense/ (income)                                            317          (144)        (1.9)
       Interest expense, net                                                   2,163       2,249         30.2

       Other expense                                                            6            2             -

       Depreciation and amortization                                           755          819          11.0

       Impairment loss                                                           -           26           0.3

       Loss on foreign currency exchange                                        17           19           0.2

       Adjusted EBITDA                                                         3,304       3,668         49.4

   __________________________
  Exchange rate- INR 74.33 to US$1 (New York closing rate of June 30, 2021).
  .

21|Copyright © 2021 Azure Power |www.azurepower.com
Use of Non-GAAP Financial Measures: Cash Flow to Equity (CFe)
Cash Flow to Equity is a Non-GAAP financial measure. We present CFe as a supplemental measure of our performance. This measurement is not
recognized in accordance with U.S. GAAP and should not be viewed as an alternative to U.S. GAAP measures of performance. The presentation of
CFe should not be construed as an inference that our future results will be unaffected by unusual or non-recurring items. We believe GAAP metrics
such as net income (loss) and cash from operating activities do not provide with the same level of visibility into the performance and prospects of our
operating business as a result of the long term capital-intensive nature of our businesses, non-cash depreciation and amortization, cash used for debt
servicing as well as investments and costs related to the growth of our business. Our business owns high-value, long-lived assets capable of
generating substantial Cash Flow to Equity over time. We define CFe as profit before tax (the most comparable GAAP metric), adjusted for net cash
provided for used/in operating activities, other than changes in operating assets and liabilities, income and deferred taxes and amortization of hedging
costs; less: cash paid for income taxes, debt amortization and maintenance capital expenditure. We believe that changes in operating assets and
liabilities is cyclical for cash flow generation of our assets, due to our high growth environment. Furthermore, to reflect the actual cash outflows for
income tax, we deduct income and deferred taxes computed under US GAAP and presented in our consolidated financial statements and instead
include the actual cash tax outflow during the period, are considered as part of interest expense. We believe that external consumers of our financial
statements, including investors and research analysts, use Cash Flow to Equity both to assess Azure Power’s performance and as an indicator of its
success in generating an attractive risk-adjusted total return, assess the value of the business and the platform. In addition, we use CFe internally to
forecast long term financing needs and to determine equity returns on our projects.
We have disclosed CFe for our operational assets on a consolidated basis, which is not the Cash from Operations of the Company on a consolidated
basis. We believe CFe supplements GAAP results to provide a more complete understanding of the financial and operating performance of our
businesses than would not otherwise be achieved using GAAP results alone. Cash Flow to Equity should be used as a supplemental measure and not
in lieu of our financial results reported under GAAP. We have also bifurcated the CFe into Operational Assets and Others, as defined below, so that
users of this financial statement are able to understand the Cash generation from our operational assets. We define our Operational Assets, as the
Projects which had commenced operations on or before the year ended June 30, 2020, the operational assets represent the MW operating as of that
date. We define Others as the project SPV’s which are under construction, or under development - as provided on page 55 of Form 20F, Corporate
which includes our three Mauritius entities, the other than projects covered under operational assets, as well as, a company incorporated in USA and
other remaining entities under the group.

22|Copyright © 2021 Azure Power |www.azurepower.com
Cash Flow to Equity (CFe)
                                                                                  For the quarter ended                                         For the quarter ended
 (US $ million)
                                                                                      June 30, 2020                                                 June 30, 2021
                                                                                 Operating             Others                Total           Operating       Others     Total
Sale of power                                                                       53.0                  -                  53.0               59.7            -        59.7
Cost of operations                                                                   3.5                  -                   3.5                4.6            -         4.6
General and administrative                                                           1.7                 3.3                  5.0                1.9           3.8        5.7
Adjusted EBITDA                                                                     47.8                (3.3)                44.5               53.2          (3.8)      49.4
Impairment loss                                                                       -                   -                    -                 0.3            -         0.3
Depreciation and amortization                                                       10.1                 0.1                 10.2               10.9           0.1       11.0
Operating income/ (loss)                                                            37.7                (3.4)                34.3               42.0          (3.9)      38.1
Interest expense, net                                                               26.7                 2.4                 29.1               26.7           3.4       30.1
Other expense/ Income                                                                 -                  0.1                  0.1                 -             -          -
Loss/(gain) on foreign currency exchange, net                                        0.3                (0.1)                 0.2                0.2            -         0.2
Profit/(loss) before Income Tax                                                     10.7                (5.7)                 4.9               15.1          (7.3)       7.8
Add: Depreciation and amortization                                                  10.1                 0.1                 10.2               10.9           0.1       11.0
Add: Impairment loss                                                                  -                   -                    -                 0.3            -         0.3
Add: Foreign exchange loss, net                                                      0.3                (0.1)                 0.2                0.2           0.1        0.3
Add: Ancillary cost of borrowing                                                     0.8                 0.8                  1.6                0.8           0.5        1.3
Add: Other items from the Statement of Cash Flows(1)                                 3.4                 1.0                  4.4                0.3           1.6        1.9
Less: Cash paid for income taxes                                                    (0.8)               (0.4)                (1.2)              (0.4)         (2.2)      (2.6)
Less: Debt Amortization(2)                                                          (2.6)                 -                  (2.6)              (2.4)           -        (2.4)
Less: Maintenance Capital expenditure(3)                                             0.0                  -                    -                  -             -          -
Cfe                                                                                 21.9                (4.3)               17.5(4)             24.8          (7.2)     17.6(4)
     __________________________
    All amounts for the quarter 2021 and 2020 have been translated at an exchange rate- INR 74.33 to US$1 (New York closing rate of June 30, 2021).
  23|Copyright © 2021 Azure Power |www.azurepower.com
Cash Flow to Equity (CFe) – Contd.
(1)     Items from the Statement of Cash Flows. Other items include: loss on disposal of property plant and equipment of US$ 0.1 million and Nil, share based
        compensation of US$ 0.9 million and US$ 1.5 million, realized gain on investment of Nil and Nil, non-cash rent expense of US$ 0.1 million and US$ 0.1 million,
        allowance for doubtful debts of US$ 0.2 million and Nil, loan repayment charges of US$ 3.1 million and Nil, employee benefits of Nil and US$ 0.2 million and ARO
        accretion of US$ 0.1 million and US$ 0.2 million for the quarter ended June 30, 2020 and June 30, 2021 respectively.
(2)     Repayments of term and other loans during the quarter ended June 30, 2021, was US$ 21.0 million (refer to the Statement of Cash Flows) which includes US$ 18.6
        million related to refinancing of loans, extinguishment, repayment of debt and payments for hedge and have been excluded to determine debt amortization of US$
        2.4 million. Repayments of term and other loans during the quarter ended June 30, 2020, was US$ 75.0 million (refer to the Statement of Cash Flows) which
        includes US$ 72.5 million related to refinancing of loans, extinguishment, repayment of debt and payments for hedge and has been excluded to determine debt
        amortization of US$ 2.5 million. Further, the amount for current quarter does not includes repayment of Borrowings amounting to US$ 4.0 million relating to Capital
        expenditure relating to re-powering of certain existing projects. The Repayment term of these loan was 3 years.
(3)     Classification of Maintenance Capital Expenditures and Growth Capital Expenditures All our capital expenditures are considered Growth Capital Expenditures. In
        broad terms, we expense all expenditures in the current period that would primarily maintain our businesses at current levels of operations, capability, profitability or
        cash flow in operations and maintenance and therefore there are no Maintenance Capital Expenditures. Growth capital expenditures primarily provide new or
        enhanced levels of operations, capability, profitability or cash flows.
(4)     Reconciliation of total Cfe to cash from operations:
                                                                                                                                For the quarter ended   For the quarter ended
               (US$ million)                                                                                                        June 30, 2020          June 30, 2021
                 Cfe                                                                                                                     17.5                   17.6
                 Items included in GAAP Cash Flow from Operating Activities but not considered in
                 Cfe
                 Change in Current assets and liabilities as per statement of cash flow                                                    (30.1)              (15.3)
                 Current income taxes                                                                                                       (4.7)               (0.8)
                 Prepaid lease payments                                                                                                     (0.6)               (0.1)
                 Amortization of hedging costs                                                                                               6.6                 6.4
                 Items included in Cfe but not considered in GAAP Cash Flow from Operating
                 Activities
                 Debt amortization as per Cfe                                                                                               2.6                 2.4
                 Cash taxes paid as per Cfe                                                                                                 1.2                 2.6
                 Cash from Operating Activities                                                                                            (7.5)               12.8
         __________________________
        All amounts for the years 2021 and 2020 have been translated at exchange rate- INR 74.33 to US$1 (New York closing rate of June 30, 2021).
      24|Copyright © 2021 Azure Power |www.azurepower.com
Projects Commissioned - Utility
As on June 30, 2021
                                   Commercial                                                                                                                                                Duration
                                                       PPA Capacity         DC Capacity                Tariff
      Project Names                 Operation                                                                                                     Off taker                                  of PPA in
                                                          (MW)                (MW)                  (INR/kWh)
                                     Date(1)                                                                                                                                                   Years
Operational – Utility
Punjab 1 (3)                         Q4 2009                 2                     2                  17.91           NTPC Vidyut Vyapar Nigam Limited                                           25
Punjab 2.1 (3)                       Q3 2014                 15                   15                   7.67           Punjab State Power Corporation Limited                                     25
Punjab 2.2 (3)                       Q4 2014                 15                   15                   7.97           Punjab State Power Corporation Limited                                     25
Punjab 2.3 (3)                       Q4 2014                 4                     4                   8.28           Punjab State Power Corporation Limited                                     25
Karnataka 1 (3)                      Q1 2015                 10                   10                   7.47           Bangalore Electricity Supply Company Limited                               25
Uttar Pradesh 1 (3)                  Q1 2015                 10                   12                   8.99           Uttar Pradesh Power Corporation Limited                                    12
Gujarat 1.1 (3)                      Q2 2011                 5                     5                 15.00(4)         Gujarat Urja Vikas Nigam Limited                                           25
Gujarat 1.2 (3)                      Q4 2011                 5                     5                 15.00(4)         Gujarat Urja Vikas Nigam Limited                                           25
Rajasthan 1                          Q4 2011                 5                     5                  11.94           NTPC Vidyut Vyapar Nigam Limited                                           25
Rajasthan 2.1                        Q1 2013                 20                   23                   8.21           NTPC Vidyut Vyapar Nigam Limited                                           25
Rajasthan 2.2                        Q1 2013                 15                   18                   8.21           NTPC Vidyut Vyapar Nigam Limited                                           25
Rajasthan 3.1 (3)                    Q2 2015                 20                   22                  5.45(2)         Solar Energy Corporation of India                                          25
Rajasthan 3.2 (3)                    Q2 2015                 40                   43                  5.45(2)         Solar Energy Corporation of India                                          25
Rajasthan 3.3 (3)                    Q2 2015                 40                   41                  5.45(2)         Solar Energy Corporation of India                                          25
Chhattisgarh 1.1                     Q2 2015                 10                   10                   6.44           Chhattisgarh State Power Distribution Company Ltd                          25
Chhattisgarh 1.2                     Q2 2015                 10                   10                   6.45           Chhattisgarh State Power Distribution Company Ltd                          25
Chhattisgarh 1.3                     Q3 2015                 10                   10                   6.46           Chhattisgarh State Power Distribution Company Ltd                          25
Rajasthan 4 (3)                      Q4 2015                 5                     6                  5.45(2)         Solar Energy Corporation of India                                          25
Delhi 1.1                            Q4 2015                 2                     2                  5.43(2)         Solar Energy Corporation of India                                          25
Karnataka 2                          Q1 2016                 10                   12                   6.66           Bangalore Electricity Supply Company Limited                               25
Andhra Pradesh 1 (3)                 Q1 2016                 50                   54                  6.63(4)         Southern Power Distribution Com of AP Ltd                                  25
Punjab 3.1(3)                        Q1 2016                 24                   25                   7.19           Punjab State Power Corporation Limited                                     25
Punjab 3.2(3)                        Q1 2016                 4                     4                   7.33           Punjab State Power Corporation Limited                                     25

 (1) Refers to the applicable quarter of the calendar year. There can be no assurance that our projects under construction and our awarded /contracted projects will be completed on time or at all., (2)
 Projects are supported by viability gap funding in addition to the tariff, (3) Projects under Restricted Group, (4) Current tariff, subject to escalation/change, as per PPA

    25|Copyright © 2021 Azure Power |www.azurepower.com
Projects Commissioned– Utility and C&I
 As on June 30, 2021
                                              Commercial                PPA                                                                                                              Duration
                                                                                   DC Capacity          Tariff
          Project Names                        Operation              Capacity                                                                  Off taker                                of PPA in
                                                                                     (MW)            (INR/kWh)
                                                Date(1)                (MW)                                                                                                                Years
 Operational – Utility
 Bihar 1 (3)                                      Q3 2016               10                11              8.39         North & South Bihar Power Distribution Company Ltd                   25
 Punjab 4.1(3)                                    Q4 2016               50                52              5.62               Punjab State Power Corporation Limited                         25
 Punjab 4.2(3)                                    Q4 2016               50                52              5.63               Punjab State Power Corporation Limited                         25
 Punjab 4.3(3)                                    Q4 2016               50                52              5.64               Punjab State Power Corporation Limited                         25
 Karnataka 3.1 (3)                                Q1 2017               50                54              6.51            Chamundeshwari Electricity Supply Company                         25
 Karnataka 3.2(3)                                 Q1 2017               40                42              6.51               Hubli Electricity Supply Company Limited                       25
 Karnataka 3.3(3)                                 Q1 2017               40                42              6.51            Gulbarga Electricity Supply Company Limited                       25
 Maharashtra 1.1(3)                               Q1 2017               2                  2             5.50(2)                   Ordnance Factory, Bhandara                               25
 Maharashtra 1.2(3)                               Q1 2017               5                  6              5.31                     Ordnance Factory, Ambajhari                              25
 Andhra Pradesh 2                                 Q2 2017              100               130              5.12                              NTPC Limited                                    25
 Uttar Pradesh 2                                Q2 - Q3 2017            50                59              4.78                              NTPC Limited                                    25
 Telangana 1(3)                                   Q1 2018              100               128              4.67                              NTPC Limited                                    25
 Uttar Pradesh 3(3)                               Q2 2018               40                51             4.43(2)                Solar Energy Corporation of India                           25
 Andhra Pradesh 3(3)                              Q2 2018               50                59             4.43(2)                Solar Energy Corporation of India                           25
 Gujarat 2(3)                                     Q4 2018              260               363              2.67                  Gujarat Urja Vikas Nigam Limited                            25
 Karnataka 4.1(3)                                Q1 2019               50                 75              2.93                Bangalore Electricity Supply Company                          25
 Karnataka 4.2(3)                                Q1 2019               50                 75              2.93               Hubli Electricity Supply Company Limited                       25
 Rajasthan 5                                    Q2-Q3 2019             200               262              2.48                  Solar Energy Corporation of India                           25
                                                                                                                        Maharashtra State Electricity Distribution Company
 Maharashtra 3(3)                                 Q3 2019               130              195              2.72                                                                              25
                                                                                                                                                Limited
 Assam 1                                          Q3 2020               37                49              3.34                  Assam Power Distribution Company                            25
 Rajasthan 6                                  Q4 2020-Q1 2021          350               500              2.53                   Solar Energy Corporation of India                          25
 Others(4)                                    Q1 2018 – Q4 2019         7                 10             3.36(5)
 Total Operational Capacity – Utility                                  2,052            2,622

1) Refers to the applicable quarter of the calendar year in which commercial operations commenced or are scheduled to commence based on AC capacity. There can be no assurance that our projects
under construction and our Contracted projects will be completed on time or at all (2) Projects are supported by viability gap funding, in addition to the tariff, 3) Projects under Restricted Group,
4) Others include projects with Hindustan Aeronautics Limited (HAL), Decathlon and other offtakers, 5) Levelized tariff; includes capital incentive.
    26|Copyright © 2021 Azure Power |www.azurepower.com
Under Construction Projects –Utility and C&I
As on June 30, 2021
                                              Expected Commercial            PPA Capacity                  Tariff                                                                   Duration of PPA in
             Project Names                                                                                                                        Off taker
                                                Operation Date (1)              (MW)                    (INR/kWh)                                                                         Years
  Under Construction
 Assam 1#(3)                                           Q1 2022                     53                      3.34            Assam Power Distribution Company                                    25

 Rajasthan 6#                                          Q4 2021                    250                      2.53            Solar Energy Corporation of India                                   25

 Rajasthan 8#                                          Q4 2021                    300                      2.58            Solar Energy Corporation of India                                   25

 Rajasthan 9#                                          Q1 2022                    300                      2.54            Solar Energy Corporation of India                                   25

 Total Under Construction- Utility                                                903
 Total Operating and Under
                                                                                 2,955
  Construction Portfolio
 Awarded

 2 GW Project 1                                                                 2,000 (2)                                  Solar Energy Corporation of India                                   25

 2 GW Project 2                                                                 2,000 (2)                                  Solar Energy Corporation of India                                   25

 Total Awarded Capacity- Utility                                                 4,000
 Total Portfolio                                                                 6,955

    (1) Refers to the applicable quarter of the calendar year. There can be no assurance that our projects under construction and our awareded projects will be completed on time or at all.
    (2) Company has been awarded LOA for 4GW solar projects under SECI manufacturing linked tender and has not signed a PPA.
    (3) 12.5 MW commissioned in May 2021 and In Rajasthan 6 – 50 MW is commissioned in June 2021
    # Due to the COVID-19 pandemic, there is uncertainty around the timing of construction of projects and this is our best estimate of completion.

    27|Copyright © 2021 Azure Power |www.azurepower.com
Debt Overview
As of June 30, 2021

                                                                                            Maturity Profile (1,2,3)
                        $600
                                                                      $487.4
                        $500
                                                                                                                         $375.0
         US$ Millions

                        $400
                                        $321.4
                        $300
                        $200                                                                                                                                        $140.0
                                                                                                                                             $89.6
                        $100                                                                  $33.8
                          $0
                                        FY'22                         FY'23                   FY'24                      FY'25             FY'26 - 29           FY'30 & Beyond

                               Debt Split by Currency                                     LT vs ST Debt Split
                                     INR Debt    Foreign Debt                         Short Term Debt   Long Term Debt
                                                            310.3 ,                                                               Consolidated Debt (2, 3, 4)                    $ 1,447.2
                                                             21%
                                                                                                                    $326.5 ,      Average Interest Rate                              8.9%
                                                                                                                     23%

                           1,136.9
                                                                               $1,120.7
                           , 79%                                                                                                  Balance average debt maturity
                                                                                , 77%
                                                                                                                                  for LT debt                                     5.0 years

    1) This represents the last repayment period. These loans are repayable on a quarterly or semi-annual basis. For repayment by period of the above-mentioned loans, refer to contractual
       obligation and commercial commitments. 2) Exchange rate- INR 74.33 to US$1 (New York buying rate of June 30, 2021)​​. 3) The Company carries the hedging asset of US$ 93.3
       million as of June 30, 2021 against foreign currency loans/borrowings to be settled over loan tenure. 4) Project level debt of INR 1,963 million (US$ 26.4 million) pertaining to rooftop
       entities under sale have been classified under Liabilities directly associated with assets classified as held for sale and not considered under consolidated debt.
   28|Copyright © 2021 Azure Power |www.azurepower.com
Project Debt Schedule
As of June 30, 2021
                                               Outstanding Principal Amount (In millions)               Type of Interest             Currency          Maturity Date(1)      Commissioned/
            Name of Project
                                                   INR                       US$ (2)                                                                                        Under construction

Rajasthan 6                                      16,139                       217.1                         Floating                 INR/US$              2021-2040        Partly commissioned
Andhra Pradesh 1                                  2,508                        33.7                          Fixed                     INR                  2022             Commissioned
Bihar 1                                            439                          5.9                          Fixed                     INR                  2022             Commissioned
Gujarat 1                                          928                         12.5                          Fixed                     INR                  2022             Commissioned
Karnataka 1                                        498                         6.7                           Fixed                     INR                  2022             Commissioned
Karnataka 3.1                                     1,330                        17.9                          Fixed                     INR                  2022             Commissioned
Karnataka 3.2                                     1,364                        18.4                          Fixed                     INR                  2022             Commissioned
Karnataka 3.3                                     6,482                        87.2                          Fixed                     INR                  2022             Commissioned
Punjab 1                                           174                          2.3                          Fixed                     INR                  2022             Commissioned
Punjab 2                                          1,699                        22.9                          Fixed                     INR                  2022             Commissioned
Punjab 4                                          5,810                        78.2                          Fixed                     INR                  2022             Commissioned
Rajasthan 3.1                                      867                         11.7                          Fixed                     INR                  2022             Commissioned
Rajasthan 3.2                                     1,700                        22.9                          Fixed                     INR                  2022             Commissioned
Rajasthan 3.3                                     1,775                        23.9                          Fixed                     INR                  2022             Commissioned
Rajasthan 4                                        236                          3.2                          Fixed                     INR                  2022             Commissioned
Telangana 1                                       4,610                        62.0                          Fixed                     INR                  2022             Commissioned
Uttar Pradesh 1                                    453                         6.1                           Fixed                     INR                  2022             Commissioned
Gujarat 2                                         9,188                       123.6                          Fixed                     INR                  2024             Commissioned
Maharashtra 3                                     5,238                        70.5                          Fixed                     INR                  2024             Commissioned
Karnataka 4                                       3,934                        52.9                          Fixed                     INR                  2024             Commissioned
Maharashtra 1.1 & 1.2                              325                          4.4                          Fixed                     INR                  2024             Commissioned
Uttar Pradesh 3                                   1,778                        23.9                          Fixed                     INR                  2024             Commissioned
Andhra Pradesh 3                                  2,179                        29.3                          Fixed                     INR                  2024             Commissioned
   1) This represents the last repayment period. These loans are repayable on a quarterly or semi-annual basis. For repayment by period of the above-mentioned loans, refer to contractual
   obligation and commercial commitments. 2) Exchange rate- INR 74.33 to US$1 (New York buying rate of June 30, 2021)​​.
    29|Copyright © 2021 Azure Power |www.azurepower.com
Project Debt Schedule
As of June 30, 2021

                                       Outstanding Principal Amount (In millions)             Type of Interest           Currency              Maturity Date(1)           Commissioned/
         Name of Project
                                                                                                                                                                         Under construction
                                             INR                       US$ (5)

 Punjab 3.1 and 3.2                          1,219                       16.4                      Fixed                    INR                     2024                   Commissioned

 Chhattisgarh 1.1,1.2 & 1.3                 1,192                        16.0                     Floating                  INR                     2029                   Commissioned

 Rajasthan 1                                  435                         5.9                      Fixed                    INR                     2031                   Commissioned

 Rajasthan 2                                2,396                        32.2                      Fixed                    INR                     2033                   Commissioned

 Karnataka 2                                 390                          5.2                     Floating                  INR                     2034                   Commissioned

 Andhra Pradesh 2                           5,074                        68.3                     Floating                  INR                     2036                   Commissioned

 Uttar Pradesh 2                             2,092                       28.1                     Floating                  INR                     2037                   Commissioned

 Rajasthan 5                                 5,904                       79.4                      Mixed                    INR                     2038                   Commissioned

 Assam 1                                    1,999                        26.9                     Floating                  INR                     2039                Partly commissioned

 Rooftop Projects (4), (5)                  3,404                        45.8                      Mixed                 INR/US$                  2022-31                  Multiple projects

                                         93,757 (2)(3)                 1,261.4
 Total

  1) This represents the last repayment period. These loans are repayable on a quarterly or semi-annual basis. For repayment by period of the above-mentioned loans, refer to contractual
  obligation and commercial commitments. 2) This amount is presented in the financials as net of ancillary cost of borrowing of INR 1,101 million (US$ 14.8 million). 3) Non-project level debt
  of INR 16,043 million (US$ 215.8 million) is excluded from the above table. Further foreign exchange fluctuation of INR 7,769 million (US$ 104.5 million) is in respect of project debt against
  which the company has taken hedge. 4) Project level debt of INR 1,963 million (US$ 26.4 million) pertaining to rooftop entities under sale have been classified under Liabilities directly
  associated with assets classified as held for sale. 5) Rooftop Projects includes, Delhi Rooftop 4, Gujrat rooftop, Punjab Rooftop 2, Railway 1, DJB, DMRC and SECI. 6) Exchange rate- INR
  74.33 to US$1 (New York buying rate of June 30, 2021)​​.

    30|Copyright © 2021 Azure Power |www.azurepower.com
Glossary of Select Terms
Accelerated Depreciation – Accelerated depreciation can be elected at the project level, such that projects that reach COD in the first half of the fiscal year can expense
  100% of eligible project costs in year 1, and otherwise can expense 50% of project costs in year 1 and the remainder thereafter. After March 31, 2017, projects that reach
  COD in the first half of the fiscal year will be eligible to expense 60% of project costs in fiscal year 1
Balance of System (BOS) – The non-module costs of a solar system
Basic Custom Duty (BCD) - a proposed tax on imported modules from most countries outside India. The final tax rate and periods have yet to be established.
Awarded Projects – Solar power plants that pursuant to customer won in an auction but for which a contract has not ben entered
Contracted Projects – Solar power plants that have signed PPAs, or are under-construction but not commissioned.
Cash Flow to Equity (CFe) – profit before tax (the most comparable GAAP metric), adjusted for net cash provided for used/in operating activities, other than changes in
  operating assets and liabilities, income and deferred taxes and amortization of hedging costs; less: cash paid for income taxes, debt amortization and maintenance capital
  expenditure. LTM are actuals and projections assume normalized debt amortization over 20 years.
                                                                    Outstanding amount∗Period
Day Sales Outstanding (DSO)- Days Sales Outstanding (DSO) =                                     DSO represents the average no of days taken to recognize the revenue
                                                                     Total Sales for the period
   against sale of power
Gross Margin - Revenue less cost of operations
Ministry of New and Renewable Energy (MNRE) – A Government of India ministry whose broad aim is to develop and deploy new and renewable energy to supplement
   India’s energy requirements
Power Purchase Agreement (PPA) shall mean the Power Purchase Agreement signed between off-taker and the Company for procurement of contracted capacity of solar
  power
Renewable Purchase Obligations (RPO) – Requirements specified by State Electricity Regulatory Commissions (SERCs) as mandated by the National Tariff Policy 2006
  obligating distribution companies to procure solar energy by offering preferential tariffs.
Safe Guard Duty (SGD) – a tax on imported modules from most countries outside India which is 14.9% from July 30, 2020 – January 2021 and 14.5% from January 2021 to
   June 2021.

   31|Copyright © 2021 Azure Power |www.azurepower.com
Affordable Solar Power for Generations
                        Excellence | Honesty | Social Responsibility | Entrepreneurship
32|Copyright © 2021 Azure Power |www.azurepower.com
You can also read