Approved, March 23, 2021 - The Borough of Park Ridge
←
→
Page content transcription
If your browser does not render page correctly, please read the page content below
Approved, March 23, 2021
                                                                                Virtually Zoom
                                                                                Park Ridge, NJ

                             MAYOR AND COUNCIL MEETING
                                 WORK SESSION
                                March 09, 2021
                                    6:45P.M.

Present:      Councilmembers Capilli, Cozzi, Epstein, Fenwick, Ferguson, Metzdorf, and
              Mayor Misciagna
Absent:
Also Present: Julie Falkenstern, BA
              Magdalena Giandomenico, Borough Clerk
              Durene Ayer, Borough CFO
              John Schettino, Esq. Utility Attorney
              Bill Beattie, Operations Director
              Tim Kennedy, Utility Board Member
              Jeff Rutowski, Utility Board Member

Mayor Misciagna read the compliance statement earlier as required by the Open Public
Meeting Act, P.L. 1975, and Chapter 231.

   I.      Presentation: “Tutorial on Wholesale Power Delivery for the for Park Ridge Electric
           Department: Benefits of Peak Shaving Generation Plant” By: Bill Beattie, also
           present Jeff Rutkowski and Tim Kennedy
                *Please see the presentation attached at the end of the minutes.
                   i. Councilman Capilli asked when we say gas, do we mean diesel or natural?
                       It would be natural Bill Beattie said.
                  ii. Councilman Fenwick asked if we have a company run a plant will that
                       effect our de facto monopoly that our municipal power company has
                       providing power to our residents, would another company now be able to
                       sell power? Bill Beattie said no. Councilman Fenwick also asked what is
                       the lifespan of a gas power peak shaving plant? Bill Beattie 25-30 years.
                       Councilman Fenwick asked would a natural gas plant put additional
                       requirements or burdens on our fire department, regarding additional
                       certificates or equipment? Bill Beattie doesn’t think so, but he would
                       double check.
                 iii. Mayor Misciagna stated that we now have a possession of about 30 acres
                       of wetlands because of our affordable housing settlement, which can
                       maybe be used.
                 iv. Mayor Misciagna asked if everyone is comfortable with Bill Beattie and
                       the Utility Board going to the next step and exploring this with more
                       detail, all in favor.

                                                                                               1
II.    Administrator Report Borough Administrator Falkenstern updated the Mayor and
          Council on:
          a. Gas Usage – Considering what occurred in Palisades Park, Tom Padilla and Julie
             Falkenstern are looking at the two towns gas usage and making sure everything is
             documented. It is monitored, but Woodcliff Lake and Park Ridge are
             reconfirming since they use the Borough pumps.
          b. Parking Passes: Parking passes for the commuter lot are up in April, that is the
             normal year cycle. Last year the Borough only sold 50 passes in 2020 by April
             and with Covid we stopped buying them. To make is smooth this year, the
             Borough will not issue refunds, but will allow those sold to be valid in 2021 and
             use the remainder of the 2020 stickers in 2021 to not buy new ones.
          c. Marijuana Ordinance: It was distributed to everyone this afternoon for
             introduction on 3/23/2021 and if anyone has any additional questions please
             contact the Borough Attorney. Council President Epstein said Bocchi did speak to
             PIM’s attorney and they are okay with it and they appreciated the Borough
             working together with Borough businesses.

   III.   CFO Report: Borough CFO Durene Ayer spoke about the current operations of the
          finance department. The draft budget will be presented shortly.
                  i. Councilman Capilli asked with the budget, that the Police Chief asked for
                     the breakage in the retiring officers’ salary be applied to overtime, is that
                     occurring? Councilman Fenwick said that is something which is still being
                     discussed.

   IV.    PRAA: Councilmen Ferguson spoke about the need for two more defibrillators,
          which cost around $1,600 apiece. One for Colony field and one for the Sulak field,
          we have one for memorial field. PRAA also maintains the equipment at memorial
          field, which is used by residents and others as well. Councilman Fergusons asked
          about the possibly of using the monies from the field fees to upgrade/fix the
          equipment there and purchase the two defibrillators. Council President Epstein agreed
          that if we buy them, they should be paid for by field fees and maybe registration fees.
          Borough Administrator Falkenstern said the contractual item that comes out of the
          field fees is the lightning detection, but she will look into what amount is available in
          field fees and maybe some of that money can also come out of open space.

Open Work Session adjourned to Closed Session at 7:55pm
On a motion made by Council President Epstein and Seconded by Councilman Metzdorf to
confirm. Motion carried unanimously.

Respectfully submitted,

Magdalena Giandomenico

                                                                                                  2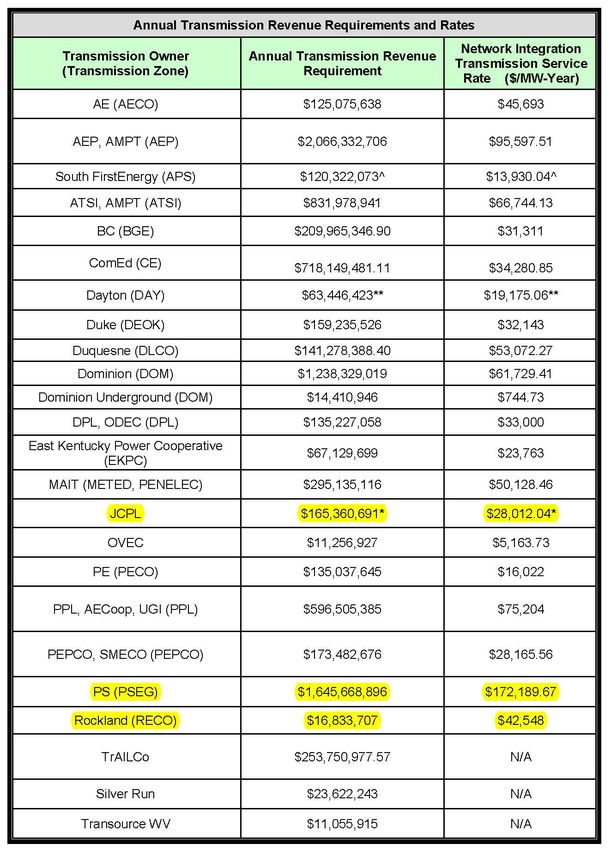
Tutorial on Wholesale Power
Delivery for the for Park Ridge
     Electric Department
    Benefits of Peak Shaving
       Generation Plant
                                  3
Components of Power Delivery System from Generation to Customer

                                                             4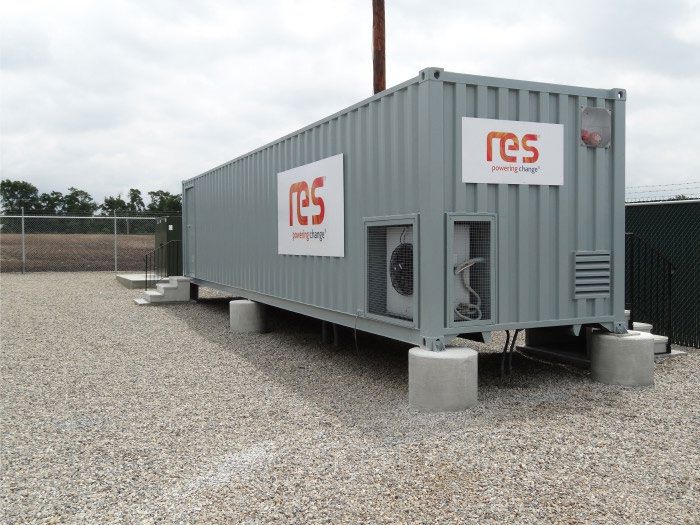
Components of Power Delivery System from Generation to Customer

Nuclear

                                                                  Other Generation
                                                                  - Coal
                                                                  - Solar
  Natural                                 Oil                     - Wind
  Gas                                                             - Hydro

                     Generation   - Where the Energy is Created               5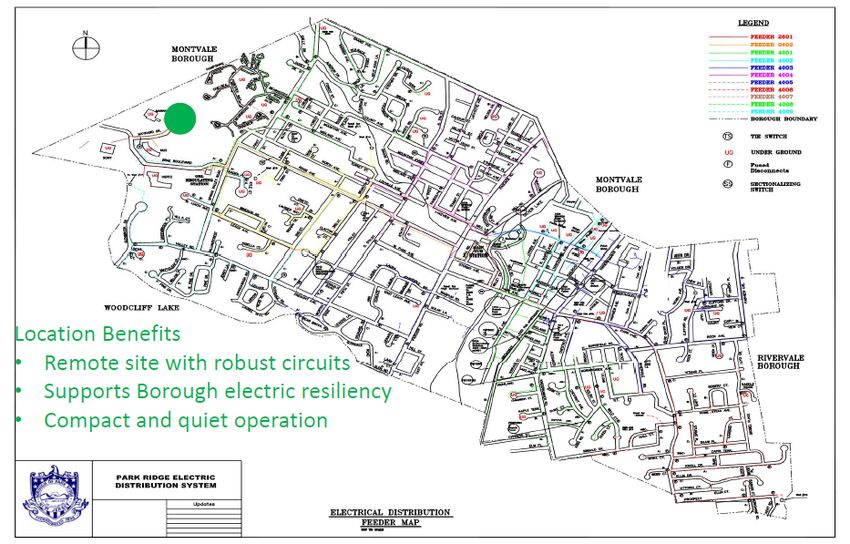
Components of Power Delivery System from Generation to Customer

                                         Switching
        Transmission                     Stations
        Lines and
        Towers

Transmission - Grid that delivers energy to different regions of the country
                                                                         6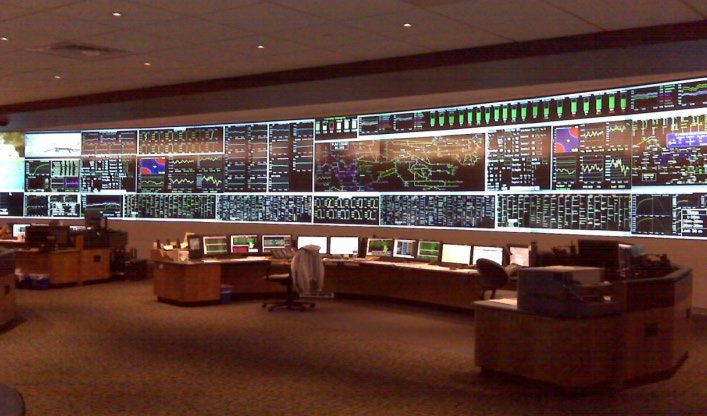
Components of Power Delivery System from Generation to Customer
                                                                   Distribution
                                                                   lines and poles
                             Substation
                             (e.g. Mill Rd.
                             Sub)

                                                           Customers
                                                           Residential &
                                                           Commercial

Distribution - Local delivery to end customers – THIS IS WHAT WE DO IN PARK
RIDGE                                                                      7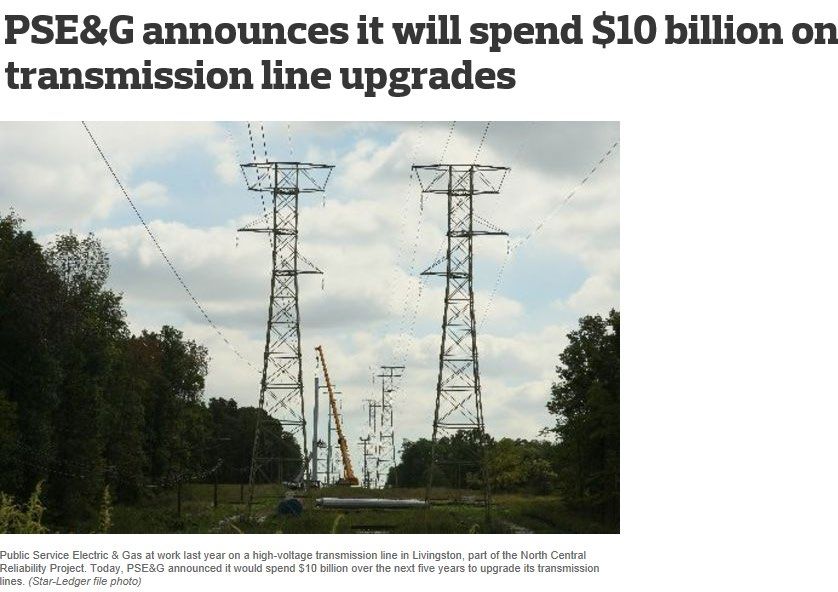
Costs of Power Delivery System from Generation to Customer
                Generation - Energy and Capacity Components
                   Energy                                    Capacity
• The electrical power that is generated      • Many power plants are not needed
  at the power plants (i.e. the electrons       until the high demand periods in the
  that are pushed out of the power              summer or during emergencies.
  plants onto the grid).                      • If power plants only made money by
• Energy is a commodity and we need to          selling energy, many of them would
  purchase all of the energy that is            close and we would not have enough
  delivered and consumed by our                 plants available when needed in the
  customers.                                    summer to meet the peak demand
• The energy market is deregulated and          (which would be catastrophic).
  we purchase our requirements by             • To keep the plants around for when
  going out to the market with                  they are needed, they can get paid to
  competitive RFP’s to only solid credit        be available when called on. This is
  rated energy suppliers.                       called Capacity.
• Price of electricity is closely linked to   • This market is deregulated and
  fuel prices (i.e. natural gas)                generators bid their prices to be
• We have taken advantage of very low           available, and are selected, in annual
  future energy prices and have                 auctions run by our grid operator
  contracted for a majority of our              (PJM).
  energy needs through 2029.                                                    8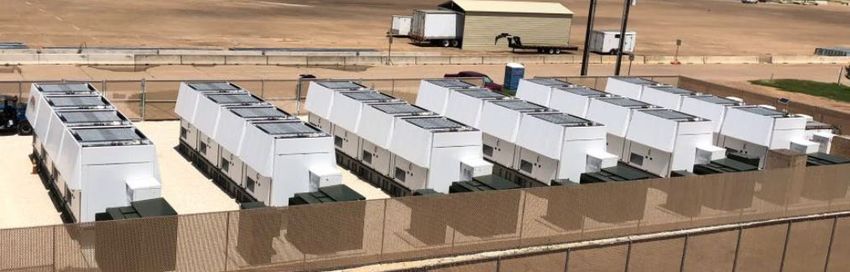
Costs of Power Delivery System from Generation to Customer
                            Transmission
• Transmission costs are what we pay
  for the operation, maintenance,
  and expansion of the regional
  transmission grid.
• The cost for transmission is
  regulated by the Federal Energy
  Regulatory Commission (FERC).
• The PJM transmission grid is
  broken up into delivery zones (we
  are located in the PSEG Zone).
• FERC has approved a number of
  large projects for PSE&G and the
  costs are updated and adjusted
  each year beginning January 1.
• Due to these major
  improvements, our transmission
  costs have increase significantly
  over the past eight years.

                                                                   9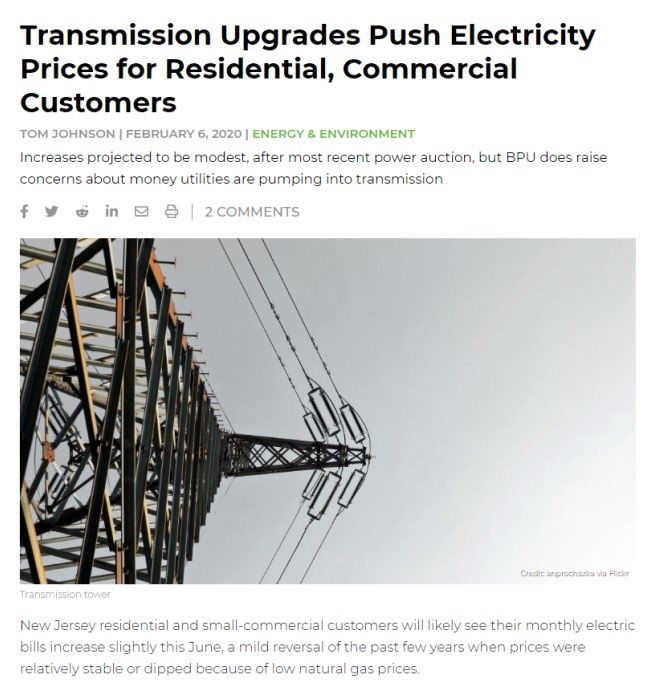
Costs of Power Delivery System from Generation to Customer
                               Distribution
• Distribution is the final component of
  the electric delivery system. This is
                                               Substations
  what we do in Park Ridge.
• The power flows into our Mill Road                               Mill Rd
  substation, it is metered, and then we
  take it from there.
• We own and maintain the Substations
  (Mill Road and Brae Blvd), poles, wires,                       Brae Sub
  transformers, meters, etc.
• The cost for the distribution includes      Transformers
  our operating costs, capital
  expenditures, and debt service
  (approved in our annual budget).
• For Investor-Owned utility companies                            Poles &
  (e.g. PSE&G), the rate charged to the                           Street Lights
  customers for the distribution is
  regulated by the New Jersey Board of        Meters
  Public Utilities.
• In Park Ridge, our rates for this service
  are self-regulated by the Park Ridge                   Power Lines         10
  Mayor and Council.
Costs of Power Delivery System from Generation to Customer
Breakdown of Power Costs & Our Rate Components
2021 Wholesale Power Budget
Energy $ 2,163,862 36.0%
Capacity $ 1,213,031 20.2%
Transmission $ 2,479,119 41.2%
Other $ 159,376 2.6%
Total $ 6,015,387
In 2021, our total residential rate is 15.43¢ per KWH (including the
monthly fixed charge). The approximate component cost
breakdown is as follows:
3.44¢/KWH – Energy Component
1.50¢/KWH – Capacity Component
3.78¢/KWH – Transmission Component
0.20¢/KWH – Other (cost to operate regional grid)
1.02¢/KWH – Losses (transformer/wire losses and unmetered street lighting)
5.49¢/KWH – Distribution Costs (PR’s cost to own and operate the distribution
system and run our electric utility)
11Costs of Power Delivery System from Generation to Customer
Historic Power Costs Components
2011 2012 2013 2014 2015 2016 2017 2018 2019 2020 2021
Energy 4,841,213 4,816,265 4,510,959 4,631,999 4,224,220 3,849,412 3,469,000 3,005,707 2,482,785 2,318,922 2,163,862
Capacity 1,141,999 1,089,868 1,781,839 1,540,924 1,271,843 1,600,007 1,589,000 1,504,889 1,151,548 1,012,037 1,213,031
Transmission 592,446 556,641 789,063 1,093,690 1,374,484 1,165,237 1,609,000 1,991,230 2,512,000 2,545,886 2,479,119
Others 336,811 265,885 252,300 156,156 205,206 121,409 88,000 128,848 112,423 134,588 159,376
Total 6,912,469 6,728,660 7,334,161 7,422,769 7,075,753 6,736,065 6,755,000 6,630,674 6,258,755 6,011,433 6,015,387
12Costs of Power Delivery System from Generation to Customer
Historic Power Costs Components
2011 2012 2013 2014 2015 2016 2017 2018 2019 2020 2021
Energy 4,841,213 4,816,265 4,510,959 4,631,999 4,224,220 3,849,412 3,469,000 3,005,707 2,482,785 2,318,922 2,163,862
Capacity 1,141,999 1,089,868 1,781,839 1,540,924 1,271,843 1,600,007 1,589,000 1,504,889 1,151,548 1,012,037 1,213,031
Transmission 592,446 556,641 789,063 1,093,690 1,374,484 1,165,237 1,609,000 1,991,230 2,512,000 2,545,886 2,479,119
Others 336,811 265,885 252,300 156,156 205,206 121,409 88,000 128,848 112,423 134,588 159,376
Total 6,912,469 6,728,660 7,334,161 7,422,769 7,075,753 6,736,065 6,755,000 6,630,674 6,258,755 6,011,433 6,015,387
The Energy Price component has decreased significantly since 2011
This is the competitive component that we purchase through RFP’s
June 2020-May 2021 June 2023-December 2024
Date Purchased Price Company Date Purchased Price Company
12/15/2016 34.89 BP 5/14/2019 30.78 BP
1/11/2017 32.80 Nextera 9/17/2019 26.34 BP
1/11/2017 31.75 Nextera 9/17/2019 26.77 BP
June 2021-May 2022 Jan 2025-December 2029 (Note: Five Year Contract)
Date Purchased Price Company Date Purchased Price Company
8/28/2017 29.88 Nextera 9/17/2019 27.87 BP
2/15/2018 31.40 PSEG 2/13/2020 28.85 BP
7/10/2018 30.59 Nextera
June 2022-May 2023
Date Purchased Price Company Price shown are in $ per MWH.
7/10/2018 30.20 Nextera 28.85 $/MWH is equal to
1/15/2019 30.65 PSEG 2.885¢/KWH (move the decimal one 13
5/14/2019 31.95 PSEG
place to the left)Costs of Power Delivery System from Generation to Customer
Historic Power Costs Components
2011 2012 2013 2014 2015 2016 2017 2018 2019 2020 2021
Energy 4,841,213 4,816,265 4,510,959 4,631,999 4,224,220 3,849,412 3,469,000 3,005,707 2,482,785 2,318,922 2,163,862
Capacity 1,141,999 1,089,868 1,781,839 1,540,924 1,271,843 1,600,007 1,589,000 1,504,889 1,151,548 1,012,037 1,213,031
Transmission 592,446 556,641 789,063 1,093,690 1,374,484 1,165,237 1,609,000 1,991,230 2,512,000 2,545,886 2,479,119
Others 336,811 265,885 252,300 156,156 205,206 121,409 88,000 128,848 112,423 134,588 159,376
Total 6,912,469 6,728,660 7,334,161 7,422,769 7,075,753 6,736,065 6,755,000 6,630,674 6,258,755 6,011,433 6,015,387
The Transmission component has increased significantly since 2011
This is a FERC regulated component that we pay for the transmission
system to get the power from the generators to our substation.
14How is our
Capacity and
Transmission Costs
Determined
15First you need to know who is PJM?
• PJM Interconnection is the regional transmission organization (RTO) that
coordinates the movement of wholesale electricity in all or parts of
Delaware, Illinois, Indiana, Kentucky, Maryland, Michigan, New Jersey,
North Carolina, Ohio, Pennsylvania, Tennessee, Virginia, West Virginia and
the District of Columbia.
• PJM originally stood for the Pennsylvania-New Jersey-Maryland
Interconnection, with more States joining later.
• Acting as a neutral, independent party, PJM operates the wholesale
electricity market and manages the high-voltage electricity grid to ensure
reliability for more than 65 million people
• In other words, they are the Operator of “The Grid”.
• They also provide the services for efficient wholesale trading and financial
settlement.
16There PJM grid is broken up in to regional
transmission zones
17Location of NJ Municipal Electric Utilities
Regional Transmission Zones
JCPL Zone
PSEG Zone
Butler
Park Ridge
Madison
South River
Lavallette
Milltown
Pemberton
Seaside Heights
Atlantic Electric Zone
Vineland
18Determination of Capacity Rate
• PJM needs to make sure there is enough power plants ready to be
operated when needed. This includes seasonal peaks and during
emergency conditions. This is imperative in order to maintain reliability
of the grid.
• In order to accomplish this, they use statistics and other data to
determine what the load forecast is three years in the future. They then
add a 15.8% reserve margin to that forecast.
• PJM also breaks up the grid into different zones as the cost for capacity at
different locations varies. Park Ridge is in the PS Zone.
• They then perform an online auction to get prices from generators who
promise to deliver the supply three years into the future, if needed. They
then hold three supplemental auctions as time gets closer to the delivery
year to adjust for changes in the predicted demand.
• After the final auction is completed an annual rate is calculated for each
zone.
• For June 2020 thru May 2021, our rate is $174.32 per MW-day.
• For June 2021 thru May 2022, our rate is $188.02 per MW-day.
19Determination our Capacity Obligation
• Every load serving entity that is connected to the PJM grid must pay a fee
for Capacity. The generators need to get paid for promising to be
available when needed (even if they are not used).
• Park Ridge is a load serving entity (i.e. we are one customer on the grid).
• To determine our capacity cost, a determination of our Capacity
Obligation needs to be determined. That is, we need to pay for our share
of the demand that our utility puts on the PJM grid. Our payment (along
with everyone else’s payment) will then be distributed to the generators
who were awarded contracts in the PJM capacity auctions.
• Our Capacity Obligation is determined by the average of our system’s
load (i.e. meter readings) during the peak one hour timespan on the five
days when the total load in the PJM grid hits it’s peak.
• The obligation that is determined in one year, is then used to calculate
the Capacity costs we will need to pay during the following year.
• A PJM year for Capacity is from June through May.
• For example, our capacity obligation that was derived from the five
summer peak hours in 2020, will impact our capacity costs starting in
June 2021.
20Determination our Capacity Obligation
• Capacity rates are calculated based on the five highest PJM load hours of the year,
known as 5 CPs (Coincident Peaks), and our share of that is based off of our
municipalities meter reads during those five hours.
• Park Ridge’s Capacity Obligation is generally around 20 megawatts (and has been
flat for a number of years)
• In 2020, the dates and hours when PJM hit their peaks were as follows:
• Mon 7/20/2020 4PM to 5PM
• Mon 7/27/2020 4PM to 5PM
• Thurs 7/9/2020 5PM to 6PM
• Mon 7/6/2020 2PM to 3PM
• Wed 7/29/2020 5PM to 6PM
Graph showing
Park Ridge
Hourly Load on PR Load at 4PM
PJM Peak Day to 5PM
7/20/20 17.48 MW
• Based on Park Ridge Meter Readings during those five hours (along with
some PJM scaling factors), our Capacity Obligation for the June 2021 thru
May 2022 period was calculated as 19.72 MW 21Determination our Annual Capacity Costs
• Now that we have the Capacity Rate (which was determined by PJM Capacity
Auctions) - $188.02 per MW-day
• And we have our Capacity Obligation - 19.72 MW
• Our capacity cost is calculated as follows:
$188.02 x 19.72 = $3,708 per day
$3,708 x 365 days = $1,353,420 per year (from June 2021 – May 2022)
• This fee is broken up and charged to us in our PJM weekly bills.
• PJM takes these payments and distributes them to the appropriate generators.
----------------------------------------------------------------------------------------------------------
• The capacity rate for the 2020-2021 term is $174.32 per MW-day
• Based on our five coincident peaks in the summer of 2019, our Capacity Obligation
is expected to be around 18.87MW.
• Our June 2020 – May 2021 capacity costs is calculated as follows:
$174.32 x 18.87 = $3,289 per day
$3,328 x 365 days = $1,200,485 per year (from June 2020 – May 2021)
22Determination of Transmission Rate
• Every user of the transmission system needs to pay for it (throughout
PJM).
• Because Transmission lines cross state lines, the rates are regulated by
the Federal Energy Regulatory Commission (FERC).
• Based on the costs to operate, maintain, and expand the transmission
system, the owners apply to FERC for the rates to be charged to the
users.
• The rates are approved based on the costs to operate the system plus a
return on equity (11.68% for PSE&G).
• Once the rates are approved, PJM distributes the costs to the load serving
entities (like Park Ridge) using a similar method to how Capacity is
determined.
• Park Ridge is located in the PSEG Zone and the transmission system is
owned by PSE&G.
23Determination of Transmission Rate
• For the past 10 years, PSE&G has been
performing significant improvements to their
transmission system.
• PSE&G Web site has a page listing all of the
projects they are working on (see list on right).
• Several years ago, FERC approved a “Formula
Rate” methodology for PSE&G whereby the unit
charges for their transmission service are
determined for each year. Prior to the beginning
of the year, PSE&G calculates the rate for the year
by applying the template or formula to estimated
or projected costs and system loads for the year.
The resulting rates are used for billing during the
subject year.
• We are advised of the new rate for the upcoming
List of PSE&G
year each November. A meeting is held at
transmission
PSE&G’s headquarters when they go through
projects on
their calculations and discuss the new rate. I
their web site
usually attend this meeting.
• For 2021, our rate for transmission service is
$172,190 per MW-Year. 24Determination our Transmission Obligation
• Similar to how our Capacity Obligation is determined, our Transmission
Obligation is determined by the five highest peak but coincident with the
PSEG transmission zone peaks (for Capacity it was based on the five
highest peaks in the entire PJM grid).
• In 2020, the dates and hours when the PSEG Zone hit its peaks were as
follows:
• Wed 7/22/2020 - 4PM to 5PM
• Mon 7/20/2020 - 5PM to 6PM
• Mon 7/27/2020 - 5PM to 6PM
• Tues 7/28/2020 - 3PM to 4PM
• Tues 7/21/2020 - 5PM to 6PM
• Based on Park Ridge’s Meter Readings during those five hours (along with
some zonal scaling factors), our Transmission Obligation for the January
2021 thru December 2021 period was calculated as 17.02 MW.
25Determination our Annual Transmission Costs
• Transmission rates are different from Capacity rates in the fact that the rate term is
from January 1 through December 31
• Now that we have the Transmission Rate (which was approved by FERC through
PSE&G formula rate update) - $172,190 per MW-Year
• And we have our Transmission Obligation - 17.02 MW
• Our gross annual transmission cost is calculated as follows:
$172,190 x 17.02 = $2,930,674 per year (from Jan 2021 – Dec 2021)
• There are come credits received from other regions using the PSEG Zone. The net
impact results in our annual transmission cost of $2,479,119 per year (in 2021).
• This fee is broken up and charged to us in our PJM weekly bills.
• PJM takes these payments and distributes them to the transmission owners.
Transmission
charge in our
weekly PJM
bill
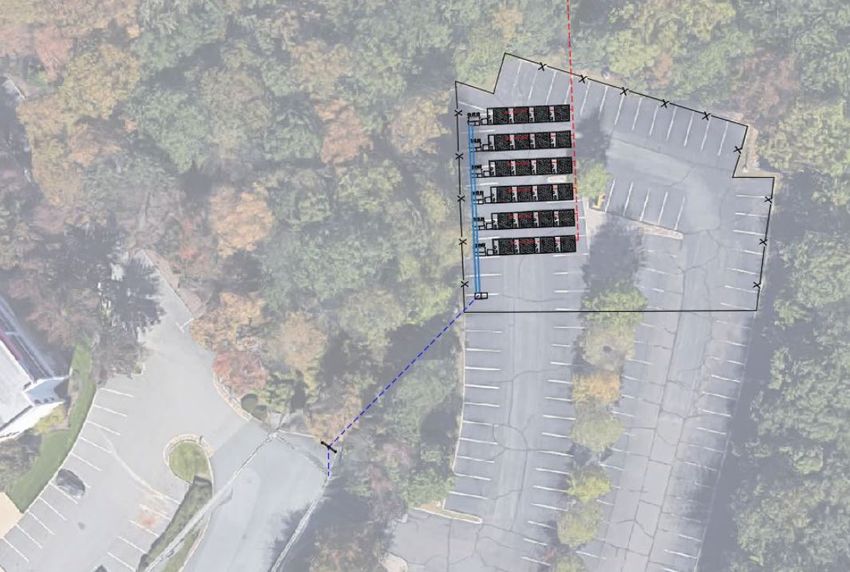
26History of PSEG Rising Transmission Costs & Comparison to Other Zones
• PSEG’s transmission rates have
been significantly increasing for
the past eight years. Their rates
are also significantly higher then
other transmission zones in PJM
PSEG Transmission Rates Since 2012
PSEG
Trans Rate %
Year ($/MW-Year) Increase
2012 35,717
2013 53,953 51%
2014 70,697 31%
2015 96,521 37%
2016 110,916 15%
2017 120,931 9%
2018 130,535 8%
*2019 119,735 -8%
2020 156,503 31%
2021 172,190 10%
* In 2019, rates were reduced by a flow back
of $157 million in accumulated deferred
income taxes (ADIT) due to the Trump tax cuts.
If Park Ridge were located in the JCPL Zone (were Butler & Madison are located),
we would be paying $450,000 for transmission in 2021, as opposed to $2,479,119 .
27Component Cost Breakdown
2021 Wholesale Power Budget
Energy $ 2,163,862 36.0%
Capacity $ 1,213,031 20.2%
Transmission $ 2,479,119 41.2%
Other $ 159,376 2.6%
Total $ 6,015,387
Wholesale Cost Breakdown
Other
3%
Transmission & Energy
36%
Capacity account Transmission
41%
for 61% of our
total annual Capacity
20%
wholesale costs
61% of our annual wholesale power costs are based on our
load during 10 hours of the year (coincident peak hours). 28How can we reduce our Transmission and Capacity costs?
• Because our transmission and capacity cost are based on our five highest
coincident peak hour load, we can reduce our annual costs by reducing
our peaks during these time periods. This would reduce our Capacity and
Transmission obligations.
• We already try to reduce our peaks by shutting down our well pumps on
the days that we may hit the peaks (and use the water in the tanks for
the supply for a few hours).
• A more significant way to reduce our peaks would be to own
generation.
• For each MW of peak load that we could reduce during the five
coincident peaks, we could save the following on the following year’s
wholesale power costs (based on our Capacity rate effective 6/1/21 and
Transmission rate effective 1/1/21):
• Capacity - Savings of $68,627 per MW reduction
• Transmission – Savings of $172,190 per MW reduction
• If we were to install generation in our town, this is referred to “Behind
the Meter Generation”. That is, to PJM, we look like one customer with
all of our incoming power metered at our substation. By installing
generation in our distribution system, it is located behind the meter.
29How can we reduce our Transmission and Capacity costs?
• If we were to own generation, and were able to run it during the five
peak coincident days and hours, our Capacity and Transmission
obligations, and consequently or costs would be reduced.
• This is called behind the meter generation.
Actual PR Load
on peak day in
2020
30How can we reduce our Transmission and Capacity costs?
• For example, if we had a 10MW power plant (or battery storage), and we
were able to run the plant on the peak days, we could potentially save
$686,270 on our capacity costs and $1,721,900 on our transmission costs
(in the following year).
PR Load on
peak day if
10MW
Generator
turned on from
4PM to 7PM
Coincident peak
reduced by
10MW
31How can we reduce our Transmission and Capacity costs?
Options to shed peak load
Power Generating Plant
• Many companies manufacture various size generators that can be
turned on and synched with our power system. When connected
and synched, the amount of power that is generated reduces the
amount of power that we need to pull from “The Grid”.
• Main fuel source options for these generators would be diesel fuel
or natural gas. Natural gas is cleaner (easier for air permitting) and
as long as the natural gas supply is available (which is very reliable),
the generators can run for an indefinite period of time.
• Due to newer technology, the generators can be designed with very
high sound attenuated enclosures so there is minimal sound
originating from the property while they are running.
• Alternatively, generators could be installed in an aesthetic building
that would also be designed to attenuate the sound.
32Examples of Potential Power Generating Plant Configurations
Series of Smaller Generators Interconnected (0.5 MW Each)
Larger Generator
Units (2MW each)
Generators Enclosed
in Building 33How can we reduce our Transmission and Capacity costs?
Options to shed peak load
Battery Storage (or Energy Storage)
• A relatively new technology that has emerged is called energy
storage. A large bank of high efficiency batteries (e.g. Lithium Ion)
are charged during off peak hours and then discharged when
needed to reduce peak demand.
• Just like generators, when units are discharging, the amount of
power that is pushed into the system, reduces the amount of power
that we need to pull from “The Grid”.
• Advantage of using batteries is there are no local emissions. It
should be noted that when the batteries are charging, depending on
the generators that are operating in the grid, some could be fossil
fuel plants.
• A major disadvantage of energy storage is that there is a limited
time span that the batteries can discharge (e.g. 2 hours)
• Another significant disadvantage is that they cannot be used for
backup power for any considerable length of time.
• Batteries degrade over time (i.e. ten year lifespan).
• The Borough of South River recently went out to bid and has
awarded a contract with a firm to install and operate a battery
storage system.
34Examples of Potential Power Generating Plant Configurations
Typical Energy Storage units – One
unit can deliver 2MW for 2 hours.
For 10 MW system, we would need
5 units (each one the size of tractor
trailer box).
35Major Advantage of Power Generator vs. Energy Storage
Preparing for Catastrophic Weather Event
• One major advantage of owning generation as opposed to energy storage is it
provides backup power during power failure emergencies. If sized large
enough, the generators could provide enough power to supply the entire town
during a majority of the year.
• During catastrophic weather events (e.g. hurricane, Nor’easter, etc.), there is a
good chance that our incoming power supply could be out for days.
• The December 24, 2020 Nor’easter took down one of our incoming power feeds.
This also occurred during Tropical Storm Sandy (October 2012).
• In both cases, Park Ridge was extremely fortunate (LUCKY) that only one of our
two incoming power feeds was taken down. Had both of them come down, Park
Ridge would have most likely been out of power for two to three days minimum.
• Both of these events were not hurricanes. For these events we experienced
peak wind gusts in our area of around 50-70 miles per hour.
• If we ever do experience a real hurricane (which is highly likely over the next 10
years), there is a good probability that both of the incoming power lines feeding
Park Ridge will be out.
• If we were to have a 10 MW generating plant in Park Ridge, it could be used to
provide power to the town during a town wide power failure.
36Park Ridge Electrical Load 2020
PR Total Load 10MW Generator Capacity
20
Jan thru May and Oct thru Dec
18
(8 Months of the year) a 10MW
plant could power the entire
16 town 24 hours per day
14
12
10
8
6
4
2
0
01-Jan-20 01-Feb-20 01-Mar-20 01-Apr-20 01-May-20 01-Jun-20 01-Jul-20 01-Aug-20 01-Sep-20 01-Oct-20 01-Nov-20 01-Dec-20
37Park Ridge Load on 7/15/20
PR Total Load 10MW Generator Capacity
14
During high demand periods
(summer), we could power entire
12
town overnight from 11PM to late
morning.
10
8
Load (MW)
6
During afternoon and evenings, we
would need to manage load and
4 have rolling blackouts. This is
much better than having no power
at all.
2
0
1:00 2:00 3:00 4:00 5:00 6:00 7:00 8:00 9:00 10:00 11:00 12:00 1:00 2:00 3:00 4:00 5:00 6:00 7:00 8:00 9:00 10:00 11:00 12:00
AM AM AM AM AM AM AM AM AM AM AM PM PM PM PM PM PM PM PM PM PM PM 38PM AMWhere could we situate a generating plant?
• There are several factors that determine a good location to install a
generating plant.
• The plant should not be located near any residential neighborhoods.
• The plant needs to be able to connect to the distribution system where
the system can handle the total load.
• It should not be installed in area where there is a potential for flooding.
• We have surveyed the town and feel that we have one ideal location.
• This is the back parking area at one of our corporate buildings on Brae
Blvd.
• We have spoken with the owners of the property and they were
receptive to the idea of providing an easement or leasing the property for
a peak shaving plant.
39Where could we situate a generating plant?
Potential
Location of
10MW
Generating Plant
40Where could we situate a generating plant?
Potential
Location of
10MW
Generating Plant
41Where could we situate a generating plant?
Potential
Location of
10MW
Generating Plant
42How could we fund the purchase of a
generating plant (or energy storage system)?
• The cost of a 10MW generating plant is in the neighborhood of 8 to 10
million dollars.
• We could bond for the purchase and pay for it over time (e.g. 30 years).
• If operated correctly, it could save us over $2,000,000 per year, so it
would be a sound financial investment (along with the benefit of having
the backup power during emergencies).
• However, there are some risks associated with owing the plant. For
example, if PJM changes the rules on how Transmission and Capacity
costs are allocated, it could effect the financial payback for the plant.
• Alternatively to owning it, we have been approached by several
companies that are willing to install and operate the plant at no up front
cost to the municipality. This arrangement is available for both the
installation of a generating plant or energy storage.
• There are different scenarios that could be considered to share in the
financial benefit. For example, one financial scenario that has been
presented is where the owner of the plant (i.e. investors) take 80% and
the Borough gets 20% for a certain number of years (e.g. 10 years), and
then from then on the Borough gets 80% and the owner gets %20.
• There are numerous other alternative financial arrangements and this
would be vetted out in a competitive procurement process. 43How would we operate the plant? • To properly operate the plant, we would need to know what days and times that it should be turned on to shave a potential peak. • There are companies that specializing in monitoring the PJM loads, weather conditions, and other factors and they decide when to operate the plant. • Along with shaving the peak, there are other times when there can be a financial benefit of running the plant. This includes times when the local energy spot prices are very high. In addition, there are PJM functions (e.g. spinning reserves and frequency regulation), whereby a small plant like the one proposed can make additional revenue. • The companies that have expressed interest in partnering with Park Ridge to install a plant, all have either their own expertise, or have contracts with companies that perform the operation. • The plants can be remotely dispatched and monitored. • During power failures, we would contact the operating company and have them turn on the plant in what is called island mode. In this mode, our system would be disconnected from the grid and we would be generating all of our power internally. • Once the grid power was restored, we would coordinate shutting down the plant and switching the grid power to supply the load to the Borough. • Included in the operating agreement would be scheduled maintenance of the plant. 44
How would we operate the plant?

Examples of monitoring and forecasting software programs
used by companies who would dispatch the generating plant
at the appropriate times to shave peaks and during other
financial beneficial periods.                               45
Park Ridge Electric Customers’ Impact
• If the we do nothing, we will continue to pay the high price for our
  Capacity and Transmission component costs and it has been predicted
  that both Capacity and Transmissions costs will continue to rise
  significantly for the next few years.
• If we decide to move forward with the installation and operation of a
  peak shaving generating plant using the method where there are no up-
  front costs or risks to the Borough, a conservative potential financial
  benefit has been estimated at $250,000-$300,000 per year for the first
  10 years (while the investors get 80% of the financial benefit).
• After 10 years, the Borough would then save $900,000 - $1,500,000 per
  year (80% of the benefit would go to the Borough).
• These estimates are in today’s dollars and would be scaled up due to
  increased costs and inflation.
• Over a 20 year period, the Borough could conservatively realize a total
  savings of around $12 to $15 Million.
• More importantly, we would have a very large backup generator
  available should a system wide power failure occur.

                                                                            46
Next Steps…
If the Mayor and Council are on-board with pursing the installation of
“Behind the Meter Generation”, our next steps would be as follows:
• Secure the access to the property. Although the owners of the property
being considered were receptive to the idea, we would need to firm up
the arrangement through an access agreement.
• We would need to determine the best method to go out for competitive
proposals. There are several methods that could be considered to
provide competitive proposals and have flexibility for the review and
award of a contract. One New Jersey approved method is called
“Competitive Contracting”.
• Once procurement method was determined, we would develop the
specifications for the request for proposals.
• One option would to include request for both generating plants and for
battery storage. We could then evaluate both types of proposals before
making an award.
• Once an award was made, we would then contract for the project and
proceed with the installation and operation.
47Questions?
48You can also read