Physiological and oxidative defense responses of local rice cultivars "Nusa Tenggara Timur-Indonesia" during vegetative drought stress
←
→
Page content transcription
If your browser does not render page correctly, please read the page content below

AJCS 15(03):394-400 (2021) ISSN:1835-2707
doi: 10.21475/ajcs.21.15.03.p2851

Physiological and oxidative defense responses of local rice cultivars “Nusa
Tenggara Timur-Indonesia” during vegetative drought stress
Yustina Carolina Febrianti Salsinha1, Didik Indradewa2, Yekti A. Purwestri1,3, Diah Rachmawati1,*

1
 Department of Tropical Biology, Faculty of Biology, Universitas Gadjah Mada, Yogyakarta, Indonesia
2
 Department of Agronomy, Faculty of Agriculture, Universitas Gadjah Mada, Yogyakarta, Indonesia
3
 Research Center for Biotechnology, Universitas Gadjah Mada, Yogyakarta, Indonesia

*Corresponding author: drachmawati@ugm.ac.id

Abstract

Drought is the main abiotic factor that reduces productivity of crops such as rice in the suboptimum area. This study aimed to
identify drought-tolerance of local rice cultivars “Nusa Tenggara Timur-Indonesia” through their oxidative defense mechanism. In
this study, 17 local rice cultivars and two control cultivars (Ciherang and Situ Bagendit) were used. Drought was imposed by using
three levels of FTSW: FTSW 1 (control), 0.5 (moderate drought), and 0.2 (severe drought) during the vegetative stage. Growth
parameters such as plant height, number of tillers, number of leaves, and total dry weight were higher in Boawae 100 Malam, Hare
Tora, and Padi Putih Kuatnana than other cultivars. The analysis of relative water content, chlorophyll, carotenoid, and proline
content also indicated that the Boawae 100 Malam, Gogo Sikka, and Hare Tora cultivar showed a higher result compared to control
and other cultivars. These characters tend to correlate with the higher activity of antioxidant enzymes in Boawae 100 Malam and
Gogo Sikka, when exposed to severe drought conditions. Based on principal component analysis of the physiological changes and
enzymatic antioxidant activity, the Gogo Sikka, Boawae 100 Malam, and Hare Tora cultivars were classified as rice cultivars with
higher drought tolerance.

Keywords: antioxidant, drought-tolerant, enzymatic, FTSW, traditional rice.
Abbreviations: APX_Ascorbate Peroxidase, CAT_Catalase, DAP_Day after planting, FTSW_Fraction of Transpirable Soil Water,
NTT_Nusa Tenggara Timur, ROS_Reactive Oxygen Species, SOD_Superoxide Dismutase, TTSW_Total Transpirable Soil Water

Introduction

Plants experience drought or water deficit due to climate 2015; Salsinha et al., 2020). During drought stress, plants
changes and fluctuations of environmental temperatures experience lower root and shoot development as a result of
less or more than optimum. The effects of drought on plants water deficit (Tripathy et al., 2000; Pandey and Shukla,
depend on the water holding capacity of soil particles and 2015).
the rate of plant evapotranspiration (Aroca and Ruiz-Lozano, A common side effect is a reduction in cell division, which
2012). Water stress reduces agricultural production has significant implications on decline in shoots fresh and
throughout the world, and the need to increase the dry weight (Centritto et al., 2009). Drought also reduces
adaptation of crops and the selection of tolerant cultivars is turgor pressure under stressful conditions and triggers a
becoming urgent (Pandey and Shukla, 2015). decrease in the photosynthesis rate by lowering the
Rice (Oryza sativa L.) is a crop that evolves in tropical and concentration of CO2 absorbed by leaf tissue (Pandey and
subtropical regions and is generally sensitive to drought. Shukla, 2015). As a result of this process, the photosynthetic
Cultivation of drought-tolerant rice cultivars needed two pigments continued to be disturbed during the dehydration
factors: 1) accession of drought-tolerant upland rice as a phase (Ashraf, 2011).
parental donor and 2) effective evaluation methods for the The disruption of photosynthesis and metabolism due to
selection process (Xia et al., 2016). According to Pandey and drought causes higher production of reactive oxygen species
Shukla (2015), a comprehensive study of various (ROS) (Mittler, 2002; Ashraf, 2011). When conditioned at a
morphological, physiological, and biochemical characteristics low level, ROS acts as a component of the secondary
can be used to predict patterns of drought tolerance and the messenger in the stress signaling pathway during drought
response mechanism of drought-tolerant plants. stress and initiates the autophagy process. When the
During vegetative drought stress, plants experience several accumulation of ROS reaches its phytotoxicity level, it leads
physiological changes. These include increase in antioxidant to an uncontrolled oxidation process, causing cell membrane
activity, changes in stomatal conductance and root damage (Mittler, 2002).
characteristics, higher level of osmotic adjustment, higher To overcome cell damage due to ROS production, plants
transpiration rate, and changes in biosynthesis and respond by developing oxidative defense systems. This
catabolism of phytohormone like ABA (Pandey and Shukla, defense system includes the activation of superoxide

 394
dismutase (SOD), ascorbate peroxidase (APX), catalase division and inhibits the cell growth (Neumann, 2011). An
(CAT), and glutathione reductase (GR) as an enzymatic increasing level of drought stress has significant effects on
antioxidant defense (Siswanti and Rachmawati, 2011; Refli drought-susceptible plants showed by a higher reduction
et al., 2014; Singh et al., 2015). Several rice cultivars are percentage of each parameter. This reduction percentage
known to have a high tolerance to drought according to the can be obtained by comparing the phenotypic characteristics
antioxidant level of the cell (Pandey and Shukla, 2015; Singh in the control condition to severe drought conditions
et al., 2015). (Farooq et al., 2012).
The East Nusa Tenggara (NTT) region consists of several The reduction analysis of growth (Table 1) shows that
islands, including Timor, Sumba, Flores, Alor, Rote, and drought-tolerant cultivar are Boawae 100 Malam and Padi
another island consists of various geographical conditions Merah Kuatnana with the smallest reduction percentage of
that are dominated by dry climates. The average rainfall in 24.2% and 20.9% for plant height, 7.14% and 41.18% for the
the NTT is about 0–12 mm in May–October and 50–300 mm number of tillers, and 28.2% and 26.7% for the number of
from November to April. The need to improve food leaves, respectively. This reduction percentage was
production in this region has directed agricultural objectives significantly different (p< 0.05) from Ciherang cultivar. While
to the development of tolerant rice cultivars. for the same growth parameters, cultivars with high
NTT has a local upland seed germplasm, which ranges from susceptibility to drought stress with higher reduction
21 upland rice accessions cultivated through traditional percentage are Padi Putih Maumere, and Padi Merah
techniques based on Lalel (2009). NTT has 91 accessions of Noemuti.
food crops including 20 local upland rice accessions spread When plants were exposed to drought, turgor pressure will
across 11 districts in NTT. Each rice cultivar has specifically decrease which inhibits growth (Neumann, 2011). This
adapted to its environment so that the potential for crop condition is compounded by the increase in ROS production
variations with high adaptation to drought is also high in the as a result of the loss of cell turgor pressure and stomatal
regions of NTT dominated with a dry climate (Mau et al., closure during drought stress. As a result, plants will
2019). However, Indonesia has been experiencing the loss of experience a decrease in the rate of carbon assimilation,
thousands of local rice cultivars until 2008. which has an impact on decreasing plant biomass.
In order to obtain drought tolerant local rice cultivars, this
study will examine morphophysiological characters and their Relative Water Content and Leaf Rolling Score
relationship with enzymatic antioxidant defense to identify In drought conditions, plants also experience the increase of
drought-tolerant rice cultivars. cell osmotic potential, causing a rapid loss of physiological
 water from the cell. This leads to the change of relative
Results and Discussion water content (RWC), the parameter was used to evaluate
 the cell osmotic response during drought. In this condition,
Drought stress is a limiting factor affecting the growth rate RWC will drop until it reaches the point of osmotic
and productivity of food crops. The ability of a plant to adapt equilibrium between the internal and external conditions of
to various environmental conditions with different moisture the cell (Farooq et al., 2012).
content is related to plasticity and photosynthetic resilience In this study, the water status indicated by the RWC shows
combined with many processes in controlling plant growth the actual water content ratio relative to the maximum
and development in the environment (Chaves et al., 2011). water binding capacity in turgid conditions (Mullan and
Through the identification of regulatory mechanisms in Pietragalla, 2011). A cultivar with higher RWC can minimize
morphological, physiological, and oxidative defense stress by regulating optimum leaf turgor pressure under
responses, a group of cultivars that are tolerant to drought drought stress conditions (Bacellar et al., 2011; Mullan and
can be obtained. Pietragalla, 2011).
 A high level of drought stress (FTSW 0.2) corresponds to a
Growth phenotype characters small RWC percentage in plant tissue but with high leaf
Drought stress significantly decreased the phenological rolling scores. This condition is associated with a decrease in
character in the plant. The development process from the cell turgor pressure. Based on the data (Table 2), several
vegetative to the reproductive phase has also been reduced cultivars generally show significant differences (p
oxidative stress and also acts as a sub-cellular structure The data (Table 3) shows the SOD of each cultivar was
(membranes and proteins) stabilizers, regulators of significantly different at each level of treatment (P < 0.05).
NADP+/NADPH ratio, and a protein hydrotrope (Hayat et al., During drought conditions, the Padi Merah Noemuti, Gogo
2012). The data (Table 2) show that plants experience Metan, and Mapan cultivars showed high SOD activity during
increase in proline levels as a result of the induced drought drought stress, with values of 45.8, 45.3, and 30 U L -1,
stress in roots. Several cultivars have shown the highest level respectively. SOD acts as a dismutase enzyme that catalyzes
of proline level from control to severe drought conditions singlet oxygen (O2-*) into H2O2. Several cultivars that have
including Shintara, Padi Merah Noemuti, Boawae 100 high SOD activity shows a lower level of cell damage than
Malam, Padi Hitam Maumere, and Gogo Sikka, with other cultivars. SOD activity also increased at the beginning
percentages of 35.96%, 31.35%, 41.31%, 49.18%, and of the stress period and decreased in line with the increase
47.99%, respectively. in the drought stress period (Mittler, 2002).
As a defense mechanism against drought, proline Another enzyme in the enzymatic antioxidant system is
biosynthesis is induced directly during stress. Research catalase (CAT), which is an enzyme that converts peroxide
shows that proline is responsible for scavenging ROS and into O2 and H2O. The difference in activity with APX is that
other free radicals. However, the application of exogenous CAT does not require ascorbic acid as an electron donor
proline at excess levels (40–50 mM) has a low growth effect (Foyer and Noctor, 2003). The enzymatic activity of CAT in
on rice plants with abiotic stress (Hayat et al., 2012). several rice cultivars increased until the third day after
 drought stress and then decreased in line with the increase
Photosynthetic Pigment Characteristics in the stress period. However, CAT activity depends on
The photosynthetic performance of a plant can be observed cultivars, the types of abiotic stress, and the drought stress
from chlorophyll pigment changes. In a severe drought phase (Gechev et al., 2006). Based on the data (Table 3),
condition, an increase in leaf rolling scores leads to a severe drought conditions (FTSW 0.2) increased CAT
decreasing photosynthesis rate, especially in carbon antioxidant enzyme activity in the vegetative phase but with
assimilation reactions. As a result of stomatal closure, no significant differences (p< 0.05) between each cultivar.
decreased CO2 availability leads to a reduction of the These conditions lead to the late process of CAT activity
carboxylation process by Rubisco (Chaves et al., 2011). during early drought treatment.
Based on the data (Table 2), cultivars with a lower reduction In addition to SOD and CAT, another important antioxidant
percentage of chlorophyll content (Hare Tora and Boawae enzyme is ascorbate peroxidase (APX). This enzyme is
100 Malam with 9.37% and 7.56%, respectively) tend to involved in the oxidative chain reaction that converts H2O2
have a high tolerance to drought. Cultivars with the highest into O2 and H2O with ascorbic acid (non-enzymatic
decrease in chlorophyll levels or a high drought sensitivity antioxidant) as one of the electron donors (Refli and
are Pak Mutin, Gogo Jak, and Padi Putih Maumere, with Purwestri, 2016). The data (Table 3) shows that severe
percentages of 34.65%, 34.38%, and 43.28%, respectively. drought conditions lead to an increase in APX antioxidant
An imbalance in PSII photochemical activity and electron enzyme activity in the vegetative phase but with no
transport for photosynthesis also occurs after a long period significant differences (p < 0.05) between each cultivar. This
of drought stress. These cause a limitation on the condition also leads to the late process of APX activity during
assimilation rate, as indicated by a decrease in chlorophyll early drought treatment. A comparison of activities between
levels (Chaves et al., 2011). This situation leads to the each stress level shows an increasing pattern from control
decreased accumulation of the assimilation process, which conditions (FTSW 1) toward severe drought (FTSW 0.2) both
affects the decreasing cell biomass. The data in Table 2 show in CAT and APX activity.
that plants experience a decrease in chlorophyll pigment
contents in line with the reduction in total biomass Principal Component Analysis (PCA)
(significantly different with p
Table 1. Plant growth characteristics (plant height, tiller number, shoot dry weight, and root dry weight) of 17 NTT local rice cultivars as affected by decreasing FTSWs.
 Cultivar Plant Height (cm) Tiller Number Shoot Dry Weight Root Dry Weight
 FTSW 1 0.5 0.2 1 0.5 0.2 1 0.5 0.2 1 0.5 0.2
 PM 110.6 cdef 91.9 fgh 79.7 def 4.6 a 3.6 4.0 ab 18.54 cd 15.53 de 10.61 de 0.77 b 0.59 a 0.42 abcde
 SH 87.5 abc 72.4 bcd 62.9 abcde 12.4 cd 8.4 cde 8.2 25.4 jk 14.54 cd 10.70 de 0.75 b 0.54 a 0.33 ab
 GPM 117.7 ef 96.3 gh 86.3 f 5.4 a 4.4 4.2 ab 19.53 de 12.56 ab 12.05 ef 0.75 b 0.52 a 0.46 abcde
 CM 80.7 ab 65.2 abc 56.5 ab 12.6 d 10 e 9.8 e 21.54 fg 16.55 e 8.99 abc 0.77 b 0.58 a 0.41 abcde
 MPP 75.2 a 67 abc 45.7 a 9.6 bcd 6.0 abcd 6.4 bcd 24.50 ij 13.54 bc 13.00 f 0.73 b 0.63 a 0.47 abcde
 HT 116 def 93.7 gh 82.5 ef 5.0 a 6.2 abcd 4.8 abc 17.59 bc 12.55 ab 10.56 cde 0.74 b 0.61 a 0.55 bcde
 GF 87.5 abc 75.8 cde 64.4 abcde 9.2 bc 6.4 abcd 6.2 bcd 18.54 cd 11.53 a 9.89 bcd 0.77 b 0.56 a 0.43 abcde
 GJ 110.4 cdef 94.3 gh 78.8 def 6.0 a 5.8 ab 4.4 ab 16.56 ab 14.54 cd 11.59 ef 0.74 b 0.61 a 0.48 abcde
 PMN 91.8 abcd 72.1 bcd 59.3 abcde 11.8 cd 9.6 e 7.0 bcd 21.50 fg 15.59 de 7.94 a 0.72 b 0.49 a 0.47 abcd
 GM 108.6 cdef 84.8 efg 76.8 cdef 10 bcd 8.6 de 6.6 bcd 17.53 bc 16.53 e 12.61 f 0.75 b 0.57 a 0.36 abcd
 CK 107 cdef 81.3 def 77.2 def 4.2 a 4.6 ab 4.2 ab 15.56 a 13.57 bc 10.52 cde 0.75 b 0.57 a 0.56 cde
 BSM 107.8 cdef 100.2 h 81.7 ef 5.6 a 5.2 ab 5.2 abc 15.51 a 14.54 cd 8.51 ab 0.72 b 0.61 a 0.58 de
 PMK 99.6 bcde 104.2 h 78.8 def 6.8 ab 5.6 abc 4.0 ab 20.51 ef 16.54 e 12.62 f 0.74 b 0.56 a 0.37 abcde
 PPK 110.4 cdef 96.7 gh 76.1 bcdef 7.2 ab 4.0 a 4.2 ab 21.46 fg 13.54 bc 9.62 bcd 0.65 b 0.54 a 0.49 e
 PHM 125.6 f 99 h 76.1 bcdef 4.4 a 4.0 a 4.0 ab 23.52 hi 14.53 cd 8.62 ab 0.73 b 0.59 a 0.35 abcd
 PPM 101.5 def 99.7 h 75.6 bcdef 5.0 a 4.2 a 2.6 a 18.52 cd 15.55 de 7.51 a 0.74 b 0.58 a 0.50 abcde
 GS 100.4bcde 58.7 a 56.9 abc 9.8 bcd 9.8 e 7.4 cde 26.51 k 16.58 e 8.62 ab 0.73 b 0.51 a 0.32 a
 CH 75.8 a 62.6 ab 51.5 a 10 bcd 8.2 cde 6.4 bcd 20.58 ef 13.55 bc 7.84 a 0.76 0.61 a 0.31 a
 SB 78.4 ab 63.7 abc 56.1 ab 9.4 bcd 7.2 bcde 5.2 abc 22.62 gh 14.57 cd 9.64 bcd 0.88 0.60 a 0.34 abc
 Mean value followed by the same letters in the same column and row of each parameter indicate no significant differences based on the Duncan test at P < 0.05 and two-way ANOVA. Treatment was conducted using FTSW level 1
 (control), 0.5 (moderate drought), and 0.2 (severe drought).

Fig 1. Morphology of 17 NTT local rice cultivars and two control cultivars, including a) PM_Pak Morin,b) SH_Shintara, c) GPM_Gogo Pulut Merah, d) CM_Mapan, e) PM_Pak Mutin, f) HT_Hare Tora, g)
GF_Gogo Fatuhao, h) GJ_Gogo Jak, i) PMN_Padi Merah Noemuti, j) GM_Gogo Metan, k) CK_Kisol Manggarai, l) BSM_Boawae 100 Malam, m) PMK_Padi Merah Kuatnana, n) PPK_Padi Putih Kuatnana, o)
PHM_Padi Hitam Maumere, p) PPM_Padi Putih Maumere, and q) GS_Gogo Sikka with two control cultivars r) CH_Ciherang as drought-sensitive cultivars and s) SB_Situ Bagendit as drought-tolerant
cultivars. Bars: 1.5 cm.
 397
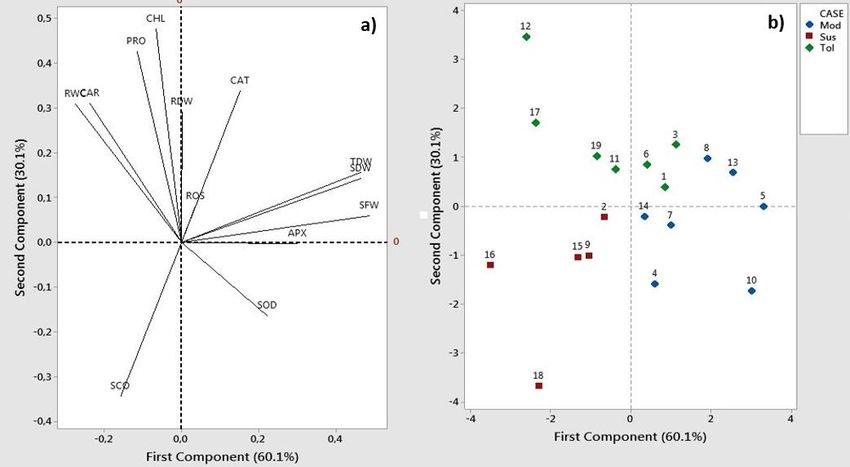
Table 2. Drought tolerance characteristics (proline content, relative water content, and leaf rolling scoreS) and photosynthetic pigments (chlorophyll and carotenoid content) of 17 NTT local rice cultivars and control cultivars as affected by decreasing
FTSWs.
 Proline content (μmol g-1 FW) Relative Water Content (%) Leaf Rollling Scores Chlorophyll Content (mg g-1 FW) Carotenoid Content (mg g-1 FW)
Cultivar
 1 0.5 0.2 1 0.5 0.2 1 0.5 0.2 1 0.5 0.2 1 0.5 0.2
PM 0.36 a 0.38 a 0.47 a 77.52 ab 68.55 abcd 39.39 abc 11.80 cd 27.1 abc 28.35 a 4.27 abc 3.32 a 2.79 a 0.50 abcd 0.38 ab 0.22 ab
SH 0.32 a 0.50 a 0.50 a 79.61 ab 70.82 bcd 28.79 abc 6.15 a 25.9 bc 37.00 cd 3.96 abc 3.53 a 3.41 a 0.51 abcd 0.50 ab 0.63 ab
GPM 0.38 a 0.57 a 0.42 a 78.06 ab 55.06 abcd 43.64 abc 7.40 abcd 23.2 abc 33.90 abcd 5.16 bc 4.25 a 4.46 a 0.42 abcd 0.57 ab 0.40 ab
CM 0.30 a 0.38 a 0.36 a 81.52 ab 67.75 abcd 11.11 abc 6.25 abcd 26.4 abc 30.80 abcd 4.55 abc 3.42 a 3.34 a 0.25 abcd 0.38 ab 0.27 ab
MPP 0.35 a 0.78 a 0.46 a 84.68 ab 72.43 cd 20.37 abc 8.65 abcd 25.6 abc 31.95 abcd 3.43 abc 3.41 a 2.91 a 0.72 cd 0.78 b 0.09 a
HT 0.26 a 0.78 a 0.37 a 65.50 ab 61.34 abcd 38.24 abc 7.05 abcd 20.8 abc 27.35 ab 3.84 abc 3.90 a 3.48 a 0.81d 0.78 b 0.33 ab
GF 0.27 a 0.38 a 0.30 a 87.30 b 69.82 abcd 18.63 abc 6.55 abcd 24.4 abc 30.34 abc 4.91 abc 3.94 a 3.72 a 0.05 a 0.38 ab 0.36 ab
GJ 0.26 a 0.70 a 0.37 a 70.64 ab 59.62 abcd 33.76 abc 11.65 abcd 27.2 abc 32.45 abc 4.99 abc 3.38 a 3.28 a 0.03 a 0.70 b 0.50 ab
PMN 0.32 a 0.49 a 0.47 a 89.44 b 62.41 abcd 19.43 abc 10.00 abcd 33.0 c 33.25 abcd 3.65 abc 4.09 a 3.17 a 0.49 abcd 0.49 ab 0.55 ab
GM 0.25 a 0.43 a 0.30 a 85.53 ab 54.20 abcd 21.10 abc 7.20 abcd 26.7 abc 31.65 abc 3.82 abc 3.35 a 3.22 a 0.58 abcd 0.43 ab 0.29 ab
CK 0.32 a 0.44 a 0.38 a 76.95 ab 57.29 abcd 47.09 abc 7.65 abcd 28.3 abc 32.80 abcd 4.18 abc 4.31 a 3.62 a 0.68 bcd 0.44 ab 0.27 ab
BSM 0.32 a 0.76 a 0.55 a 85.73 ab 73.37 d 58.94 c 6.35 abcd 21.1 abc 25.95 ab 4.65 abc 4.40 a 4.30 a 0.11 abc 0.76 b 0.79 b
PMK 0.27 a 0.34 a 0.40 a 84.52 ab 62.67 abcd 27.03 abc 14.05 bcd 24.5 abc 31.55 abc 4.33 abc 4.07 a 3.33 a 0.01 a 0.34 ab 0.54 ab
PPK 0.32 a 0.55 a 0.31 a 82.46 ab 54.05 abcd 52.63 bc 8.60 abcd 31.1 c 29.65 abc 3.58 ab 3.91 a 2.87 a 0.29 abcd 0.55 ab 0.17 a
PHM 0.21 a 0.45 a 0.41 a 83.86 ab 60.17 abcd 37.37 abc 9.15 abcd 24.0 abc 34.70 abcd 3.62 ab 4.24 a 3.07 a 0.13 abc 0.45 ab 0.48 ab
PPM 0.28 a 0.52 a 0.36 a 86.81 b 68.48 abcd 59.07 c 12.50 cd 23.1 abc 40.70 d 5.44 c 2.74 a 3.09 a 0.09 ab 0.52 ab 0.41 ab
GS 0.27 a 0.73 a 0.52 a 81.19 ab 58.58 abcd 42.93 abc 8.75 abcd 30.5 abc 33.45 abcd 4.97 abc 4.22 a 4.14 a 0.05 a 0.73 b 0.56 ab
CH 0.26 a 0.03 a 0.27 a 70.77 ab 64.35 abcd 28.44 abc 14.25 d 27.2 bc 36.65 bcd 3.51 a 3.06 a 2.35 a 0.55 abcd 0.03 ab 0.28 ab
SB 0.37 a 0.49 a 0.45 a 77.76 ab 52.19 a 30.40 abc 9.10 abcd 27.9 bc 26.30 abcd 4.69 abc 4.33 a 4.29 a 0.59 abcd 0.49 ab 0.62 ab
Mean value followed by the same letters in the same column and row of each parameter shows no significant differences based on the Duncan test at P < 0.05 and two-way ANOVA. Treatment was conducted using FTSW level 1 (control), 0.5 (moderate drought), and 0.2 (severe drought). Inc (%) shows increasing percentage from control condition to severe drought.

 Fig 2. Loading plot and score plots of principal component analysis (1) Pak Morin, (2) Shintara, (3) Gogo Pulut Merah, (4) Mapan, (5) Pak Mutin, (6) Hare Tora, (7) Gogo Fatuhao, (8) Gogo Jak, (9) Padi
 Merah Noemuti, (10) Gogo Metan, (11) Kisol Manggarai, (12) Boawae 100 Malam, (13) Padi Merah Kuatnana, (14) Padi Putih Kuatnana, (15) Padi Hitam Maumere, (16) Padi Putih Maumere, and (17)
 Gogo Sikka with two control cultivars (18) Ciherang (drought-sensitive cultivar) and (19) Situ Bagendit (drought-tolerant cultivar). APX: ascorbate peroxidase, CAR: carotenoid content, CAT: catalase,
 CHL: chlorophyll content, PRO: proline content, RDW: root dry weight, ROS: H 2O2 content, RWC: relative water content, SCO: leaf rolling score, SDW: shoot dry weight, SFW: shoot fresh weight, SOD:
 superoxide dismutase, TDW: total dry-weight.

 398
Table 3. Enzymatic antioxidant activity characteristics (SOD, CAT, APX) of 17 NTT local rice cultivars as affected by decreasing FTSWs.
 SOD (U L-1) CAT (mmol H2O2 min-1 g-1 FW) APX (U L-1) Inc
Cultivar Inc (%) Inc (%)
 1 0.5 0.2 1 0.5 0.2 1 0.5 0.2 (%)
PM 17.3 c 18.2 cd 22.4 ab 22.9 0.09 a 0.29 ab 0.47 a 79.6 0.21 ab 0.23 ab 0.33 abc 36.8
SH 4.9 abc 4.6 ab 8.5 ab 42.9 0.12 a 0.21 ab 0.21 a 45.2 0.19 ab 0.23 ab 0.29 abc 35.3
GPM 15.0 bc 17.7 cd 22.2 ab 32.4 0.14 a 0.11 a 0.30 a 55.0 0.21 ab 0.26 ab 0.33 abc 36.8
CM 9.4 abc 21.5 d 30.0bc 68.7 0.12 a 0.26 ab 0.28 a 58.9 0.18 ab 0.29 ab 0.43 bc 58.7
MPP 1.2 a 13.0 abcd 22.9 ab 94.7 0.14 a 0.26 ab 0.39 a 65.4 0.31 b 0.35 b 0.35 abc 10.0
HT 12.0 abc 15.7 bcd 17.7 ab 32.1 0.13 a 0.35 ab 0.39 a 67.9 0.07 a 0.08 a 0.24 abc 71.4
GF 12.9 abc 17.3 cd 19.5 ab 34.1 0.09 a 0.17 ab 0.41 a 77.8 0.19 ab 0.28 ab 0.42 bc 54.2
GJ 10.1 abc 13.3 abcd 21.2 ab 52.6 0.14 a 0.35 ab 0.57 a 76.3 0.10 a 0.29 ab 0.45 c 78.2
PMN 2.7 ab 36.8 e 45.8 c 94.1 0.17 a 0.22 ab 0.27 a 38.9 0.17 ab 0.21 ab 0.36 abc 52.4
GM 7.2 abc 16.8 cd 45.3 c 84.1 0.11 a 0.15 ab 0.27 a 61.1 0.05 a 0.14 ab 0.31 abc 83.3
CK 5.9 abc 9.7 abcd 10.8 ab 45.3 0.15 a 0.35 ab 0.39 a 61.5 0.07 a 0.24 ab 0.23 ab 69.2
BSM 6.4 abc 10.7 ab 20.3 ab 68.5 0.11 a 0.24 ab 0.39 a 73.1 0.16 ab 0.12 ab 0.28 abc 43.7
PMK 17.0 c 18.8cd 28.7bc 40.7 0.08 a 0.15 ab 0.53 a 85.8 0.19 ab 0.24 ab 0.36 abc 47.6
PPK 6.3 abc 13.5 abcd 22.1 ab 71.3 0.13 a 0.42 b 0.49 a 73.7 0.11 a 0.28 ab 0.42 bc 73.6
PHM 11.2 abc 12.2 abcd 28.6bc 61.0 0.07 a 0.08 a 0.38 a 80.0 0.20 ab 0.31 ab 0.33 abc 40.4
PPM 7.6 abc 9.1 abc 12.9 ab 41.2 0.11 a 0.18 ab 0.27 a 61.1 0.15 ab 0.14 ab 0.24 abc 38.1
GS 0.2 a 2.3 a 5.9 a 95.8 0.03 a 0.2 ab 0.53 a 93.3 0.02 a 0.16 ab 0.23 ab 92.3
CH 7.0 abc 10.8 abcd 13.6 ab 48.3 0.12 a 0.26 ab 0.23 a 46.7 0.1 a 0.19 ab 0.17 a 40.0
SB 2.1 ab 11.3 abcd 26.0 abc 91.9 0.15 a 0.26 ab 0.29 a 45.6 0.05 a 0.16 ab 0.23 ab 76.9
Mean value followed by the same letters in the same column and row of each parameter shows no significant differences based on the Duncan test at P< 0.05 and two-way ANOVA. Treatment was conducted using FTSW level 1 (control), 0.5
(moderate drought), and 0.2 (severe drought). Inc (%) shows increasing percentage from control condition to severe drought.
 was grown under 100% field capacity (gravimetry method).
 performance, as indicated by the reduction of plant height, The calculation of total transpirable soil water (TTSW) was
 the number of tillers, chlorophyll content, shoot dry weight, performed after it reached the permanent wilting point
 and root dry weight. These were inverse to the increase of (indicated by stable pot and crop weight). The TTSW of each
 enzymatic antioxidant activity and leaf rolling score as a cultivar calculated using P0 (initial pot and plant weight at
 response of each cultivar to severe drought conditions as 100% field capacity) and Pi (pot and plant weight at the
 reported by Salsinha et al. (2020). In several cultivars, permanent wilting point) with the formula:
 although the physiological performance is decreased, the = 0 −
 resulting reduction is smaller than that in plants that express To maintain the stability of each level of FTSW treatment,
 relatively low enzymatic antioxidants. the value of Pt (pot and plant weight at any given time) and
 Wt (water amount that should be kept permanent for each
 Materials and Methods FTSW level) calculated using the formula:
 = (1; 0.5 2) ×
 Plant materials = 0 − ( − )
 The 19 rice (Oryza sativa) cultivars used in this study Each germinated seedling (21 days after imbibition)
 consisted of 17 local rice cultivars from NTT including transferred into 1 kg of the individual plastic pot (with a
 PM_Pak Morin, SH_Shintara, GPM_Gogo Pulut Merah, diameter of 15cm) contained soil and compost (with the
 CM_Mapan, PM_Pak Mutin, HT_Hare Tora, GF_Gogo ratio of 3:1). The research design was carried out accordingly
 Fatuhao, GJ_Gogo Jak, PMN_Padi Merah Noemuti, to randomized complete block design with a total number of
 GM_Gogo Metan, CK_Kisol Manggarai, BSM_Boawae 100 the samples were 228 samples consisted of three levels of
 Malam, PMK_Padi Merah Kuatnana, PPK_Padi Putih drought treatments, 19 cultivars, and four replications). All
 Kuatnana, PHM_Padi Hitam Maumere, PPM_Padi Putih the cultivars should maintain each level of treatment after
 Maumere, and GS_Gogo Sikka with two control cultivars: seven days of acclimatization. The growth parameters were
 CH_Ciherang as drought susceptible cultivar and SB_Situ measured at 49 days after planting (DAP), while the
 Bagendit as a drought-tolerant cultivar. physiological parameters were observed between 42–49
 DAP.
 Research location
 Observation and variables evaluated
 This research was conducted at the Sawitsari Research
 Growth parameters, including plant height, root length,
 Station, Faculty of Biology, Universitas Gadjah Mada
 number of leaves, and tillers, were recorded at the end of
 (7°45'22"S,110°23'18"E with an altitude of 114 m above sea
 observation (49) DAP). Fresh weight and dry weight were
 level) during 2018 to 2019. The area has an average annual
 weighed with digital scales (ACIS, BC-500). All plant parts
 rainfall of 243 to 348 mm with a temperature range
 were dried in an oven at 75 °C for four days to obtain the dry
 between 25 and 34 °C. The sun exposure ranged from ~4500
 weight. For pigments measurement, leaf samples were
 lux (in the morning) to ~53000 lux (during daylight) with
 crushed and extracted in 80% cold acetone. Chlorophyll
 humidity, air pressure, and velocity of 87%–88%, 995
 (Chla, Chlb, total Chl) and carotenoids content were
 millibars, and 0.8–1 m/s, respectively.
 measured by using the Harborne method (1984) with a
 Experimental design and cultivation treatments spectrophotometer (GENESYS 10 UV Scanning, Thermo
 Drought treatments performed using the FTSW (Fraction of Fisher Scientific) and expressed as mg g-1 fresh weight (FW).
 transpirable soil water) method (Serraj et al., 2008) with Proline content was determined spectrophotometrically
 three levels of treatments consisted of FTSW 1 (control), based on Bates et al. (1973) method using the calibration of
 FTSW 0.5 (moderate drought stress), FTSW 0.2 (severe a proline standard curve. For antioxidant enzyme analysis,
 drought stress). Before the treatment of FTSW, each cultivar samples from each plant were taken and homogenized in 50
 mM potassium phosphate buffer (pH 7) containing one mM
 and 1% (b/v) EDTA. Supernatants were used as enzyme
 samples (Sunkar, 2010; Elavarthi and Martin, 2010). The

 399
superoxide dismutase (SOD) activity was measured using the Bates LS, Waldran RP, Teare ID (1973) Rapid determination of free
method by Marklund and Marklund (1970). The absorbance proline for water-stress studies. Plant soil. 39: 205.
 Chaves MM, Costa JM, Saibo, NJM (2011) Recent advance in
of the enzyme solution was measured with a photosynthesis under drought and salinity. Adv Bot Res. 57: 49-104.
spectrophotometer at λ325 nm. The enzyme activity was Centritto M, Lauteru M, Monteverdi MC, Serraj R (2009) Leaf gas
expressed by 50% inhibition of pyrogallol autoxidation exchange, carbon isotope discrimination, and grain yield in contrasting
activity within 3 mins. For catalase (CAT) activity, the rice genotypes subjected to water deficits during the reproductive
absorbance of the sample was measured at λ240 nm for 2 stage. J Exp Bot. 60(8): 2235-2339.
 Elavarthi S, Martin B (2010) Spectrophotometric assays for antioxidant
minutes. This method was performed following Elavarthi and enzymes in plants. Plant stress tolerance. Methods Mol Biol. 639: 273-
Martin (2010). The enzymatic activity of ascorbate 280.
peroxidase (APX) was measured at λ290 nm. The rate of Farooq M, Hussain M, Wahid A, Siddique KHM (2012) Drought stress in
ascorbic oxidation reactions was calculated according to plants: an overview. In: Aroca R (ed) Plant response to drought stress.
Elavarthi and Martin (2010). Relative water content (RWC) Springer. Berlin.1-33.
 Foyer CH, Noctor G (2003) Redox sensing and signaling associated with
analysis was carried out following Mullan and Pietragalla reactive oxygen in chloroplast, peroxisomes and mitochondria. Physiol
(2011) with several modifications. The leaf samples were Plantarum. 119: 355-364.
weighed as initial fresh weight (FW) and ddH2O was added Gechev TS, Van Breusegem F, Stone JM, Denev I, Laloi C (2006) Reactive
before incubation. The leaf pieces were weighed again to oxygen species as signals that modulate plant stress responses and
determine the turgid weight (TW) and dried at 75 °C for 48 programmed cell death. Bioessays. 28:1091–1101
 Harborne JB (1984) Phytochemical Methods: a guide to modern
hours and reweighed to obtain the leaf sample dry weight technique of plant analysis. (2nd ed). Chapman and Hall. London. 37–
(DW). 168.
 − Hayat, Hayat SQ, Almeny MN, Wani AS, Pitchel J, Ahmad A (2012) Role of
 R (%) = × 100%
 − proline under changing environments a review. Plant Signal Behav.
Data analysis 7:1-11.
The significance of the data and the effect of FTSW Lalel HJD, Abidin Z, Jutomo L (2009) The physico-chemical properties of
 local upland brown rice in Ende. J Tek Ind Pangan., 20:109-116 (In
treatment on plant height, number of tillers, plant biomass
 Indonesia).
parameters of biochemical activity, and other enzymes (SOD, Marklund S, Marklund G (1974) Involvement of the superoxide anion
APX, CAT) tested using two-way ANOVA. The analysis radical in the autoxidation of pyrogallol and a convenient assay for
continued with the Duncan test conducted at a 95% superoxide dismutase. Eur J Biochem. 47: 469-474.
confidence level. All data were analyzed statistically by using Mau, YS, Ndiwa ASS, Oematan SS, Markus JER (2019) Drought tolerance
 indices for selection of drought tolerant, high yielding upland rice
IBM SPSS Ver. 20.0 (US). The accumulated data of plant
 genotypes. Aust J Crop Sci. 13 (01): 170-178.
height, number of tillers, plant biomass parameters of McMaster GS, Wilhelm WW (2003) Phenological response of wheat and
biochemical activity, and other enzymes (SOD, APX, CAT) barley to water and temperature: improving simulation models. J Agr
then subjected to principal component analysis (Mau et al., Sci. 141: 129-147.
2019) using XLSTAT 2020 and MINITAB 19.0. Mittler R (2002) Oxidative stress, antioxidants and stress
 tolerance. Trends Plant Sci. 7(9): 405–410.
 Mullan D, Pietragalla J (2012) Leaf relative water content. In: Pietragalla
Conclusion J, Mullan D, Reynolds M (ed) Physiological breeding II: A field guide to
 wheat phenotyping. CIMMYT, Mexico. 25–27.
Under stress conditions, the mechanism of oxidative defense Neumann PM (2011) Recent advances in understanding the regulation of
was increased to ensure the tolerance of plants due to the whole-plant growth inhibition by salinity, drought and colloid stress.
increase in ROS production. The drought tolerance of rice Adv Bot Res.57: 33-48.
 Pandey V, Shukla A. 2015. Acclimation and tolerance strategies of rice
cultivars was observed in various parameters such as the
 under drought stress. Rice Sci. 22(4): 147-161.
higher content of Prolin and enzymatic antioxidant activities. Refli, Muljopawiro S, Dewi K, Rachmawati D (2014) Expression Analysis
In this study, cultivars with high tolerance to drought stress of antioxidant genes in response to drought stress in the flag leaf of
are Boawae 100 malam, Gogo Sikka, Kisol Manggarai, Hare two Indonesian rice cultivars. Indonesian J Biotech. 19: 43-55.
Tora, Gogo Pulut Merah, and Pak Morin, while Shintara, Padi Refli, Purwestri YA (2016) The response of antioxidant genes in rice
Merah Noemuti, Padi Hitam Maumere, and Padi Putih (Oryza sativa) seedling cv. Cempo Ireng under drought and salinity
 stresses. AIP Conf Proc 1744, 020047-1-020047-8.
Maumere considered as drought susceptible cultivars. Salsinha YCF, Indradewa D, Purwestri YA, Rachmawati D (2020) Selection
 of drought-tolerant local rice cultivars from East Nusa Tenggara,
Acknowledgment Indonesia during begetative stage. Biodiversitas. 21(1): 170-178.
 Serraj R, Liu D, He H, Sellamuthu R, Impa S, Cairns J, Dimayuga G and
The authors are grateful for the financial support provided Torres R (2008). Novel approaches for integration of physiology,
by the Directorate of Research and Community Service; the genomics and breeding for drought resistance improvement in rice.
 Drydown FTSW Protocol, IRRI. Manila.
Directorate General of Research and Development Singh M, Kumar J, Singh S, Singh VP, Prasad SM (2015) Roles of
Strengthening; the Ministry of Research, Technology, and osmoprotectants in improving salinity and drought tolerance in plants:
Higher Education; and the Directorate of Research at a review. Rev Environ Sci Biotechnol. 14:407-426.
Universitas Gadjah Mada under a PMDSU research grant Siswanti DU, Rachmawati D (2011) Plant response and nitrate reductase
(2019–2020). The authors are also grateful to the Faculty of activity in vivo on rice (Oryza sativa L.) cultivars IR64 to biofertilizer
 application and drought. AIP Proceed. 1-5.
Biology UGM as a provider of research facilities. Sunkar R (2010) Plant stress tolerance- methods and protocols. Springer
 Protocols. Humana Press. London. 273-280.
References Tripathy JN, Zhang JX, Robin S, Nguyen TT, Nguyen HT (2000) QTLs for
 cell-membrane stability mapped in rice (Oryza sativa L.) under drought
Aroca R, Ruiz-Lozano JM (2012) Regulation of root water uptake under stress. Theor Appl Genet. 100(8): 1197-1202.
 drought stress conditions. In: Aroca R (ed) Plant response to drought Xia H, Huang WX, Xiong J, Tao T, Zheng XG, Wei HB, Yue YX, Chen L, Luo
 stress. Springer, Berlin. 113. LJ (2006) Adaptif epigenetic differentiation between upland and
Ashraf M, Akram NA, Al-Qurainy F, Foolad MR (2011) Drought tolerance: lowland rice ecotype revealed by methylation-sensitive amplified
 roles of organic osmolytes, growth regulators and mineral nutrients. polymorphism, PloS One 11,
 Adv Agron. 111: 249-296 https://doi.org/10.1371/journal.pone.0157810.

 400
You can also read