Role of Salvinia molesta in biodecolorization of methyl orange dye from water - Nature
←
→
Page content transcription
If your browser does not render page correctly, please read the page content below
www.nature.com/scientificreports
OPEN Role of Salvinia molesta
in biodecolorization of methyl
orange dye from water
Israa Abdulwahab Al‑Baldawi1,2, Siti Rozaimah Sheikh Abdullah1, Asia Fadhile Almansoory1,3,
Nur ’Izzati Ismail1*, Hassimi Abu Hasan1 & Nurina Anuar1
In the present study, the potential of Salvinia molesta for biodecolorization of methyl orange (MO)
dye from water was examined. Six glass vessels were filled with 4 L of water contaminated with MO
with three concentrations (5, 15, and 25 mg/L), three with plants and another three without plant as
contaminant control. The influence of operational parameters, including initial dye concentration,
pH, temperature, and plant growth, on the efficacy of the biodecolorization process by S. molesta
was determined. Temperature and pH was in the range of 25–26 °C and 6.3 to 7.3, respectively.
Phytotransformation was monitored after 10 days through Fourier transform infrared (FTIR)
spectroscopy, and a significant variation in the peak positions was demonstrated when compared to
the control plant spectrum, indicating the adsorption of MO. The highest biodecolorization was 42%
in a 5 mg/L MO dye concentration at pH 7.3 and at 27 °C. According to the FTIR results, a potential
method for the biodecolourization of MO dye by S. molesta was proven. Salvinia molesta can be
successfully used for upcoming eco-friendly phytoremediation purposes for dye removal.
The quick growth of the textile industry has led to the accumulation of several organic pollutants in surface
bodies of water, which has indirect or direct contrary effects on the environment1,2. Increasing industrialization
and urbanization has been resulting in the discharge of waste into the environment, which in turn is creating
more pollution. The release of contaminated effluents from many textile industries undesirably disturbs water
resources, soil potency, aquatic life, and ecosystems. The release of these dye-containing wastes to the ecosystem
will cause a decrease in dissolved oxygen concentration, blocked sunlight penetration, and reduced photosynthe-
sis, resulting in toxic environmental conditions3. Conventional technologies for the treatment of dye discharges
through physicochemical methods alone generally cannot comply with stringent environmental regulations. In
addition, there are other drawbacks of these physicochemical treatments, including high energy consumption,
the requirement of chemical addition, and the generation of hazardous sludge as a by-product4,5. Biomass is a
persistent and renewable source on earth. Thus, researchers are attempting to use it in the field of green bio-
technology. Biomass, such as charcoal and activated carbon, is a popular adsorbent for water p urification6,7. In
comparison, phytoremediation is a promising approach to protect the aquatic environment, based on a plant’s
ability to degrade, absorb, transform, and remove organic pollutants in water8,9. This technology has been widely
used to degrade or remove different types of pollutants, including heavy metals10–13, hydrocarbons14–17 and
nutrients18–21. Phytoremediation of textile dyes has been an alternative treatment due to its inexpensive and
eco-friendly approach and the lower amount of sludge p roduced22,23. Few studies report the removal of textile
dyes using floating plants.
Phytoremediation is selected based on numerous benefits, such as cost-effectiveness and its aesthetic view24.
In addition, it does not generate hazardous materials and it can achieve sustainable development g oals25. The
potential of different plants to degrade dyes has been proven. Kagalkar et al.26 concluded that Blumea malcommi
was able to degrade Direct Red 5B dye, and Abdulqader et al.27 used the tropical emergent plant Scirpus gros-
sus, with 64% decolourization of 200 mg/L MO in synthetic wastewater. Also, Davies et al.28 demonstrated the
degradation of textile factory discharge containing Azo Acid Orange 7 dye using a vertical flow constructed
wetland planted with Phragmites australis. Another study by our team23 showed the successful transformation
1
Department of Chemical and Process Engineering, Faculty of Engineering and Built Environment, Universiti
Kebangsaan Malaysia, 43600 UKM Bangi, Selangor, Malaysia. 2Department of Biochemical Engineering,
Al‑Khwarizmi College of Engineering, University of Baghdad, Baghdad, Iraq. 3Department of Ecology, Science
Collage, Basrah University, Basrah, Iraq. *email: nurezatyismail@ukm.edu.my
Scientific Reports | (2020) 10:13980 | https://doi.org/10.1038/s41598-020-70740-5 1
Vol.:(0123456789)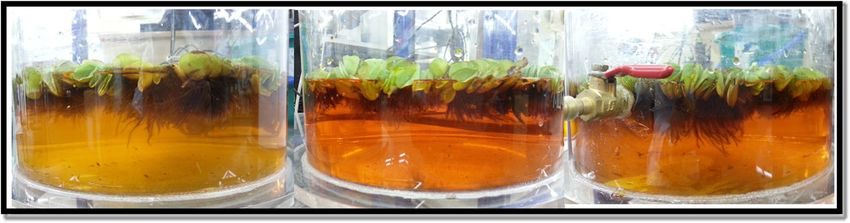
www.nature.com/scientificreports/
Figure 1. Glass vessel setup for decolorization of methyl orange (MO) (Glass vessel 1 = 5 mg/L MO + S. molesta;
Glass vessel 2 = 15 mg/L MO + S. molesta; Glass vessel 3 = 25 mg/L MO + S. molesta; Glass vessel 4 = control glass
vessel for 5 mg/L MO; Glass vessel 5 = control glass vessel for 15 mg/L MO; Glass vessel 6 = control glass vessel
for 25 mg/L MO).
of methylene blue using Azolla pinnata, with 85% removal. Phytoremediation was employed to removal toxic
dyes and to perform decolorization with biological degradation p rocesses29.
In the present study, the floating plant Salvinia molesta was selected to explore the ability of the plant to decol-
ourize methyl orange (MO) dye. Salvinia molesta is usually found in static or quiet waters such as lakes, rivers,
wetlands, and canals30. The habitat of Salvinia molesta is in tropical, sub-tropical or warm temperate areas of
the world such as Malaysia. The plant structure of S. molesta is a free-floating fern with rootless stems and hairy
roots. It can grow up to 20 cm long and the fern colour is light green to medium green colour, with brownish
edges when mature31. Much research deals with floating plants, which are highly tolerable to many environmental
contaminants, such as heavy metals and h ydrocarbons32,33, but few studies have shown that the plants have the
yes2,34. In the present study, the aim of this research was to explore the ability of
ability to biodecolorize textile d
Salvinia molesta to decolourize MO dye in synthetic wastewater.
Materials and methods
Lab‑scale arrangement for decolorization of methyl orange dye. Decolorization experiments
were carried out in glass vessels using the floating plant S. molesta. MO dye purchased from R&M Chemicals
Marketing of Chemical Reagent Company (U.K.) was utilised as a classic dye in this study. Six glass vessels, with
diameters of 25 cm and heights of 30 cm, were used, and each was filled with 4 L of synthetic water contaminated
with MO dye with three different concentrations (5, 15, and 25 mg/L). Approximately 150 g of fresh floating
plant of S. molesta were placed in three glass vessels, as shown in Fig. 1, and the other three glass vessels represent
contaminant control. The dye strength in water samples and standards were determined through adsorption
values with an Ultraviolet/Visible (UV/Vis) spectrophotometer (Lambda 35 UV/V) at 465 nm with distilled
water used as the blank.
After measurement of the dye concentration, the samples were returned back to the glass vessel immediately.
The parameter percent decolorization is defined in Eq. (1) as the following:
MO0 − MOd
Decolourization (%) = (1)
MO0
with, MO0 is the absorbance value of the samples at day 0 and M
Od is the absorbance value of the samples on
the sampling day.
Physical parameters of aquatic media. The physical parameters of the wastewater, including tempera-
ture (°C), pH, dissolved oxygen (DO, mg/L), and oxidation reduction potential (ORP, mV), were recorded to
evaluate conditions for dye removal. The physical parameters were monitored on day 0, 1, 2, 3, 5, 8, and 10 using
a multi-probe IQ 150 (I.Q Scientific Instruments, U.K.) to measure the pH, ORP, and temperature measure-
ments. To record the DO, a dissolved oxygen sensor (GLI International, Model 63, U.S.A.) was used.
Growth observation of Salvinia molesta. Plant growth observations were obtained over a 10-day
period on days 0, 5, and 10. Two plants were taken from each glass vessel on the sampling day to record plant
wet and dry biomass. It offers a clear advantage in understanding the ability of the floating plant to survive and
tolerate MO dye in phytoremediation mechanisms. The relative growth rate (RGR) was determined based on the
increase in dry biomass weight (BW) after 10 days of investigation, using Eq. (2)35 as follows:
ln Wf − ln Wi
(2)
−1
RGR day =
Day
with, Wi is the initial weight (g) and Wf is the final weight (g) after exposure to the dye contaminant.
Scientific Reports | (2020) 10:13980 | https://doi.org/10.1038/s41598-020-70740-5 2
Vol:.(1234567890)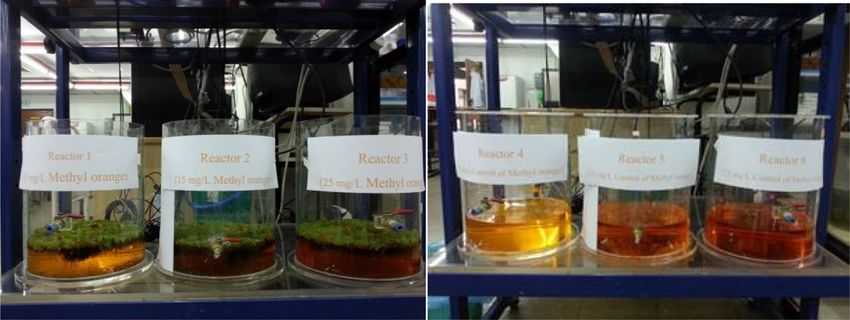
www.nature.com/scientificreports/
Parameter With plants Without plants
T (°C) (25–26) ± 0.5 (26–27) ± 0.5
pH (6.3–7.3) ± 0.5 (6.3–7.3) ± 0.5
DO (mg/L) (4–5) ± 1 (3–4) ± 1
ORP (mV) (7 to − 50) ± 10 (50 to − 50) ± 10
Table 1. Physical condition of glass vessels. Mean SD (n = 3).
Analysis of phytotransformation by Salvinia molesta. Phytotransformation was measured using
Fourier transform infrared (FTIR) spectroscopy techniques (NICOLET 6,700 Spectrophotometer, USA) in the
mid-IR region of 400–4,000 cm−1 with 16 scan speed. At the end of exposure, the whole plant of S. molesta was
first dried in an oven at 120 °C for 1–3 days until constant mass achieved and blended. One g of dried sample
of S. molesta was sent to FTIR analysis. The specimens were blended with spectroscopically pure KBr in the
proportion of 5:95. The pellets were located in specimen holder and then a nalysed36. The FTIR spectra between
the MO powder, dried plant control, and dried plant after 10 days of dye exposure experiments were compared
to confirm the biodegradation of the dye into various metabolites.
Analysis of variance. Statistical analyses were conducted using Statistical Product and Service Solutions
(SPSS) 16.0 for Windows. Two-way analysis of variance (ANOVA) was selected to determine the role of the plant
in removal of MO from water. In addition, tests of between-subjects effect were analysed for MO removal and
plant growth with treatment (with and without plant), time, and MO concentrations. Duncan’s multiple range
tests were applied to assess statistical differences in the relative growth rate factor at the probability level of 0.05,
unless otherwise stated. The samplings were triplicated, and the results are presented as means ± standard devia-
tion.
Results and discussion
Physical states of treatment. The variations in temperature, pH, ORP, and DO during the exposure
times were recorded to show the conditions of the selected floating plant of S. molesta to remove MO dye from
water. For the three MO concentrations of 5, 15, and 25 mg/L, temperature and pH were almost equal in both
treatments (with plants and without plants are shown in Table 1). The experiments were carried out under lab
condition with a temperature range of 25–27 ± 0.5 °C. The solution pH in the glass vessel with plants and with-
out plant were in the range of pH 6.3–7.3, demonstrating the suitable pH needed for growth and activity of S.
molesta, especially for dye removal. According to a study conducted by Yaseen and S cholz37, pH has no obvious
influence in phytoremediation with S. molesta. However, Khataee et al.2 determined that a pH value of 6.5 was
the optimal decolourization pH. In this experimental the pH and temperature reported values were in natural
environment which is satisfactory for the MO decolorization process.
For DO measurement, it can be observed that the effect of S. molesta on the physical conditions varied
between 4 and 5 mg/L for the three MO concentrations (5, 15, and 25 mg/L). The initial ORP of the glass vessels
with plants was 7 ± 10 mV, which then decreased to (− 50) ± 10 mV, showing a significant influence of the plant,
which plays an important role in the performance of decolourization, with a decrease in dissolved oxygen and
lower ORP values due to the activity of the bacteria. In contrast, for the glass vessel without plant the DO and
ORP were even lower, ranging between (3–4) ± 0.5 mg/L and (50 to − 50) ± 10 mV due to the MO dye and the
absence of the plant.
Plant growth. Plant growth was observed for 10 days of MO exposure. As illustrated in Fig. 2, the wet and
dry weight of S. molesta can grow well in all concentrations, while better growth was physically observed (Fig. 3)
for lower MO concentrations (5 mg/L). As shown by the results, all of the plants had increases in wet weight after
exposure to the MO dye contaminants. The wet weight increased from 8 ± 0.5 g to 14 ± 2 g in different MO dye
concentrations of aqueous solution. At the end of 10-day exposure, the leaves of S. molesta remained green which
contributed to the removal performance during the operation period, confirming the capability of S. molesta to
treat dye-contaminated water. According to the two-way ANOVA, there was a significant difference (p < 0.05) in
wet weight with different MO concentrations, as depicted in Fig. 2. However, no statistically significant differ-
ence was found for dry weight at different MO concentrations (p > 0.05) (Fig. 2). The F-value for Levene’s test is
0.011 with p = 0.989, leading to retain the null hypothesis (no difference) for the assumption of homogeneity of
variance. According to Dhir, Sharmila and S aradhi38, the roots of Salvinia species were able to store high amount
of heavy metals than its leaves.
The relative growth rate, which is dependent on wet weight, was affected by three concentration values
of MO dye (5, 15, and 25 mg/L) compared to the corresponding plant control. As shown in Fig. 4, when the
concentration of MO dye increased, there was a clear decrease in RGR after a 10-day period due to the effect of
the plant when exposed to the dye. Statistical analysis results showed that the RGR had significant difference
(p < 0.05) within the MO concentrations, confirming that all MO concentrations can grow and be regenerated
although RGR decreases. Based on the dye concentration as tabulated in Table 2, the ratio of dye content to the
fresh biomass of plants can be calculated as mg dye per fresh wet weight of plants to determine the amount of
biomass required to remove certain amount of dye in water. According to Al-Badawi et al.39 findings, the ratio
of plant numbers to the total mass of contaminant should be calculated to determine the phytotoxicity effects of
Scientific Reports | (2020) 10:13980 | https://doi.org/10.1038/s41598-020-70740-5 3
Vol.:(0123456789)www.nature.com/scientificreports/
25 Day 0 Day 5 Day 10
A
20 AB
B
Weight (g)
15 A
AB
A B
10 A A
a a a
5 a a
a
a a a
0
5 mg/L MO 15 mg/L MO 25 mg/L MO 5 mg/L MO 15 mg/L MO 25 mg/L MO
Wet Weight Dry Weight
Figure 2. Effect of MO dye on S. molesta growth. The letters “A” and “B” represent statistically significant
differences in wet weight on a specific day when compared with different MO concentrations (p < 0.05). The
letter “a” represents no statistically significant differences in dry weight on a specific day when compared with
different MO concentrations. Values represent the mean of triplicate experiments.
Figure 3. Physical appearance of S. molesta after a 10-day exposure to (a) 5 mg/L MO, (b) 15 mg/L MO, and (c)
25 mg/L MO.
0.1
0.09
A
Relative growth rate (day -1)
0.08
0.07 B
0.06 C
0.05
0.04 D
0.03
0.02
0.01
0
0 mg/L PC 5 mg/L 15 mg/L 25 mg/L
MO concentration (mg/L)
Figure 4. Effect of three MO dye concentrations (5, 15, and 25 mg/L) on the relative growth rate of S. molesta.
There is no significant difference between relative growth rate (RGR) with the same letter (A or B).
the contaminant concentration. The same principle can be used if this plant were to be applied in real wastewater
of different concentrations. In this work, the ratio was determined as the amount of initial dye content to the
fresh wet weights since floating plants were used. From Table 2, a ratio of 0.67 mg MO mass / g of fresh plants
would be the maximum ratio to be used to quantify the amount of required plant biomass for future application
in different dye concentration of wastewater or in pilot scale application.
Hence, the overall findings indicate that S. molesta has potential used in phytoremediation and can be applied
in wastewater treatment ponds with low pollutant concentrations, which is in agreement with the conclusion
Scientific Reports | (2020) 10:13980 | https://doi.org/10.1038/s41598-020-70740-5 4
Vol:.(1234567890)www.nature.com/scientificreports/
Dye concentration (mg/L MO) 5 15 25
Volume of wastewater (L) 4 4 4
Initial dye content (mg) 20 60 100
Fresh wet weight (g) 150 150 150
Ratio of dye to wet weight (mg/g) 0.13 0.40 0.67
Table 2. Ratio of initial dye content in contaminated water to the fresh wet weight of Salvinia molesta.
With plants Without plants Removal /with plants Removal/ without plants
7 A 50
A 40
6
A 30
B
B
Removal of MO (%)
A C C
Absorbance (%)
5 20
B C B
A
A A B
B A C 10
4
0
3 -10
a a
a a a a a -20
2
a -30
a a a a a a
1 a a a a a a a -40
0 -50
Day 0
Day 1
Day 2
Day 3
Day 5
Day 8
Day 10
Day 0
Day 1
Day 2
Day 3
Day 5
Day 8
Day 10
Day 0
Day 1
Day 2
Day 3
Day 5
Day 8
Day 10
5 mg/L MO 15 mg/L MO 25 mg/L MO
Figure 5. Effect of S. molesta on the decolorization of MO dye at different concentrations (5, 15, and 25 mg/L).
Letter “a” means significant decrease in MO concentration between the two systems. Letters A, B, and C
represent statistically significant differences in removal efficiency of MO from water within MO concentrations
for each day (p < 0.05). Mean ± SD (n = 3).
Tests of between-subjects effects
Dependent variable Source df F Sig.*
Treatment * time 5 316.071 0.000
Treatment * MO 2 246.161 0.000
Removal efficiency
Time * MO 10 140.802 0.000
Treatment * time * MO 10 59.603 0.000
Plant growth (wet weight) Time * MO 4 2.359365 0.092
Table 3. Interaction between dependent variables of removal efficiency and plant growth (wet weight) with
independent variables of treatment, time, and MO concentrations. *Difference is significant at the 0.05 level.
obtained by Muthunarayanan et al.40, who used Eichhornia crassipes to decolourise dyes in textile effluent. In
addition, S. molesta had demonstrated to remove 31% of ammonia after 12 day of exposure41.
Decolorization of methyl orange dye. Removal of dye was determined at different concentrations with
150 g of S. molesta. The adsorption of the three MO dye concentrations within 10 days varied greatly compared
to the control dye (without plants) (Fig. 5). After a 10-day exposure of S. molesta to 5, 15, and 25 mg/L MO dye,
the concentrations of the dye decreased to 2.9, 8.95, and 20.92 mg/L compared to the glass vessel without plants,
in which the MO dye decreased to 4.6, 10.5, and 23.12 mg/L, respectively. The MO decolorization efficiencies for
different concentrations (5, 15 and 25 mg/L dyes) were 42, 20, and 15%, respectively, indicating the dye can be
removed effectively by S. molesta. The decolorization of the MO dye in the contaminant control was only 12, 7,
and 6% for 5, 15, and 25 mg/L dye concentrations, respectively, providing evidence for the significant role of the
plants in the removal of MO dye. Extending treatment time may lead to better dye removal achievement. Study
Scientific Reports | (2020) 10:13980 | https://doi.org/10.1038/s41598-020-70740-5 5
Vol.:(0123456789)www.nature.com/scientificreports/
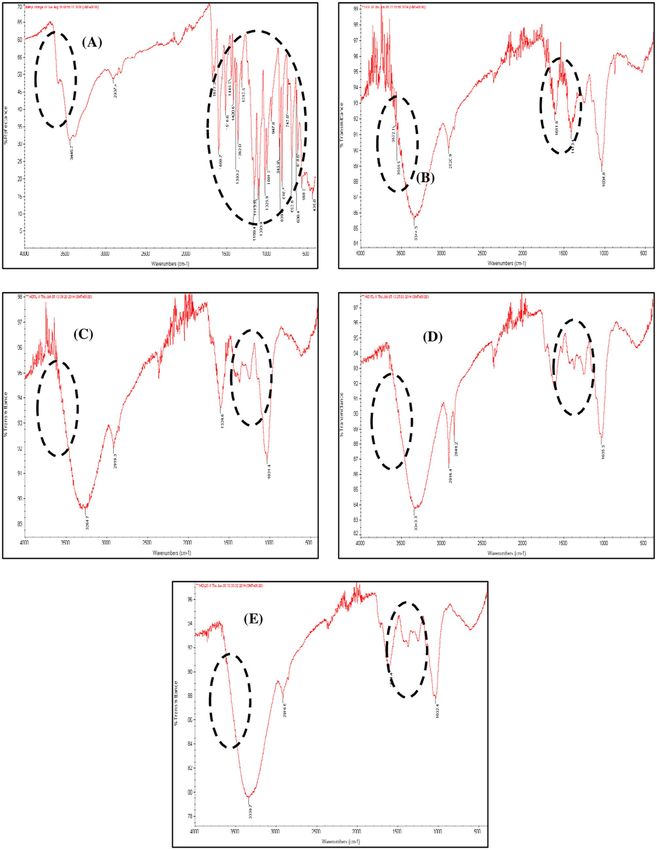
Figure 6. Fourier transform infrared (FTIR) spectral analysis of the samples: (A) MO dye, (B) S. molesta
planted in distilled water, (C) S. molesta in 5 mg/L MO, (D) S. molesta in 15 mg/L MO by S. molesta, and (E) S.
molesta in 25 mg/L MO. The dashed black circles focus on the change in compounds in different water media.
Scientific Reports | (2020) 10:13980 | https://doi.org/10.1038/s41598-020-70740-5 6
Vol:.(1234567890)www.nature.com/scientificreports/
on different type of aquatic plants indicated same trend as obtained by Yaseen and Scholz37, who utilised float-
ing plant of Lemna minor in microcosms as a polishing stage for treatment of 10 mg/L dye in textile wastewater
with 53% removal. Statistical analysis confirmed that there was a significant difference (p < 0.05) in MO removal
within the different concentrations for each day, as shown in Fig. 5. The decolourization in the control glass ves-
sel might be due to the microbe activities and photodegradation25.
Comparing the results of the current study with previous studies, a study by Li et al.42 showed a new novelty
for the decolorization of the azo methyl orange (MO) dye in aqueous solution through a new clay-supported
nanoscale zero-valent iron with 99.1% decolorization over 50 min. Ornamental plants of Tagetes patula, Aster
amellus, Portulaca grandiflora and Gaillardia grandiflora, grown for one month on the ridges of wetland which
was irrigated with textile wastewater, could reduce the ADMI values in soil by 18, 25, 40, 47, 66 and 73% as
observed within 30 days, r espectively43. Plants of Fimbristylis dichotoma and Ammannia baccifera had decolorized
50 mg/L methyl orange up to 91% and 89% after 60 h exposure, respectively. Whereas, when applied together
as a consortium, MO decolorization of 95% was achieved within 48 h of exposure44. Also, Chandanshive et al.45
observed that Salvinia molesta had the capability to degrade azo dye, Rubine GFL, up to 97% at a concentration
of 100 mg/L within 3 days using 6,072 g of root biomass.
As shown in Table 3, there was a significant interaction between treatment, time and MO concentrations
with removal of MO efficiency by S. molesta [F(72) = 59.603, p < 0.05]. While, there was no significant interaction
between time and MO concentrations with plant growth, F(18) = 2.359, p > 0.05.
Fourier transform infrared (FTIR) spectroscopy analysis for phytotransformation. The FTIR
spectrum of the control dye (Fig. 6A) varied significantly from the spectrum of MO decolourization at different
concentrations by S. molesta (Fig. 6C–E), and it was found that S. molesta that grow in distilled water (Fig. 6B).
The results support the phytotransformation of the dye into different metabolites. The FTIR spectrum of the MO
dye (Fig. 6A) shows the presence of different high peaks at 3,445.7 cm−1 for the secondary amides (N–H stretch),
1,600.6 cm−1 for the aromatic compounds (C–C stretch), 1,113.5 cm−1 for aliphatic amines (C–N stretch), and
693.6 cm−1 for alkyl halides (C–Cl stretch).
The FTIR spectra of MO phytotransformation at different concentrations by S. molesta (Fig. 6C–E) show
major peaks at 3,338.8 cm−1 for secondary amides (N–H stretch); 2,917 cm−1 for alkanes (C–H stretch);
2,849.2 cm−1 for aldehydes (H–C = O: C–H stretch); 1616.5 cm−1 for amines (N–H bend); and 1,033.8 cm−1 for
alcohols, carboxylic acids, esters, and ethers (C–O stretch). While the FTIR spectra of the S. molesta plant in
distilled water (Fig. 6B) showed peaks at 3,572 cm−1 for alcohols (O–H), 2,920.9 cm−1 for alkanes (C–H stretch),
1611.8 1 cm−1 for amines (N–H bend), 1,413.4 cm−1 for aromatics (C–C stretch), and 1,034 cm−1 for aliphatic
amines (C–N stretch), indicating substantial changes in the peak position in comparison to the exposed plants
with MO dye (Fig. 6C–E). The disappearance of a peak that was present in the spectrum of the dye indicates
that the MO dye bond split46.
Conclusions
The outcomes have indicated the significant role of the floating plant, S. molesta for decolorization of 5 mg/L
of MO dye, with a removal efficiency of 42% compared with only 12% for the control MO dye over 10 days. In
addition, FTIR tests confirmed the phytotransformation of MO dye by S. molesta. Since green biomass can be
regenerated as wet weight increased from 8 ± 0.5 g to 14 ± 2 g in different MO dye concentrations of aqueous
solution and is not affected by MO dye, phytoremediation using S. molesta is a promising approach to remove
dyes from contaminated water.
Received: 20 April 2020; Accepted: 31 July 2020
References
1. Pudukudy, M. & Yaakob, Z. Facile solid state synthesis of ZnO hexagonal nanogranules with excellent photocatalytic activity. Appl.
Surf. Sci. 292, 520–530 (2014).
2. Khataee, A. R., Movafeghi, A., Torbati, S., SalehiLisar, S. Y. & Zarei, M. Phytoremediation potential of duckweed (Lemna minor
L.) in degradation of C.I. Acid Blue 92: artificial neural network modelling. Ecotoxicol. Environ. Saf. 80, 291–298 (2012).
3. Kolekar, Y. M. et al. Decolorization and biodegradation of azo dye, reactive blue 59 by aerobic granules. Bioresour. Technol. 104,
818–822 (2012).
4. Koupaie, E. H., Moghaddam, M. R. A. & Hashemi, S. H. Evaluation of integrated anaerobic/aerobic fixed-bed sequencing batch
biofilm reactor for decolorization and biodegradation of azo dye Acid Red 18: comparison of using two types of packing media.
Bioresour. Technol. 127, 415–421 (2013).
5. Huo, Y. N. et al. Methyl orange removal by combined visible-light photocatalysis and membrane distillation. Dyes Pigments. 98,
106–112 (2013).
6. Le, H. A., Linh, L. T., Chin, S. & Jurng, J. Photocatalytic degradation of methylene blue by a combination of TiO2-anatase and
coconut shell activated carbon. Powder Technol. 225, 167–175 (2012).
7. Manan, W. N. Q. A. W., Santanaraj, J., Sajab, M. S., Isahak, W. N. R. W. & Chia, C. H. Discoloration of batik effluent by chemically
modified oil palm empty fruit bunch fibers. Jurnal Kejuruteraan 1(4), 87–92 (2018).
8. Abdullah, S. R. S. et al. Plant-assisted remediation of hydrocarbons in water and soil: Application, mechanisms, challenges and
opportunities. Chemosphere 247, 125932 (2020).
9. Fadhil, N. M. & Al-Baldawi, I. A. Biodegradation of total petroleum hydrocarbon from Al-Daura refinery wastewater by rhizo-
bacteria. J. Eng. 26, 14–23 (2020).
10. Titah, H. S. et al. Arsenic resistance and biosorption by isolated rhizobacteria from the roots of Ludwigia octovalvis. Int. J. Microbiol.
3101498, 1–10 (2018).
11. Kamaruzzaman, M. A. et al. Potential of hexavalent chromium-resistant rhizosphere bacteria in promoting plant growth and
hexavalent chromium reduction. J. Environ. Biology. 40, 427–433 (2019).
Scientific Reports | (2020) 10:13980 | https://doi.org/10.1038/s41598-020-70740-5 7
Vol.:(0123456789)www.nature.com/scientificreports/
12. Ismail, N. I. et al. Accumulation of Fe-Al by Scirpus grossus grown in synthetic bauxite mining wastewater and identification of its
resistant rhizobacteria. Environ. Eng. Sci. 34(5), 367–375 (2017).
13. Ismail, N. I. et al. Simultaneous bioaccumulation and translocation of iron and aluminium from mining wastewater by Scirpus
grossus. Desal. Water Treat. 163, 133–142 (2019).
14. Fadhil, N. M. & Al-Baldawi, I. A. Mechanisms of plant-correlation phytoremediation of Al-Daura Iraqi refinery wastewater using
wetland plant from Tigris River. J. Eng. 25, 20–32 (2019).
15. Al-Baldawi, I. A., Abdullah, S. R. S., Anuar, N. & Idris, M. Bioaugmentation for the enhancement of hydrocarbon phytoremedia-
tion by rhizobacteria consortium in pilot horizontal subsurface flow constructed wetlands. Int. J. Environ. Sci. Technol. 14, 75–84
(2017).
16. Almansoory, A. F., Idris, M., Abdullah, S. R. S. & Anuar, N. Phytoremediation of contaminated soils containing gasoline using
Ludwigia octovalvis (Jacq.) in greenhouse pots. Environ. Sci. Pollut. Res. 24, 11998–12008 (2017).
17. Allamin, I. A. et al. Rhizodegradation of petroleum oily sludge-contaminated soil using Cajanus cajan increases the diversity of
soil microbial community. Sci. Rep. 10, 4094 (2020).
18. Kadir, A. A., Abdullah, S. R. S. & Hasan, H. A. Comparative phytotoxicity of Azolla pinnata and Lemna minor in treated palm oil
mill effluent. Int. J. Eng. Technol. 7, 2499–2505 (2018).
19. Kadir, A. A. et al. Dual Function of Lemna minor and Azolla pinnata as phytoremediator for palm oil mill effluent and as feedstock.
Chemosphere 259, 127468 (2020).
20. Nash, D. A. H. et al. Phytoremediation of nutrients and organic carbon from sago mill effluent using water hyacinth (Eichhornia
crassipes). J. Eng. Technol. Sci. 51, 573 (2019).
21. Said, N. S. M., Abdullah, S. R. S., Ismail, N. I., Hasan, H. A. & Othman, A. R. Phytoremediation of real coffee industry effluent
through a continuous two-stage constructed wetland system. Environ. Technol. Innov. 17, 1–12 (2020).
22. Kabra, A. N., Khandare, R. V., Waghmode, T. R. & Govindwar, S. P. Technical Note: Phytoremediation of textile effluent and mixture
of structurally different dyes by Glandularia pulchella (Sweet) Tronc. Chemosphere 87, 265–272 (2012).
23. Al-Baldawi, I. A., Abdullah, S. R. S., Hasan, H. A. & Anuar, N. Phytotransformation of methylene blue from water using aquatic
plant (Azolla pinnata). Environ. Techol. Innov. 11, 15–22 (2018).
24. Al-Baldawi, I. A., Abdullah, S. R. S., Suja, F., Anuar, N. & Idris, M. International conference on environment, energy and biotech-
nology. IPCBEE 33, 244–247 (2012).
25. Characteristics and partial mechanism. Du, L. et al. Efficient metabolism of the azo dye methyl orange by Aeromonas sp. strain
DH-6. Int. Biodeterior. Biodegrad. 105, 66–72 (2015).
26. Kagalkar, A. N., Jagtap, U. B., Jadhav, J. P., Bapat, V. A. & Govindwar, S. P. Biotechnological strategies for phytoremediation of the
sulphonated azo dye Direct Red 5B using Blumea malcolmii Hook. Bioresour. Technol. 100, 4104–4110 (2009).
27. Abdulqader, E. et al. Plant-assisted remediation of wastewater contaminated with methyl orange using Scirpus grossus. J. Environ.
Biol. 40, 515–523 (2019).
28. Davies, L. C., Carias, C. C., Novais, J. M. & Martins-Dias, S. Phytoremediation of textile effluents containing azo dye by using
Phragmites australis in a vertical flow constructed intermittent feeding constructed wetland. Ecol. Eng. 25, 594–605 (2005).
29. Pi, K., Xiao, Q., Zhang, H., Xia, M. & Gerson, A. R. Decolorization of synthetic Methyl Orange wastewater by electrocoagulation
with periodicreversal of electrodes and optimization by RSM. Process Saf. Environ. Prot. 92, 796–806 (2014).
30. Bakar, B. B. Invasive weed species in Malaysian agro-ecosystems: species, impacts and management. Mal. J. Sci. 23, 1–42 (2004).
31. University of Florida, Center for Aquatic and Invasive Plants, Institute of Food and Agricultural Sciences. http://plants.ifas.ufl.
edu/plant-directory/salvinia-molesta (2020).
32. Ng, Y. S. & Chan, D. J. C. Phytoremediation capabilities of Spirodela polyrhiza, Salvinia molesta and Lemna sp. in synthetic waste-
water: a comparative study. Int. J. Phytoremediat. 20, 1179–1186 (2018).
33. Tan, K. A., Morad, N. & Ooi, J. Q. Phytoremediation of methylene blue and methyl orange using Eichhornia crassipes. Int. J. Environ.
Sci. Dev. 7, 724–728 (2016).
34. Watharkar, A. D., Rane, N. R., Swapnil, M. P., Khandare, R. V. & Jadhav, J. P. Enhanced phytotransformation of NavyBlue RX dye
by Petunia grandiflora Juss. with augmentation of rhizospheric Bacillus pumilus strain PgJ and subsequent toxicity analysis. Biores.
Technol. 142, 246–254 (2013).
35. Radic, S., Babic, M., Skobic, D., Roje, V. & Pevalek-Kozlina, B. Ecotoxicological effects of aluminum and zinc on growth and
antioxidants in Lemna minor L. Ecotoxicol. Environ. Saf. 73, 336–342 (2010).
36. Lokhande, V. H., Kudale, S., Nikalje, G., Desai, N. & Suprasanna, P. Hairy root induction and phytoremediation of textile dye,
Reactive green 19A-HE4BD, in a halophyte, Sesuvium portulacastrum (L.) L. Biotechnol. Rep. 8, 56–63 (2015).
37. Yaseen, D. A. & Scholz, M. Treatment of synthetic textile wastewater containing dye mixtures with microcosms. Environ. Sci. Pollut.
Res. Int. 25, 1980–1997 (2018).
38. Dhir, B., Sharmila, P. & Saradhi, P. P. Photosynthetic performance of Salvinia natans exposed to chromium and zinc rich wastewater.
Braz. J. Plant Physiol. 20, 61–70 (2008).
39. Al-Baldawi, I. A. W., Abdullah, S. R. S., Suja, F., Anuar, N. & Idris, M. The ratio of plant numbers to the total mass of contaminant
as one factor in scaling-up phytoremediation process. Jurnal Teknologi 74(3), 111–114 (2015).
40. Muthunarayanan, V., Santhiya, M., Swabna, V. & Geetha, A. Phytodegradation of textile dyes by water hyacinth (Eichhornia cras-
sipes) from aqueous dye solutions. Int. J. Environ. Sci. 1, 1702–1717 (2011).
41. Ng, Y. S. & Chan, D. J. C. Wastewater phytoremediation by Salvinia molesta. J. Water Process Eng. 15, 107–115 (2017).
42. Li, X. et al. Decolorization of Methyl Orange by a new clay-supported nanoscale zero-valent iron: synergetic effect, efficiency
optimization and mechanism. J. Environ. Sci. 52, 8–17 (2016).
43. Chandanshive, V. V. et al. In situ phytoremediation of dyes from textile wastewater using garden ornamental plants, effect on soil
quality and plant growth. Chemosphere 210, 968–976 (2018).
44. Kadam, S. K. et al. Phytobeds with Fimbristylis dichotoma and Ammannia baccifera for treatment of real textile effluent: An in situ
treatment, anatomical studies and toxicity evaluation. Environ. Res. 160, 1–11 (2018).
45. Chandanshive, V. V. et al. Efficient decolorization and detoxification of textile industry effluent by Salvinia molesta in lagoon
treatment. Environ Res. 150, 88–96 (2016).
46. Patil, A. V. & Jadhav, J. P. Evaluation of phytoremediation potential of Tagetes patula L. for the degradation of textile dye Reactive
Blue 160 and assessment of the toxicity of degraded metabolites by cytogenotoxicity. Chemosphere 92, 225–232 (2013).
Acknowledgements
This work was supported by Universiti Kebangsaan Malaysia (UKM) through DIP-2019-017 research grant and
Tasik Chini Research Centre, UKM. They also acknowledge Al-Khwarizmi College of Engineering, University
of Baghdad for supporting first author through collaboration work with UKM.
Scientific Reports | (2020) 10:13980 | https://doi.org/10.1038/s41598-020-70740-5 8
Vol:.(1234567890)www.nature.com/scientificreports/
Author contributions
I.A.A.: conceptualization, investigation, data curation, methodology, writing—original draft. S.R.S.A.: concep-
tualization, supervision, writing—review and editing, funding acquisition, resources. A.F.A.: investigation, data
curation. N.I.I.: writing—review and editing, investigation, data curation. H.A.H.: supervision. N.A.: supervision.
Competing interests
The authors declare no competing interests.
Additional information
Correspondence and requests for materials should be addressed to N.’.I.
Reprints and permissions information is available at www.nature.com/reprints.
Publisher’s note Springer Nature remains neutral with regard to jurisdictional claims in published maps and
institutional affiliations.
Open Access This article is licensed under a Creative Commons Attribution 4.0 International
License, which permits use, sharing, adaptation, distribution and reproduction in any medium or
format, as long as you give appropriate credit to the original author(s) and the source, provide a link to the
Creative Commons licence, and indicate if changes were made. The images or other third party material in this
article are included in the article’s Creative Commons licence, unless indicated otherwise in a credit line to the
material. If material is not included in the article’s Creative Commons licence and your intended use is not
permitted by statutory regulation or exceeds the permitted use, you will need to obtain permission directly from
the copyright holder. To view a copy of this licence, visit http://creativecommons.org/licenses/by/4.0/.
© The Author(s) 2020
Scientific Reports | (2020) 10:13980 | https://doi.org/10.1038/s41598-020-70740-5 9
Vol.:(0123456789)You can also read