ACC BUSINESS ACCOUNTING - Financial Analysis of Easyjet Plc and Ryanair Holdings Plc Prepared for Coventry University Prepared by
←
→
Page content transcription
If your browser does not render page correctly, please read the page content below
ACC
   BUSINESS ACCOUNTING
Financial Analysis of Easyjet Plc
   and Ryanair Holdings Plc
              Prepared for

           Coventry University

              Prepared by

               ber th, 202

                                    1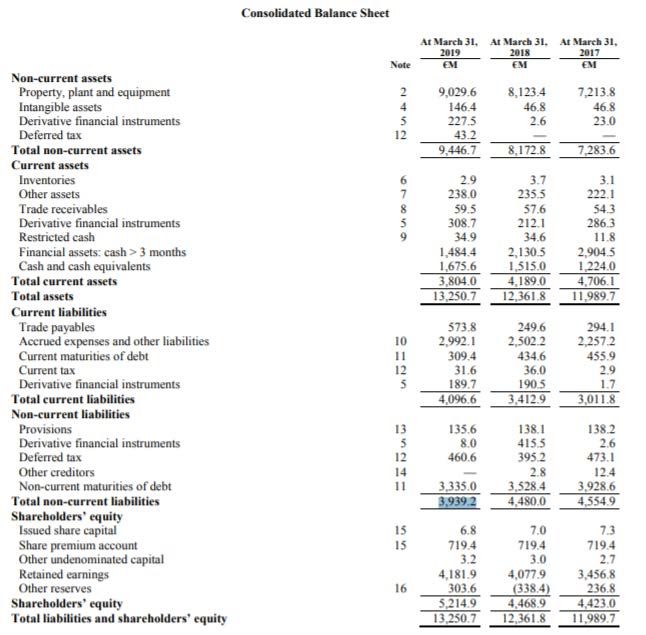
Contents
Introduction.............................................................................................................................................. 3
SWOT ........................................................................................................................................................ 3
   Strengths .............................................................................................................................................. 5
   Weaknesses .......................................................................................................................................... 6
   Opportunities ....................................................................................................................................... 6
   Threats.................................................................................................................................................. 7
Conclusion ................................................................................................................................................ 8
   Recommendations ............................................................................................................................... 9
References .............................................................................................................................................. 10
Appendix................................................................................................................................................. 11

                                                                                                                                                             2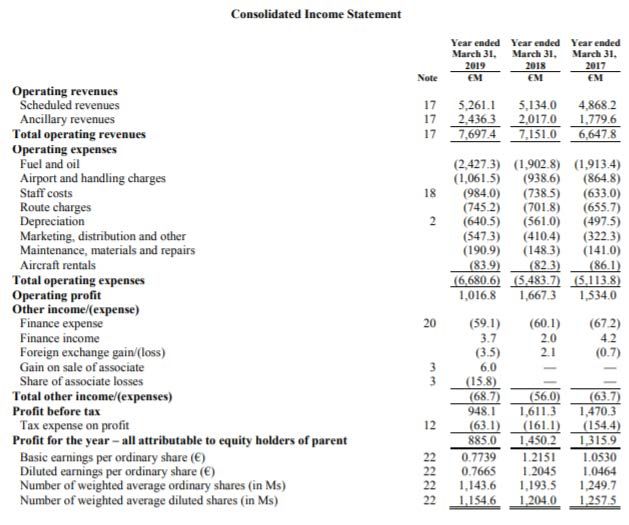
Introduction
Financial decisions are crucial part of business activities because it has direct impact on the liquidity
and solvency of its operations. In order to make viable financial decisions, the management of a firm is
required to conduct appropriate analysis on the available information. For this aspect, they make use
of various financial tools and technique based on the decision of entity (Graff, 2013). This report will
focus on the evaluation of financial analysis of EasyJet Plc and Ryanair Holdings. In order to understand
the financial performance of EasyJet Plc and Ryanair Holdings Plc the SWOT/SWOC framework will be
undertaken to analyse and compare the performance of the two airline companies. This analysis will
be supported by comparing and contrasting differences in their cash-flow, sources of finance and
related strategies supported by description of impact of recent economic conditions on them. Further,
financial performance of both the companies will be evaluated by computation of financial ratios. In
order to assure financial feasibility and viability of project, provisions of capital investment decision
making will be discussed.

SWOT
Ryanair serves a low fare airline serving short distance routes between Ireland, the United Kingdom,
and Continental Europe, as well as Morocco. The company's unique business model concentrating on
lowering operational expenses allows it to deliver high asset usage and perform steady financial
performance. Nevertheless, strong competition could affect Ryanair's capacity to increase customer
amounts as well as increase its operational network, which could produce an unfavourable result on
its market share. All calculations for Ryanair were calculated in GDP.

EasyJet is a European low-cost airline, the company’s stable position in the key aviation markets of
Europe supported by its competitive business model helps the corporation in performing sustainable

                                                                                                       3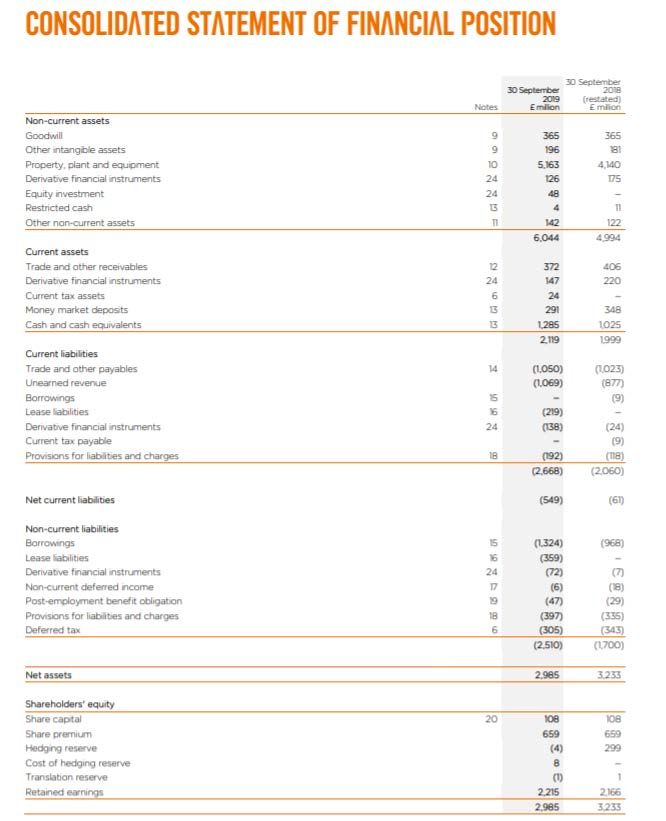
financial and operational performance. Nonetheless, the administrative charge rises at the airline's
main airports could boost its overall expense and negatively influence its efforts to reduce its costs.

Ratios                      Formula                          Ryanair                easyJet
Profityability ratios
                                                           (£1016,8m/£3939,2
Return on capital           (operating profit/capital                               (£466m/£2985m+£25
                                                           m+£5214,9m)*100%
employed (%)                employed)*100%                                          10m)*100%= 8,48%
                                                           = 11,1%
Net profit margin (Profit (profit from                     (£1016,8m/£7697,4        (466m/£6385m)*100
from Operations margin) opererations/revenue)*100% m)*100%= 13,2%                   %= 7,29%
                                                           (£1564m/£7697,4m)        (£1050m/£6385m)*1
Gross profit margin (%) (gross profit/revenue)*100%
                                                           *100%= 20,31%            00%= 16,44%
Efficiency ratios
Inventory holding         (inventory/cost of sales)*365 (£2,9m/£6133m)*36
                                                                                    N/A
period (days)             days                             5 days= 0,17 days
Trade receivables         (trade receivables/              (£59,9m/£7697,4m)*       (£372m/£6385m)*36
collection period (days) revenue)*365 days                 365days= 2,84 days       5 days= 21,26 days
Trade payables payment (trade payables/ cost of            (£573,8m/£6133m)*        (£1050m/£5335m)*3
period (days)             sales)*365 days                  365= 34,14 days          65 days= 71,83 days
                          Inventory holding period +
Cash-to-cash cycle        Trade receivables collection 0,17+2,84-34,14= -
                                                                                    N/A
(days)                    period - Trade payables          31,13 days
                          payment period
Liquidity ratios
                          current assets/current           £3804m/£4096,6m=         £2119m/£2668m=
Current ratio
                          liabilities                      0,9285                   0,7942
                                                           £3804m-
                          current assets-
Acid test ratio                                            £2,9m/£4096,6m=          N/A
                          inventory/current liabilities
                                                           0,9278
Gearing ratios
                                                           (£3939,2m/£3939,2
                          (non-current liabilities/capital                          (£2510m/£2985m+£2
Debt/equity ratio (%)                                      m+£5214,9m)*100%
                          employed)*100%                                            510m)*100%= 45%
                                                           = 43%
                            profit before interest and       £1017m/£59m=           £466m/£60m= 7,7
Interest cover
                            tax/interest payable             17,23 times            times

Table 1

                                                                                                          4
Strengths
Ryanair focuses on transporting passengers at the lowest operational cost possible and is among the
best at that in Europe. As well the company is among the greenest and environmentally friendly airlines
in Europe according to their 2019 annual report. “The company focuses on reducing and controlling
four of the primary expenses involved in running a major scheduled airline: aircraft equipment costs,
personnel costs, customer service costs, and airport access and handling costs. Ryanair's primary
strategy for controlling aircraft acquisition costs is focused on operating a single aircraft type” (Ryanair
Holdings plc SWOT Analysis, 2020). The airline is operating only a single aircraft type; therefore, it is
better at controlling operating costs of crew training, maintenance of aircrafts, and the acquisition and
storing of parts. EasyJet is one of the largest airlines in the UK with a market share of around 41% and
in the total European market it comes at second place after Ryanair. In the UK the airline strengthened
its position as the leading company in the domestic, with growth at major UK cities. In 2019, easyJet’s
capacity grew by 9.8 million seats which constitutes 10.3% growth, it was a faster rate of growth than
the market’s, which grew by 5.3%.
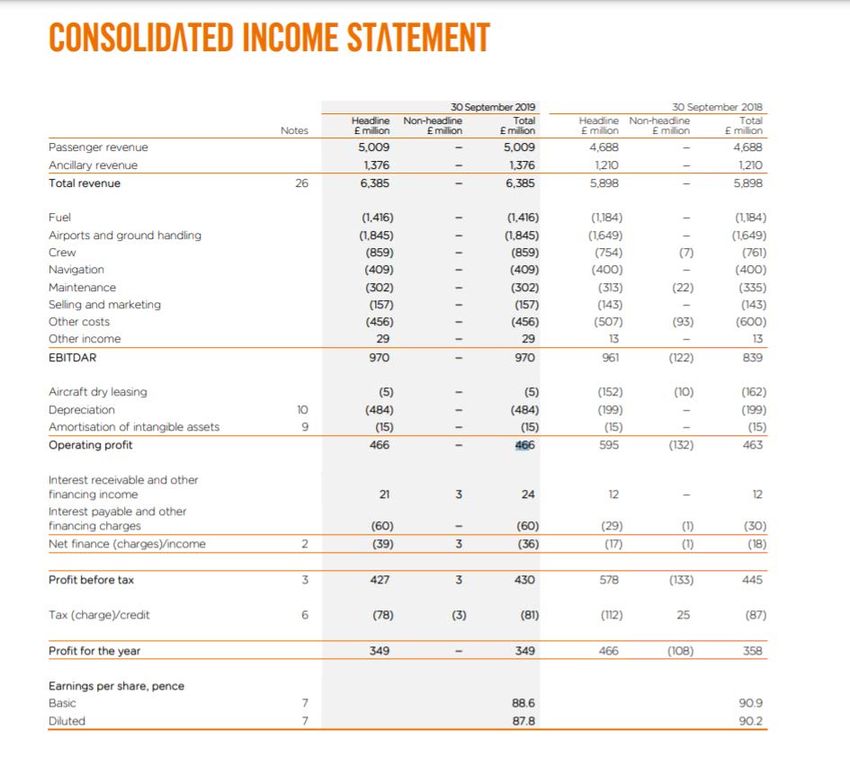
During the 2019 financial year Ryanair’s revenue grew by 7.098% (Appendix B) over the 2018 financial
year and when compared to easyJet’s revenue which grew by 7.62% (Appendix D) over the same period
so the two airlines revenue growth is only insignificantly different. During the 2019 financial year,
Ryanair recorded non-current liabilities of £ 3532.1 million (Appendix A) which indicates a debt to
equity ratio of 43.56% (Table 1) so it is below the benchmark of 50% which means the airlines debt to
equity ratio is good, over the same period easyJet recorded non-current liabilities of £2510 million
(Appendix C) which indicates a debt to equity ratio of 45.67% (Table 1) so it is below the benchmark of
50% which means the airlines debt to equity ratio is good so the two companies are doing well in their
debt to equity ratio. As well the operating profit of easyJet has grown by 0.64% (calculated from the
data in Appendix D) from 2018 in comparison to 39% (calculated from the data in Appendix B) decline
of Ryanair, so easyJet is doing much better in controlling its operating expenses than Ryanair. Ryanair
has an inventory holding period of 0.17 days (Table 1) which indicates good efficiency in selling and
using their inventory. Ryanair and easyJet have a trade receivables collection period of 2.84 days (Table
1) and 21.26 days (Table 1) respectively, the result for 2019 shows it is taking easyJet much longer to
collect receivables from its customers, which suggests poor credit control and high risk of bad debts.
Ryanair and easyJet have a trade payables payment period of 34.14 days (Table 1) and 71.83 days
(Table 1) respectively, the result for 2019 shows it is taking easyJet much longer to pay back its debtors,
5which suggests poor credit control and high risk of bad debts. Ryanair has a lower fare on flights than
easyJet which could be considered an advantage with cost sensitive customers. As well Ryanair earns
more per passenger, the company in 2019 reported £15.51 and easyJet reported £13.10. The data
overall shows that Ryanair is statistically the bigger company of the two and offers slightly lower fares
than easyJet and its competitors.
Weaknesses
“Ryanair is involved in various lawsuits, claims, and legal proceedings, arising in the ordinary course of
its business. Some of these legal proceedings and claims seek damages, fines, or penalties in substantial
amounts or remediation of environmental contamination” (Ryanair Holdings plc SWOT Analysis, 2020).
Ryanair weakened financial performance could decrease investor confidence, not attract any new
investors and impact its ability to pursue growth plans. Ryanair reported a significant decline profit
levels in 2019, although during the 2019 financial year the companies’ revenue grew by 7.62%
(Appendix B) on an annual basis though its operating profit has declined by 39% (Appendix B) when
compared to easyJet’s little growth in operating profit of 0.64% (Appendix D), Ryanair is doing
significantly worse at controlling its operating expenses and the net profit of Ryanair has shrunk by
38.97% (Appendix B) over the same period. Ryanair also reported a drop in its operating margin to
13.2% (Appendix B) in 2019 from 23.3% (Appendix B) in 2018. Ryanair registered 11.1% (Table 1) of
ROCE in 2019 against 18.63% (calculated from data in Appendix A and B) in 2018, a drop of 7.53% and
easyJet recorded 8.48% (Table 1) of ROCE in 2019 against 9.38% (calculated from data in Appendix C
and D), a decrease of 0.9%, which indicates that easyJet has a significantly more stable return for
investors. At the end of 2019 financial year, easyJet recorded a 94.7% (calculated from data in Appendix
C) surge in debt, which increased to £1,902 million (Appendix C) from £977 million (Appendix C) during
2018. At the end of 2019 financial year, easyJet recorded a 7.7% (calculated from data in Appendix C)
drop in capital, which dropped to £2,985 million from £3,233 million during 2018 financial year.
Opportunities
The global tourism industry was booming which could have increased the need for the group's services.
But as of 2020, the tourism industry is suffocating due to the ongoing COVID-19 global pandemic which
has restricted travel, made people stay at home, and made airlines stop flights which resulted in firing
staff and additional storage costs.
6One of many opportunities is that customers are price sensitive, the slowdown of the economy during
the pandemic will definitely lead customers to pursue low-fare airlines, but the pandemic is making it
hard for low-fare airlines to operate due to reduced passenger numbers. According to MarketLine
Ryanair Holdings plc SWOT Analysis, 2020 the company focused on the continuous expansion and
increase of new routes to improve its competitiveness and grow business. “In November 2019, the
company expanded its flight services to Georgia and introduced six new routes from Milan Bergamo.
It also announced its plan to launch new twice weekly services from Kherson in Ukraine to Katowice,
Poland. In October 2019, Ryanair introduced a new service from Yerevan to Milan Bergamo and Rome
Ciampino; and Yerevan to Berlin Schonefeld. In the same month, the company announced its plans to
introduce a new route between Marrakech and Zaragoza; and Kherson and Vienna. In September 2019,
Ryanair announced its plans to introduce four new Bologna routes this winter; and Luxemburg to
Toulouse. In August 2019, the company introduced the Bristol-Turin service” (Ryanair Holdings plc
SWOT Analysis, 2020). So due to the ongoing COVID-19 global pandemic the opportunities of Ryanair
are not clear. EasyJet was likely to benefit from the positive outlook for European travel and tourism
industry if the COVID-19 global pandemic would have not occurred. “According to the World Travel
and Tourism Council (WTTC), the European travel and tourism industry’s direct contribution to GDP
expected to reach to EUR873.3 billion in 2028 at a growth rate of 2.4% per annum during 2018-2028.
Its total contribution to GDP is expected to increase 2.2% per annum to EUR2,367.1 billion in 2028.
Visitor exports are expected to increase at 3.7% per annum from 2018-2028 to EUR717 billion in 2028.
Increase in investments to EUR265.8 billion by 2028 is likely to result in growth in the European travel
and tourism sector” (easyJet Plc SWOT Analysis, 2020). An opportunity for Ryanair occurs in its
operating expenses, reducing them would give them a competitive advantage and make them more
attractive for investors which in the long-term could increase their market share. But due to the
ongoing COVID-19 global pandemic the opportunities of easyJet are not clear.
Threats
One of the few threats to both Ryanair and easyJet is oil price which is significant to both, for Ryanair
the cost of fuel grew by 28% (Ryanair Annual report, 2019). Another one is terrorism and security threat
on the aviation industry might increase the safety and security expenses. A new entrant to the low-
fare airline market could be a possible threat to both companies as well. The decline of Ryanair
operating profit by 39% can suggest some threats to the company such as inefficient cost control.
Ryanair also reported a drop in its operating margin to 13.2% in 2019 from 23.3% in 2018 the
7company’s selling margins have not been maintained and this is a sign of bad control of selling and
purchasing terms. Ryanair registered 11.1% of ROCE in 2019 against 18.63% in 2018, a drop of 7.53%
this is a bad return for investors, which is a threat because it can retract investors from the airline.
Ryanair has a current ratio of 0.9285 and EasyJet has a current ratio of 0.79(in 2019 easyJet did not
report inventories so the more accurate liquidity acid test ratio which takes out inventories was not
calculated) which shows that it has low liquidity and in an event of bankruptcy this would, mean that
easyJet cannot repay all their debt even though Ryanair has better liquidity it still could not repay their
debt and Ryanair an acid test ratio of 0.9278 which points to that Ryanair has low liquidity and in an
event of bankruptcy, this would mean that it cannot repay all its debt. Due to the ongoing COVID-19
global pandemic Ryanair Holdings Plc had a big loss due to 99% of the fleet grounded from mid-March
to end June, successful return to service only implemented 1 July, traffic fell from 86m to 17m, cost
reduction measures implemented across business, Successful €1.25bn financing raised in September,
over €1.5bn debt due in 2021. EasyJet has a current ratio of 0.79(in 2019 easyJet did not report
inventories so the more accurate liquidity acid test ratio which takes out inventories was not
calculated) which shows that it has low liquidity and in an event of bankruptcy this would, mean that
they cannot repay all their deb.
Conclusion
The two airlines are doing pretty similarly in some aspects of their financial performance. Both airlines
have strategies that are alike, both share a low-cost business model. The two companies have
developed this strategy by adding new price reduction strategies such as paperless booking. Those
operational policies have generated enormous profits for the two airlines, including optimizing airline
use. Both easyJet and Ryanair also have related marketing strategies because besides marketing as
low-fare airlines. Also, the two companies have related areas of strategy, both of them have
competitors in the low-cost airline market their performance also largely depends on their ability to
support their operational models. The profitability ratios calculated in table 1 show that Ryanair is
doing a little bit better than easyJet, ROCE of Ryanair is 2.62% higher, operational profit margin of
Ryanair is 5.91% higher and the gross profit margin of Ryanair is 3.87% higher. The efficiency ratios
calculated in table 1 show that Ryanair is doing a little bit better than easyJet, it is taking Ryanair to
collect money from their customers 18.42 days quicker and it is taking Ryanair to payback its debtors
37.69 days quicker than easyJet. The liquidity ratios calculated in Table 1 show that in 2019 both
8Ryanair’s and easyJet’s revenue increased compared to 2018, both airlines have a debt to equity ratio
which is below the 50% benchmark so the two companies are doing well in their debt to equity ratio.
The operating profit of Ryanair declined by 39%, so easyJet is doing much better in controlling its
operating expenses than Ryanair. Ryanair has good efficiency in selling and using their inventory.
EasyJet is taking much longer to collect receivables from its customers than Ryanair. It is taking easyJet
much longer to payback its debtors, which suggests poor credit control and high risk of bad debts. So,
in conclusion Ryanair is doing much better in the big picture than easyJet except for controlling its
operational costs.
Recommendations
Even through Ryanair’s share prices are more stable than easyJet’s, it shows that shares in Ryanair are
actively traded as most investors see a better future prospect of Ryanair than easyJet’s. But for short
term investment easyJet is the best option because its share price is higher growing and cheaper so
when needed to sell the profit would be better than Ryanair, but considering the current situation of
the global COVID-19 pandemic I would not recommend investing in easyJet, Ryanair or any other
company in the aviation, transport or tourism market, because right now the market is unstable and
investing in it would be very risky. Considering long-term investment Ryanair would be the best choice
even though easyJet has higher earning per ordinary share, but Ryanair does a better performance of
return on the total funds used to finance the business and the gradual annual growth of it, it suggests
that the management of Ryanair is effective is in generating profits from its capital. It is also
considerably better at collecting trade receivables from its customers and better at paying its debtors
which suggests good efficiency and lower risk of bad debts. But again, I would not recommend investing
in Ryanair or any other company related to aviation or tourism due to the unstable market, but in the
long term after the COVID-19 pandemic Ryanair would be a good choice to invest once the market
stabilize.
9References
1. easyJet Plc SWOT Analysis. (2020). EasyJet plc SWOT Analysis, [online] pp.1–7. Available at:
http://web.b.ebscohost.com/ehost/pdfviewer/pdfviewer?vid=3&sid=4546b837-f547-4c1f-a843-
6bc9011f7b18%40pdc-v-sessmgr04. [Accessed 1 Dec. 2020].
2. Ryanair Holdings plc SWOT Analysis. (2020). Ryanair Holdings, PLC SWOT Analysis, [online] pp.1–7.
Available at: http://web.a.ebscohost.com/ehost/pdfviewer/pdfviewer?vid=3&sid=80f11de2-
00d9-47a4-a4f7-33673dad3517%40sessionmgr4008 [Accessed 1 Dec. 2020].
3. RYANAIR REPORTS H1 LOSS OF €197M AS TRAFFIC FALLS 80% TO 17M. (n.d.). [online] Available at:
https://investor.ryanair.com/wp-content/uploads/2020/11/Ryanair-H1-FY21-Results.pdf.
[Accessed 1 Dec. 2020].
4. Corporate.easyjet.com. 2019. [online] Available at:
https://corporate.easyjet.com/~/media/Files/E/Easyjet/pdf/investors/results-
centre/2019/eas040-annual-report-2019-web.pdf [Accessed 4 December 2020].
5. Investor.ryanair.com. 2019. [online] Available at: https://investor.ryanair.com/wp-
content/uploads/2019/07/Ryanair-2019-Annual-Report.pdf [Accessed 4 December 2020].
10Appendix
Appendix A
11Appendix B
12Appendix C
1314
Appendix D

             15
You can also read