Advances in automatic identification of flying insects using optical sensors and machine learning - Nature
←
→
Page content transcription
If your browser does not render page correctly, please read the page content below
www.nature.com/scientificreports
OPEN Advances in automatic
identification of flying insects
using optical sensors and machine
learning
Carsten Kirkeby1,2,7*, Klas Rydhmer2,7, Samantha M. Cook3, Alfred Strand2,
Martin T. Torrance3, Jennifer L. Swain3, Jord Prangsma2, Andreas Johnen4, Mikkel Jensen2,
Mikkel Brydegaard2,5 & Kaare Græsbøll6
Worldwide, farmers use insecticides to prevent crop damage caused by insect pests, while they also
rely on insect pollinators to enhance crop yield and other insect as natural enemies of pests. In order
to target pesticides to pests only, farmers must know exactly where and when pests and beneficial
insects are present in the field. A promising solution to this problem could be optical sensors combined
with machine learning. We obtained around 10,000 records of flying insects found in oilseed rape
(Brassica napus) crops, using an optical remote sensor and evaluated three different classification
methods for the obtained signals, reaching over 80% accuracy. We demonstrate that it is possible
to classify insects in flight, making it possible to optimize the application of insecticides in space
and time. This will enable a technological leap in precision agriculture, where focus on prudent and
environmentally-sensitive use of pesticides is a top priority.
Modern day agriculture entails a delicate balance between increasing crop production to accommodate an
increasing population1–3 while limiting the use of pesticides in order to reduce the development of resistance to
insecticides and to reduce other negative side effects including affecting non-target organisms, environmental
pollution and human health issues4–6. Additionally, the terrestrial insect population has declined in some areas
by more than 75% over the last 27 years7,8. This has been linked to the use of pesticides among other f actors9.
Thus, there is a demand for reducing pesticide use, and not least to apply them with as little risk for non-target
insects as possible. The key to reach this goal is to optimize the use of pesticides to periods and areas where pests
are present and other insects are least affected. This inevitably involves recognition of the insects in the field.
Oilseed rape (OSR) is the third-largest vegetable oil produced worldwide with 68.5 million tonnes produced
in 201610. In northern and central Europe alone, 26.3 million tonnes were produced in 2017 over an area of 6.7
million hectares11. There are six major pests attacking OSR in this region which means that the crop usually
receives 1 to 5 insecticide applications per year12,13. We focus on four of the most important pests: cabbage stem
flea beetles (Psylliodes chrysocephala) the adults of which can cause complete crop failure due to feeding damage
during establishment14 and the larval mining within plant stems causes considerable damage and yield loss12,15;
pollen beetles (Brassicogethes aeneus) which can reduce yield by 70% through feeding damage if no pesticides
are used 16; cabbage seed weevils (Ceutorhynchus obstrictus) which can reduce the crop yield by up to 18% due
to larval feeding on seeds12; and Brassica pod midges (Dasineura brassicae) the larvae of which cause pod shatter
and losses of seed yield by up to 82%12.
Monitoring OSR crops for pest abundance to determine whether or not pest population thresholds have been
exceeded is an important process in order to optimize application of pesticides, thereby minimizing their use12.
Plant scouting is traditionally used to achieve this but is time-consuming; yellow water traps or sticky traps are
also used12,17,18 and although there are accurate web-based decision support systems that can optimise monitoring
1
Section for Animal Welfare and Disease Control, Department of Veterinary and Animal Sciences, Faculty of
Health and Medical Sciences, University of Copenhagen, 1870 Frederiksberg, Denmark. 2FaunaPhotonics APS, Ole
Maaløes Vej 3, 2200 Copenhagen N, Denmark. 3Department of Biointeractions and Crop Protection, Rothamsted
Research, Harpenden, UK. 4Xarvio Digital Farming Solutions, BASF Digital Farming GmbH, Albrecht‑Thaer‑Strasse
34, Münster, Germany. 5Lund Laser Centre, Department of Physics, Lund University, Sölvegatan 14, 223 62 Lund,
Sweden. 6DTU Compute, Technical University of Denmark, 2800 Kongens Lyngby, Denmark. 7These authors
contributed equally: Carsten Kirkeby and Klas Rydhmer. *email: ckir@sund.ku.dk
Scientific Reports | (2021) 11:1555 | https://doi.org/10.1038/s41598-021-81005-0 1
Vol.:(0123456789)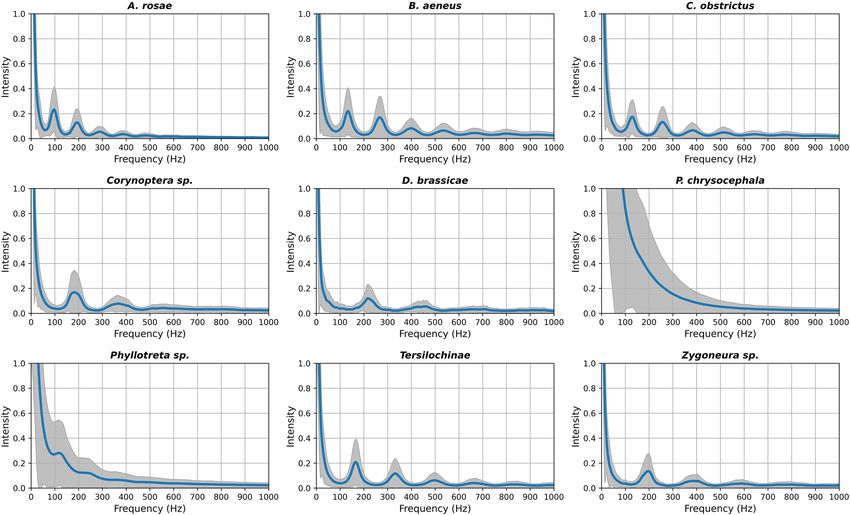
www.nature.com/scientificreports/
Figure 1. Diagrammatic representation of the process used to classify the insect groups. For each target group,
333 randomly selected target group events are used together with 42 randomly selected events from each of
the other groups, to classify the test data consisting of 50 unknown events. The accuracy of the classification is
reported. This procedure is repeated in a loop 100 times, to account for stochastic variation.
e ffort17,19, both methods require manual identification of insects. Tools for automatic identification of insects are
starting to emerge20–22. However, these traps often only reflect the local conditions around the trap, which can be
different from the situation in the whole field, as pest populations are not uniform. Precision farming, whereby
insecticide applications are adjusted according to measured variability in insect abundance, is not yet possible
due to the lack of appropriate sensors and associated imaging technology. Recently, progress has been made in
research towards remote monitoring of insects23,24. There are many studies of monitoring insect activity using
remote sensing methods. For instance, Potamitis et al.25 described the augmentation of plastic traps to identify
insect species based on wing beat frequencies. Zhu et al.26 used lidar remote sensing to detect insect activity in
rice fields in China and concluded that extensive collaboration between entomologists and physicists is needed to
link the recorded signals to insect species. Genoud et al.27 used a lidar system to remotely detect and distinguish
between mosquito species based only on their wing beat frequency using a Bayesian approach. Recently, Tauc
et al.28 have described progress with a pan-and-tilt system able to detect insects in 3D, without identification
of insect groups or species. However, such monitoring systems must be validated on known free flying insects,
to link the signals to the presence of each species or species group. This is labour-intensive, and has previously
only been conducted in a limited number of studies on disease vector insects29,30, and insects in a m eadow31.
The aim of this study was to test a novel prototype optical sensor system for detection of flying insects. As a
proof-of-concept, we used machine learning to quantify the detection of OSR pests under controlled laboratory
conditions.
Results
We tested three different methods to automatically classify the insect groups, splitting the data into a training
set and a test set (Fig. 1): first we used the dominant frequency of the Fourier transformation, assuming that this
is the wingbeat frequency (WBF) of the insect, for direct comparison between insects (“WBF method”). This
assumption is correct for some cases, but could be wrong in some cases where the first harmonic is strongest.
In the “Features method” we used a Random Forest classifier to classify the groups32. In this method, several
other features of the signal were identified including second and third harmonics of the WBF and various ratios
between the s ignals29,32,33 (see Supplementary Table 1) and used for classification in decision tree models. Thirdly,
we fed the power spectra into a 3-layer Neural Network with rectifier (ReLU) activation f unctions34 implemented
in TensorFlow35 (“NN method”). For all methods, we used a one-vs-all approach, using a binary classifier clas-
sifying the events as “target” or “other”.
Accuracy. The accuracy of classification in the machine learning depends on the composition of the tested
population. In this study, sawflies (Hymenoptera) were easily distinguished from pod midges (Diptera), but it
was more difficult to differentiate pod midges (Diptera: Cecidomyiidae) from other midge species (Sciaridae:
Corynoptera sp. and Zygoneura sp.). Therefore, training was first conducted on all insect observations, and then
accuracy was obtained by classifying one group at a time. The reported accuracy, or the fraction of correctly clas-
sified events, is defined as the sum of true positives and true negative divided by the number of events (Fig. 2).
The presented result is the average of 100 randomized cross validation folds with random selection of 669 train-
ing data points, 333 targets + 336 others (42 of each the other eight species). The test set consisted of 450 data
points, (50 per species) randomly selected in each fold.
Performance. In Fig. 2, we present the lowest accuracy we reached when classifying each insect group
against the other groups, one at a time. Of the three methods tested, the NN method performed best when com-
Scientific Reports | (2021) 11:1555 | https://doi.org/10.1038/s41598-021-81005-0 2
Vol:.(1234567890)
www.nature.com/scientificreports/
Figure 2. Median classification accuracy (y axis) of one target insect species (x axis) against the most difficult
other species (that yielded the lowest average accuracy of 100 repetitions with randomly selected records). Thus,
these are the lowest accuracies possible in this study. The error bars show the 90% bootstrapping interval.
paring one target species with all other species and also when selecting the species with poorest accuracy (Fig. 2),
reaching up to 98% median in accuracy with sawflies as the target species. The relative accuracies between the
insect groups are presented in Fig. 3. The Features method was second best in all comparisons, and the WBF
method had the lowest accuracy in all comparisons. Specifically, the 90% bootstrapping interval (BI) of the NN
method was above the 90% BI of the other two methods for two species (Fig. 2). The NN method had 90% BI
interval above the median in four species compared to the Features method, and in seven species compared to
the WBF method. For comparison of specific species, the NN method had a higher average accuracy in 70 of
72 comparisons compared to the Features method and 66 out of 72 compared to the WBF method, with the
Features method having higher average accuracy in 46 comparisons out of 72 compared to the WBF method
(Supplementary Figure 1).
Discussion
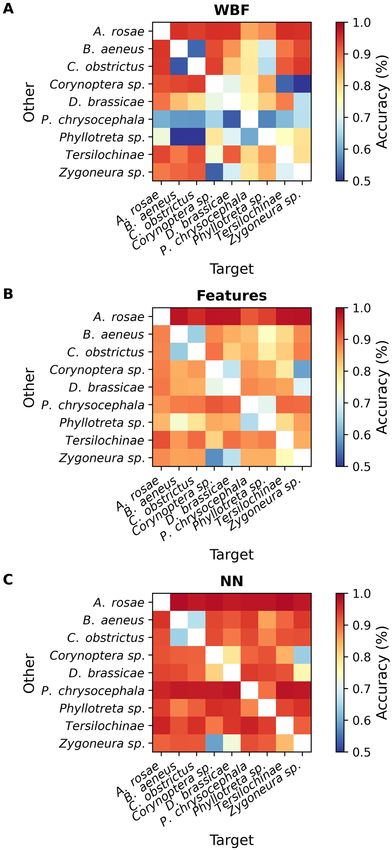
In Fig. 4, we show the WBF harmonics of the studied insects. For each insect, the left peak is the fundamental
(first order) harmonic (if present) and for most, the second order harmonic is also clear. Two groups stand out:
Phyllotreta spp. and P. chrysocephala due to their lack of WBF pattern. This is caused by jumping activity rather
than flight behaviour. Some of the groups have very similar WBF, which is apparent from the overlapping of
dominant frequencies (Fig. 4). This was more pronounced for the related species that have similar physical
appearance (e.g. Corynoptera sp. and Zygoneura sp midges). Therefore, including other features of the Fourier
transformed signal made the classification accuracy better. While extracted features sometimes are erroneous,
as previously mentioned where the second harmonic in the WBF spectra is chosen rather than the fundamental
frequency, the classifier learns the dual distribution of this feature and can still return a valid result. Overall,
similarity in appearance between species transferred to lower accuracy across all methods. However, the NN was
always better at detecting the groups in single events (Figs. 2 and 3). If the focus is on the insect population rather
than identification of single events, an estimate of the fraction of events belonging to a specific species could be
made by taking into account the accuracy of the training, which would increase the accuracy on a population
level. This will be considered in future work.
These results show that optical signals can be processed using machine learning to distinguish between
taxonomic groups of flying insects. This method is a valuable contribution to precision farming because it can
help detection of pests faster. Furthermore, it can be applied locally around on the field for rapid identification
of local hotspots of pests. In such a situation, the farmer can apply pesticides only where the pests are detected.
However, further studies to link ex-situ measurements with in-situ measurements are needed to validate that
the method will work in the field. Combined with other features such as modulation spectra and fluorescence,
remote insect recognition will likely be possible in the near future. However, challenges with variation between
individual insects, measurement periods and sites will have to be addressed. Furthermore, it will require careful
sorting signals and noise in order to develop a fast and reliable s ystem36. It will also need to take into account
that species without known signatures can be present in the study area. Therefore, a reliable algorithm must be
able to quantify the match between the signal and the database records, to measure the quality of the identifica-
tion. In the future, farmers could utilize the sensor and classification methods to precisely target application of
pesticide to areas and periods with confirmed pest activity and little pollinator activity.
Scientific Reports | (2021) 11:1555 | https://doi.org/10.1038/s41598-021-81005-0 3
Vol.:(0123456789)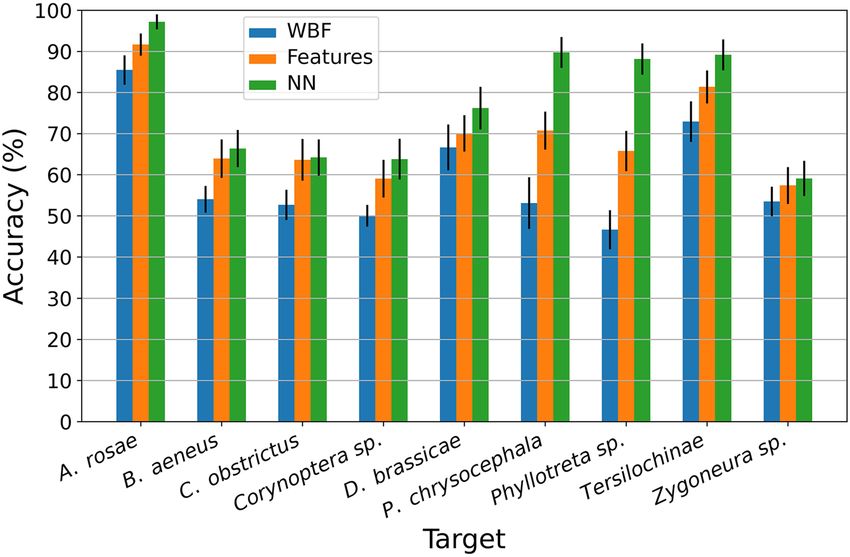
www.nature.com/scientificreports/

                                            Figure 3.  (A) Intensity plot of the average accuracy of the classification algorithms using one species as a
                                            target and training against a mix of the other species, then testing against specific other species using wing beat
                                            frequency as predictor. (B) Intensity plot of the average accuracy using one species as target and training against
                                            a mix of other species, then testing against specific other species. Here using extracted features as predictors. (C)
                                            Intensity plot of the average accuracy using one species as target and training against a mix of other species, then
                                            testing against specific other species. Here using a neural network (NN) to predict species.

          Scientific Reports |   (2021) 11:1555 |                https://doi.org/10.1038/s41598-021-81005-0                                                    4

Vol:.(1234567890)
www.nature.com/scientificreports/
Figure 4. Average spectra of the wing beat frequency signals for the tested insects, showing the harmonics for
each classified group. 1H first harmonic, 2H second harmonic, etc., exemplified for B. aeneus. The grey areas
show the interquartile range. The spectra were obtained by taking the average over all four channels (808 nm
and 1320 nm, co- and de-polarized signals).
Methods
Insects. In this study we targeted the analyses on nine species: the four major coleopteran pests of OSR
described above plus two additional minor pests—flea beetles Phyllotreta spp. and the turnip sawfly Athalia
rosae, two midge genera Corynoptera sp. and Zygoneura sp. as common non-target species found in OSR fields
and Tersilochine parasitic wasps of the pollen beetle (a mixture of Tersilochus heterocerus, Phradis interstitialis
and P. morionellus) as a model natural enemy group. All insects were collected and identified from April to
November in an OSR crop on Rothamsted farm (N 51.806146, E 0.359080), England. The most abundant live
insects were collected from a crop of oilseed rape (OSR) on Rothamsted Farm, Hertfordshire, UK using a com-
bination of sweep netting and Malaise trapping37 for pollen beetles (Brassicogethes aeneus), cabbage seed weevils
(Ceutorhynchus obstrictus), parasitoids of pollen beetles (Tersilochinae), flea beetles (Phyllotreta sp.), sawflies
(Athalia rosae), pod midges (Dasineura brassicae) and midges (Corynoptera sp. and Zygoneura sp.) and elec-
tronic aspirators were used to collect cabbage stem flea beetles (Psylliodes chrysocephala) at harvest. Collected
insects were generally identified live by eye with the exception of midges and parasitoids which were verified
after measurements using a binocular microscope. Collected insects were stored in mesh cages with young OSR
plants (for cabbage stem flea beetles and flea beetles) or flowering racemes (for cabbage seed weevils and pol-
len beetles) as food. Pod midges were kept in cages lined with wet s and38. Cages were maintained in controlled
environment conditions with temperature and Light:Dark regime specific to each insect, until the insects were
required for use. Midges, parasitoids and sawflies were generally used on the day of collection whereas the other
insects were kept for up to two weeks.
Measurement procedure. Insects were detected using a prototype optical sensor as shown in Supplemen-
tary Figure 1. The sensor transmits a Ø2″ collimated linearly polarized laser beam of both 808 nm and 980 nm,
with respective intensity of 1.6 and 3 mW/cm2. The backscattered light is collected using a focusing lens, a polar-
izing beam splitter and two dual-channel sandwich detectors. These constitute four individual channels with
co- and de-polarized light recorded separately for both wavelengths. The bandwidth was 5 kHz and sampling
frequency was 20 kHz. The measured power spectra are shown in Fig. 4. A similar system is described in more
detail in Gebru et al.29. Immediately prior to the optical measurements, test insects were housed in small groups
in ventilated plastic boxes (18 cm L × 12 cm W × 6 cm D).
Insects were released from the box on a raised platform positioned directly opposite a window (Supplemen-
tary Figure 2). The platform was maintained at the same height as the optical sensor ‘beam’ pointed parallel to the
window and in front of the release point. The release platform was contained in a Perspex box (60 × 60 × 60 cm)
Scientific Reports | (2021) 11:1555 | https://doi.org/10.1038/s41598-021-81005-0 5
Vol.:(0123456789)www.nature.com/scientificreports/
to prevent insects from escaping into the room. A hole was cut into the box at one end to allow the ‘beam’ of the
optical sensor into the box and a black panel was fixed onto the Perspex to increase the contrast of the signal
(Supplementary Figure 2). The lid was removed, and insects were allowed to fly out. As most insects fly towards
the light, the insects flew through the beam towards the window. The flight activity of each batch of insects was
recorded for 15 min. Insects were then collected from the Plexiglass box and a fresh batch of insects used. Meas-
urements were made over several days until around 1000 individual traces had been recorded for each group.
For each species, we obtained a minimum of 371 records that were used in the analyses.
Data analysis. Time-windows with individual insect recordings were automatically extracted by thresh-
olding the signal-to-noise-ratio at 10. Peaks above the threshold were eroded and dilated to filter out signal
segments that were too short, using the Python Scipy ndimage package along the time domain, as described by
Jansson39. The erosion removes peaks above the threshold shorter than 0.25 ms, remaining peaks are then dilated
by 40 ms to cover the initial and final part of the events. The 40 ms corresponds to a frequency resolution of only
50 Hz but the average length of the events used in this study was 85.6 ms corresponding to a frequency resolution
of 11.7 Hz. From the extracted events, multiple features were extracted as briefly described in the methods sec-
tion and according to Gebru et al.29. The recorded time signals were also Fourier transformed into the frequency
domain and zero padded to 20,000 data points (corresponding to 1 s in the time domain). The final data format,
used for classification with the neural network was achieved by down-sampling the absolute values of the Fou-
rier transforms below 1 kHz into 512 points and concatenating the individual channels together into a 1 × 2048
points vector. In the NN method, we used 3-layer neural network with ReLU activation functions implemented
in TensorFlow. The layer structure was 2000, 1500, 1000 nodes. The last layer gave a single output with a prob-
ability of belonging to the predicted class. We used a cross entropy loss function and optimized the network
weights using a standard Adam optimizer (adaptive momentum) and dropout rate of 0.5 on the last layer40, 41.
The extracted features for the Features method are listed in Supplementary Table 1. These were fed into the
decision tree algorithm32. The exact definition of all these features are described in detail in Gebru et al.29.
For the training of the different methods, 333 events were randomly selected from each target insect spe-
cies and 42 events from each of the other eight species (total 336 other insect events). For testing, 50 randomly
selected events from the target species and 50 from each other species were selected and a binary test was
performed to determine whether events belonged to the target group or not. Training and testing was repeated
100 times for each target species and each method (in total 2700 training sessions and 21,600 test sessions). The
composition of the training and test sets were randomized in each fold to cross-validate the results.
Comparison between methods when performing the test session 100 times (bootstrapping) was done by
determining whether the mean or median bootstrapped accuracy was within 90% of the bootstrapped accuracy
of another method. P-values were not reported because the number of repeats of the bootstrapping decides the
power of the c omparison42; equivalent to us being able to adjust the p-value by adjusting number of bootstraps.
Data availability
The datasets used and/or analysed during the current study are available from the corresponding author on
reasonable request.
Received: 16 March 2020; Accepted: 29 December 2020
References
1. Bianchi, F. J., Booij, C. J. H. & Tscharntke, T. Sustainable pest regulation in agricultural landscapes: A review on landscape com-
position, biodiversity and natural pest control. Proc. R. Soc. B 273(1595), 1715–1727 (2006).
2. Stanley, D. A., Gunning, D. & Stout, J. C. Pollinators and pollination of oilseed rape crops (Brassicanapus L.) in Ireland: Ecological
and economic incentives for pollinator conservation. J. Insect Conserv. 17, 1181–1189 (2013).
3. Boserup, E. The Conditions of Agricultural Growth: The Economics of Agrarian Change Under Population Pressure (Routledge,
London, 2017).
4. Edwards, C. A. (ed.) Environmental Pollution by Pesticides Vol. 3 (Springer Science and Business Media, New York, 2013).
5. Rundlöf, M. et al. Seed coating with a neonicotinoid insecticide negatively affects wild bees. Nature 521, 77–80 (2015).
6. Kim, K. H., Kabir, E. & Jahan, S. A. Exposure to pesticides and the associated human health effects. Sci. Total Environ. 575, 525–535
(2017).
7. Hallmann, C. A. et al. More than 75 percent decline over 27 years in total flying insect biomass in protected areas. PLoS ONE 12,
e0185809 (2017).
8. van Klink, R. et al. Meta-analysis reveals declines in terrestrial but increases in freshwater insect abundances. Science 368, 417–420
(2020).
9. Sánchez-Bayo, F. & Wyckhuys, K. A. Worldwide decline of the entomofauna: A review of its drivers. Biol. Conserv. 232, 8–27 (2019).
10. Vinnichek, L., Pogorelova, E. & Dergunov, A. Oilseed market: Global trends. In IOP Conference Series: Earth and Environmental
Science, Vol. 274, p. 012030 (IOP Publishing, 2019).
11. FAO. Faostat Database, Rome (2018).
12. Williams, I. H. The major insect pests of oilseed rape in Europe and their management: An overview. In Biocontrol-based Integrated
Management of Oilseed Rape Pests. 1–43 (Springer, Dordrecht, 2010).
13. Richardson, D. M. Summary of findings from a participant country pollen beetle questionnaire. EPPO Bull. 38, 68–72 (2008).
14. Nicholls, C. A review of AHDB impact assessments following the neonicotinoid seed treatment restrictions in winter oilseed rape.
AHDB Research Review, Vol. 84 (AHDB, Warwickshire, 2016).
15. Nilsson, C. Yield losses caused by cabbage stem flea beetle larvae. IOBC/WPRS Bull. 13, 53–55 (1990).
16. Nilsson, C. Yield losses in summer rape caused by pollen beetles (Meligethes aeneus). Swed. J. Agric. Res. 17, 105–111 (1987).
17. Fergusons, A. W. et al. The potential of decision support systems to improve risk assessment for pollen beetle management in
winter oilseed rape. Pest Manag. Sci. 72, 609–617 (2016).
Scientific Reports | (2021) 11:1555 | https://doi.org/10.1038/s41598-021-81005-0 6
Vol:.(1234567890)www.nature.com/scientificreports/
18. Skellern, M. P., Welham, S. J., Watts, N. P. & Cook, S. M. Meteorological and landscape influences on pollen beetle immigration
into oilseed rape crops. Agric. Ecosyst. Environ. 241, 150–159 (2017).
19. Johnen, A. et al. The proPlant decision support system: Phenological models for the major pests of oilseed rape and their key
parasitoids in Europe. In Biocontrol-based Integrated Management of Oilseed Rape Pests. 381–403 (Springer, Dordrecht, 2010).
20. Eliopoulos, P., Tatlas, N. A., Rigakis, I. & Potamitis, I. A “smart” trap device for detection of crawling insects and other arthropods
in urban environments. Electronics 7, 161 (2018).
21. Rigakis, I., Potamitis, I., Tatlas, N. A., Livadaras, I. & Ntalampiras, S. A multispectral backscattered light recorder of insects’
wingbeats. Electronics 8, 277 (2019).
22. Partel, V., Nunes, L., Stansly, P. & Ampatzidis, Y. Automated vision-based system for monitoring Asian citrus psyllid in orchards
utilizing artificial intelligence. Comput. Electron. Agric. 162, 328–336 (2019).
23. Malmqvist, E. et al. The bat–bird–bug battle: Daily flight activity of insects and their predators over a rice field revealed by high-
resolution Scheimpflug Lidar. R. Soc. Open Sci. 5, 172303 (2018).
24. Brydegaard, M. & Jansson, S. Advances in entomological laser radar. J. Eng. 2019, 7542–7545 (2019).
25. Potamitis, I., Eliopoulos, P. & Rigakis, I. Automated remote insect surveillance at a global scale and the internet of things. Robotics
6, 19 (2017).
26. Zhu, S. et al. Insect remote sensing using a polarization sensitive cw lidar system in Chinese rice fields. In EPJ Web of Conferences,
Vol. 176 (EDP Sciences, 2018).
27. Genoud, A. P., Basistyy, R., Williams, G. M. & Thomas, B. P. Optical remote sensing for monitoring flying mosquitoes, gender
identification and discussion on species identification. Appl. Phys. B 124, 46 (2018).
28. Tauc, M. J., Fristrup, K. M., Repasky, K. S. & Shaw, J. A. Field demonstration of a wing-beat modulation lidar for the 3D mapping
of flying insects. OSA Continuum, 2 (2019).
29. Gebru, A. et al. Multiband modulation spectroscopy for the determination of sex and species of mosquitoes in flight. J. Biophotonics
11, e201800014 (2018).
30. Jansson, S., Gebru, A., Ignell, R., Abbott, J. & Brydegaard, M. Correlation of mosquito wing-beat harmonics to aid in species clas-
sification and flight heading assessment. In Novel Biophotonics Techniques and Applications V, Vol. 11075, p. 110750Q (2019).
31. Kirkeby, C., Wellenreuther, M. & Brydegaard, M. Observations of movement dynamics of flying insects using high resolution lidar.
Sci. Rep. 6, 29083 (2016).
32. Pedregosa, F. G. et al. Scikit-learn: Machine learning in Python. J. Mach. Learn. Res. 12, 2825–2830 (2011).
33. Malmqvist, E., Jansson, S., Török, S. & Brydegaard, M. Effective parameterization of laser radar observations of atmospheric fauna.
IEEE J. Sel. Top. Quantum Electron. 22, 327–334 (2015).
34. Maas, A. L., Hannun, A. Y. & Ng, A. Y. Rectifier nonlinearities improve neural network acoustic models. In Proc. Icml., Vol. 30, p.
3 (2013).
35. Abadi, M. et al. TensorFlow: Large-scale machine learning on heterogeneous distributed systems. arXiv:1603.04467 (2016).
36. Lostanlen, V., Salamon, J., Farnsworth, A., Kelling, S. & Bello, J. P. Robust sound event detection in bioacoustic sensor networks.
PLoS ONE 14(10), e0214168 (2019).
37. Williams, I. H., Büchi, R. & Ulber, B. Sampling, trapping and rearing oilseed rape pests and their parasitoids. In Biocontrol of
Oilseed Rape Pests (ed. Alford, D. V.) 145–160 (Blackwell, Oxford, 2003).
38. Murchie, A. K. & Hume, K. D. Evidence for monogeny in the brassica pod midge Dasineura brassicae. Entomol. Exp. Appl. 107,
237–241 (2003).
39. Jansson, S. Entomological Lidar: Target Characterization and Field Applications. Doctoral dissertation, Lund University (2020).
40. Hinton, G. E., Srivastava, N., Krizhevsky, A., Sutskever, I. & Salakhutdinov, R. R. Improving neural networks by preventing co-
adaptation of feature detectors. arXiv :1207.0580 (2012).
41. Kingma, D. P. & Ba, J. Adam: A method for stochastic optimization. arXiv:1412.6980 (2014).
42. Brockhoff, P. B., Møller, J. K., Andersen, E. W., Bacher, P. & Christiansen, L. E. Introduction to Statistics. eNotes. https://02402
.compute.dtu.dk/enotes/book-IntroStatistics (2015).
Acknowledgements
This work was funded by BASF-Xarvio. Rothamsted Research receives grant-aided support from the UK Biologi-
cal and Biotechnical Research Council. Kaare Græsbøll and Carsten Kirkeby were funded by the Smart Innova-
tion grant from Scion DTU. Maja Olofsson created Supplementary Figure 1.
Author contributions
C.K. wrote the first draft of the manuscript. All authors participated in planning of the study and writing the
manuscript. K.R., S.M.C., A.S., M.T.T., J.L.S., J.P. and A.J. conducted the experiments. K.R., M.J., J.P. and K.G.
conducted the analyses. M.B. contributed to writing the methods and discussion of the results.
Competing interests
CK, KR, AS, JP, MJ and MB are or were (partly) affiliated with Faunaphotonics, the company that developed the
prototype sensor used in this study. All other authors do not have conflicting interests.
Additional information
Supplementary Information The online version contains supplementary material available at https://doi.
org/10.1038/s41598-021-81005-0.
Correspondence and requests for materials should be addressed to C.K.
Reprints and permissions information is available at www.nature.com/reprints.
Publisher’s note Springer Nature remains neutral with regard to jurisdictional claims in published maps and
institutional affiliations.
Scientific Reports | (2021) 11:1555 | https://doi.org/10.1038/s41598-021-81005-0 7
Vol.:(0123456789)www.nature.com/scientificreports/
Open Access This article is licensed under a Creative Commons Attribution 4.0 International
License, which permits use, sharing, adaptation, distribution and reproduction in any medium or
format, as long as you give appropriate credit to the original author(s) and the source, provide a link to the
Creative Commons licence, and indicate if changes were made. The images or other third party material in this
article are included in the article’s Creative Commons licence, unless indicated otherwise in a credit line to the
material. If material is not included in the article’s Creative Commons licence and your intended use is not
permitted by statutory regulation or exceeds the permitted use, you will need to obtain permission directly from
the copyright holder. To view a copy of this licence, visit http://creativecommons.org/licenses/by/4.0/.
© The Author(s) 2021
Scientific Reports | (2021) 11:1555 | https://doi.org/10.1038/s41598-021-81005-0 8
Vol:.(1234567890)You can also read