Early identification of postpartum depression using demographic, clinical, and digital phenotyping - Nature

Page created by Herman Greene
 
CONTINUE READING
Early identification of postpartum depression using demographic, clinical, and digital phenotyping - Nature
Hahn et al. Translational Psychiatry (2021)11:121
                                    https://doi.org/10.1038/s41398-021-01245-6                                                                                                     Translational Psychiatry

                                     ARTICLE                                                                                                                                                    Open Access

                                    Early identification of postpartum depression using
                                    demographic, clinical, and digital phenotyping
                                    Lisa Hahn1,2, Simon B. Eickhoff1,2, Ute Habel3,4, Elmar Stickeler5, Patricia Schnakenberg1,3, Tamme W. Goecke5,6,
                                    Susanne Stickel 3, Matthias Franz7, Juergen Dukart 1,2 and Natalia Chechko1,3

                                      Abstract
                                      Postpartum depression (PPD) and adjustment disorder (AD) affect up to 25% of women after childbirth. However,
                                      there are no accurate screening tools for either disorder to identify at-risk mothers and enable them to benefit from
                                      early intervention. Combinations of anamnestic, clinical, and remote assessments were evaluated for an early and
                                      accurate identification of PPD and AD. Two cohorts of mothers giving birth were included in the study (N = 308 and
                                      N = 193). At baseline, participants underwent a detailed sociodemographic-anamnestic and clinical interview. Remote
                                      assessments were collected over 12 weeks comprising mood and stress levels as well as depression and attachment
                                      scores. At 12 weeks postpartum, an experienced clinician assigned the participants to three distinct groups: women
                                      with PPD, women with AD, and healthy controls (HC). Combinations of these assessments were assessed for an early
                                      an accurate detection of PPD and AD in the first cohort and, after pre-registration, validated in a prospective second
                                      cohort. Combinations of postnatal depression, attachment (for AD) and mood scores at week 3 achieved balanced
                                      accuracies of 93 and 79% for differentiation of PPD and AD from HC in the validation cohort and balanced accuracies
                                      of 87 and 91% in the first cohort. Differentiation between AD and PPD, with a balanced accuracy of 73% was possible
                  1234567890():,;
1234567890():,;
                  1234567890():,;
1234567890():,;

                                      at week 6 based on mood levels only with a balanced accuracy of 73% in the validation cohort and a balanced
                                      accuracy of 76% in the first cohort. Combinations of in clinic and remote self-assessments allow for early and accurate
                                      detection of PPD and AD as early as three weeks postpartum, enabling early intervention to the benefit of both
                                      mothers and children.

                                    Introduction                                                                                        Maternal mental health is a reliable predictor of child’s
                                      The postpartum period poses the highest risk to women                                             cognitive development and subsequent achievements5.
                                    for developing a mental disorder1, with postpartum                                                  The risk of a mother-to-child transmission of the vul-
                                    depression (PPD) being the most frequent one2. PPD is                                               nerability to depression6,7, through genetic as well as
                                    defined as a major depressive disorder occurring in direct                                           other factors such as depression-related effects on par-
                                    relation (within 4 weeks postpartum) to childbirth in the                                           enting8, is particularly high. Successful treatment of
                                    DSM-53. Early diagnosis and treatment of PPD can sub-                                               maternal depression alleviates the risk of childhood
                                    stantially improve the outcome, prevent relapse, and                                                behavioral problems9.
                                    minimize the associated emotional and financial burden4.                                                PPD is often overlooked during postnatal visits, missing
                                                                                                                                        the critical window for early intervention10,11. One reason
                                                                                                                                        is that low mood in the early postpartum period is largely
                                    Correspondence: Juergen Dukart (juergen.dukart@gmail.com) or
                                                                                                                                        deemed “normal” with 50–80% of new mothers experi-
                                    Natalia Chechko (nchechko@ukaachen.de)
                                    1
                                     Institute of Neuroscience and Medicine, Brain & Behaviour (INM-7), Research                        encing initial sadness (i.e., postpartum blues), primarily
                                    Centre Jülich, Jülich, Germany
                                    2
                                                                                                                                        due to dramatically plunging hormone levels at parturi-
                                     Institute of Systems Neuroscience, Medical Faculty, Heinrich Heine University
                                                                                                                                        tion12. Adjustment disorder (AD) in reaction to post-
                                    Düsseldorf, Düsseldorf, Germany
                                    Full list of author information is available at the end of the article                              partum stress is another postpartum condition with
                                    These authors contributed equally: Juergen Dukart, Natalia Chechko

                                    © The Author(s) 2021
                                                        Open Access This article is licensed under a Creative Commons Attribution 4.0 International License, which permits use, sharing, adaptation, distribution and reproduction
                                                        in any medium or format, as long as you give appropriate credit to the original author(s) and the source, provide a link to the Creative Commons license, and indicate if
                                    changes were made. The images or other third party material in this article are included in the article’s Creative Commons license, unless indicated otherwise in a credit line to the material. If
                                    material is not included in the article’s Creative Commons license and your intended use is not permitted by statutory regulation or exceeds the permitted use, you will need to obtain
                                    permission directly from the copyright holder. To view a copy of this license, visit http://creativecommons.org/licenses/by/4.0/.
Early identification of postpartum depression using demographic, clinical, and digital phenotyping - Nature
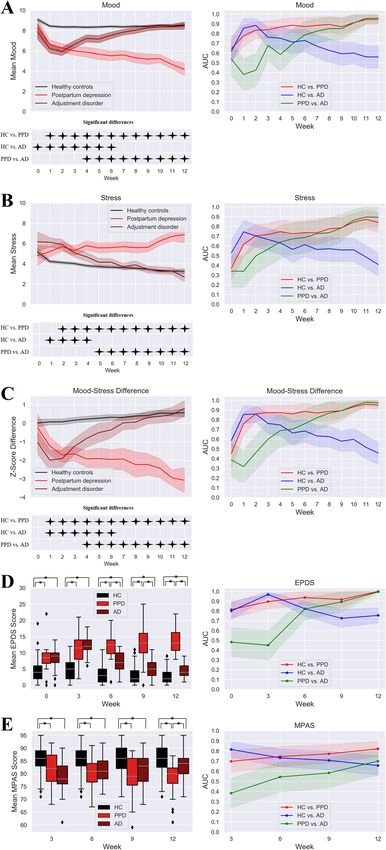
Hahn et al. Translational Psychiatry (2021)11:121                                                             Page 2 of 10

similar symptoms. The crucial difference to PPD is that        based on some exclusion criteria due to close collabora-
the severity of AD does not meet the criteria for depres-      tion with the obstetrics department) of which 50% were
sion at any time point. In the clinical context, AD needs to   willing to participate and met the inclusion criteria.
be considered as an important differential diagnosis           Written informed consent was obtained from all partici-
to PPD13.                                                      pants. The authors assert that all procedures contributing
  History of mental illness, vulnerability to hormonal         to this work comply with the ethical standards of the
changes, psychological and social distress, baby blues,        relevant national and institutional committees on human
premenstrual syndrome (PMS), unwanted pregnancy,               experimentation and with the Helsinki Declaration of
traumatic birth experience and stressful life events are all   1975, as revised in 2008. All procedures involving human
associated with an increased risk of PPD11,12,14. It is of     subjects/patients were approved by the Institutional
crucial importance to evaluate the relative and combined       Review Board of the Medical Faculty of RWTH Aachen
predictive value of these factors for development of PPD.      University (EK 208/15). The study design comprised
Previous studies aiming at prediction of PPD focused           follow-up for 12 weeks with evaluation at five time points
either on time points in the late postpartum period (e.g.,     each three weeks apart (T0-T4) (Fig. S1). Evaluations were
after 8–32 weeks)15 or only on single time points, thereby     conducted at the clinic for T0 and T4 and via remote
ignoring symptom dynamics or convolving PPD with               online questionnaires for T1 to T3. All women were asked
major depression or AD16. Detailed in-clinic assessments       to complete mood and stress assessments (scale from one
are costly and burdensome, providing the likely reason for     to ten, ten being high) online on a bi-daily basis. Remote
the cross-sectional nature of most previous studies.           assessments were sent via e-mail. If three consecutive
Online remote self-assessments may provide an easy             assessments were missed, a reminder was sent via e-mail,
means of obtaining the relevant information on symptom         which allowed for close monitoring of the participation.
dynamics in individual patients.                                 A clinical interview was conducted at T0 to ascertain
  Here, we recruited two cohorts of mothers giving birth       current conditions. At T4, an experienced psychiatrist
and followed them longitudinally over 12 weeks to              conducted a second clinical interview for a final diagnosis.
explore whether an accurate prediction of PPD is feasible      Based on this interview, participants were assigned into
based on socio-demographic and clinical-anamnestic             one of three groups: healthy controls (HC, N = 247,
information as well as early symptom dynamics using            80.2%) without any sign of depression during the whole
remote mood and stress assessments. Data from the first         observation period, and women meeting DSM-5 criteria
cohort were used to identify combinations of demo-             for PPD (N = 28, 9.1%) or AD (N = 33, 10.7%)3. In case of
graphic and clinical data achieving highest accuracy for       a depression, the Hamilton Depression Rating Scale17 was
early identification and differentiation of PPD and AD          administered. Clinical interviews were based on the
using a machine learning approach. In this cohort, we          DSM-53.
identified and trained the optimal model for individual           An sociodemographic-anamnestic questionnaire was
diagnostic prediction. The model and approach were pre-        used to obtain additional information about personal
registered and evaluated against an independent valida-        and socioeconomic status, psychiatric history, current
tion cohort to obtain unbiased performance estimates of        pregnancy, child, breastfeeding at T0, postpartum blues
the proposed algorithm.                                        (T4), PMS18 (T4), subjective quality of support at home
                                                               (T4), and breastfeeding at T4 (Table 1, Table S1). The
Methods                                                        Stressful Life Events Screening Questionnaire19 was
First cohort and study design                                  collected to assess encounter with stressful life events
  To identify the best predictors of PPD, a first cohort of     (T0) (Table 1). The Edinburgh Postnatal Depression
308 mothers (mean age = 31.7 ± 4.76) was recruited fol-        Scale (EPDS)20 was collected at all time points (T0-T4).
lowing childbirth at the University Hospital Aachen            Maternal attachment was evaluated from T1 through T4
between November 2015 and June 2018. The current               using the Maternal Postnatal Attachment Scale
project was part of the Risk of Postpartum Depression          (MPAS)21.
(RiPoD) study conducted at the University Hospital
Aachen. The main exclusion criteria were a depressive          Second cohort
episode (according to a clinical interview) at the time of       For the second cohort, further referred to as validation
recruitment and specific child health conditions (for           cohort, 193 mothers (mean age = 32.7 ± 4.78) were
details see supplementary material). The recruitment was       recruited between November 2018 and January 2020
conducted at the Department of Gynecology and Obste-           following the same protocol and study design as for the
trics within the first two to five days postpartum. Out of a     first cohort (Fig. S1). The prevalence rates in the valida-
total recruitment pool of ~1000 births per year, 50–60%        tion cohort were 76.2% for HC (N = 147), 8.29% for PPD
of women were contacted (30% were directly excluded            (N = 16), and 15.5% for AD (N = 30).
Table 1      Sociodemographic and anamnestic data for the first and second cohort.

Sociodemographic/anamnestic variable                          First cohort                                                               Second cohort

                                                              HC              PPD             AD                  Statistical test       HC            PPD           AD             Statistical test

Age (in years)                                                31.9 ± 4.61     30.4 ± 5.51     31.4 ± 5.09         X²(2, N= 308) = 2.60   33.1 ± 4.31   31.8 ± 7.04   31.5 ± 5.42    X²(2, N= 193) = 3.40
                                                              N = 247         N = 28          N = 33              p = .27                N = 146       N = 16        N = 30         p = 0.18
Education (years)                                             13.8 ± 2.89     12.4 ± 2.85     13.4 ± 4.67         X²(2, N= 300) = 3.04   14.6 ± 3.22   14.3 ± 2.96   14.08 ± 2.56   X²(2, N= 179) = 0.77
                                                              N = 240         N = 27          N = 33              p = 0.22               N = 139       N = 16        N = 26         p = 0.68
Personal psychiatric history (no/yes)                         220/27          16/12           19/14               X²(2, N= 308) = 34.5   118/26c       6/10          15/15          X²(2, N= 190) = 24.2
                                                                                                                              b,1,2                                                             b,1,2
                                                                                                                  p < 0.001                                                         p < 0.001
Familial psychiatric history (no/yes)                         194/53          16/12           18/15               X²(2, N= 308) = 13.3   112/33        8/8           65/14          X²(2, N= 193) = 10.8
                                                                                                                               b,1,2                                                             b,2
                                                                                                                  p = 0.001                                                         p = 0.005
                                                                                                                                                                                                           Hahn et al. Translational Psychiatry (2021)11:121

Birth complications (no/yes)                                  209/37          20/8            24/9                X²(2, N= 307) = 5.57   121/26        10/6          25/5           X²(2, N= 193) = 3.80
                                                                                                                  p = 0.062                                                         p = 0.15
                                                                                                                                                                                    a
Subjective birth-related psychological traumas (no/yes)       215/29          19/9            20/13               X²(2, N= 305) = 21.1   124/14        12/4          23/7
                                                                                                                              b,1,2
                                                                                                                  p < 0.001
PMS (no PMS/mild PMS/PMS)                                     111/84/29       4/12/12         7/16/10             X²(4, N= 285) = 27.9   83/44/14      3/4/8         9/14/6         X²(2, N= 185) = 26.6
                                                                                                                              b,1                                                               b,a
                                                                                                                  p < 0.001                                                         p < 0.001
                                                                                                                                                             c
Postpartum blues (no/yes)                                     151/93          8/20            7/26                X²(2, N= 305) = 27.7   102/45        0/16          9/21           X²(2, N= 193) = 39.4
                                                                                                                              b,1,2                                                             b,a
                                                                                                                  p < 0.001                                                         p < 0.001
Stressful life events
(number)                                                      0.81 ± 1.27     1.46 ± 1.71     1.19 ± 1.18                                1 ± 1.35      2.44 ± 2.06   1.97 ± 1.88
(no/yes)                                                      144/103         11/17           12/20               X²(2, N= 307) = 7.78   71/74         2/14          8/22           X²(2, N= 191) = 11.5
                                                                                                                                                                                                 b,1
                                                                                                                  p = 0.020                                                         p = 0.003
Breastfeeding T4 (no/yes)                                     63/182          14/14           8/25                X²(2, N= 306) = 7.62   41/96         9/7           9/20           X²(2, N= 182) = 4.56
                                                                                                                               b,1
                                                                                                                  p = 0.022                                                         p = 0.10
Hamilton Depression Rating Scale T4                           --              13.2 ± 2.88     --                                         --            14.6 ± 4.18   –              –
                                                                              N = 27                                                                   N = 16

AD adjustment disorder, HC healthy controls, PMS premenstrual syndrome, PPD postpartum depression.
a
  No statistical analysis possible due to low expected cell counts.
b                                                                                                          3
  Bonferroni-corrected significant difference (p < 0.05) between 1 HC and PPD, 2 between HC and AD and/or       between PPD and AD.
c
 Significant group difference (p < 0.05) between first and validation cohort.
                                                                                                                                                                                                               Page 3 of 10
Hahn et al. Translational Psychiatry (2021)11:121                                                             Page 4 of 10

Univariate analyses of the first cohort                          To identify the most sensitive combinations for
  All data were analyzed using MATLAB R2018a, Python         early identification of PPD, the following nine
Jupyter Notebook 5.6.0, IBM SPSS Statistics 22 and           feature combinations were evaluated: [1] baseline
jamovi 1.0.5.022. Chi-square tests were performed to         sociodemographic-anamnestic data alone, [2] mood
compare categorical sociodemographic-anamnestic vari-        scores, [3] stress scores, [4] mood-stress difference
ables across the groups in the first cohort. For continuous   scores, [5] mood scores incl. changes (change to base-
variables, logistic regressions were computed. Weekly        line and to preceding week), [6] stress scores incl.
mood and stress levels were calculated by averaging the      change scores, [7] mood-stress difference scores incl.
corresponding bi-daily assessments. Mood-stress differ-      changes, [8] combination of mood and stress scores
ence scores were calculated as the difference between        incl. changes, [9] and combination of mood, stress, and
both z-transformed variables to estimate individual dis-     mood-stress difference scores incl. changes. Combina-
crepancies between perceived stress and mood (i.e., z-       tions [1] to [9] were evaluated either alone or in com-
score mood minus z-score stress). Changes from baseline      bination with EPDS scores, MPAS scores or both. In
and the preceding week were computed for these vari-         addition, all combinations with features [2] to [9] were
ables. Dynamic changes in mood, stress, mood-stress          evaluated with and without inclusion of baseline
difference, MPAS, and EPDS were analyzed using mixed         sociodemographic-anamnestic information. The base-
effects repeated-measures analyses of variance (ANOVA)       line sociodemographic-anamnestic information alone
with week as within-subject and group as between-subject     (i.e., feature combination [1]) served as null model for
variable including an interaction term. Only post-hoc        comparison with best performing models.
pairwise group comparisons (i.e., chi-square tests for          Balanced accuracies, sensitivities, specificities, positive
categorical and binomial logistic regression for con-        and negative predictive values as well as ROC curves
tinuous sociodemographic-anamnestic variables, and           including the AUC were computed. The best performing
independent samples t tests for mixed effects repeated-      combination (high balanced accuracy at earliest possible
measures ANOVAs) were corrected for multiple testing         time-point) for each pair-wise comparison was selected
using Bonferroni correction. The sample size was calcu-      for replication analysis. A logistic regression was com-
lated as adequate for all univariate tests with a power of   puted for the selected combination using all participants.
0.8 and small to moderate effect sizes. Receiver operating   These results of the first cohort along with the validation
characteristic (ROC) curves and their associated area        plan were pre-registered on https://osf.io/ecmrp?
under the curve (AUC) (within-sample) for differentiation    view_only=6feb8e89818445a0b675621c8f22ba82.             The
between the three groups were computed for each mea-         obtained coefficients were applied to the prospectively
sure per week.                                               collected validation cohort.

Identification of most predictive combinations in the         Application to the validation cohort
first cohort                                                    The selected and preregistered model as trained on
  Next, we aimed to evaluate if and which combinations       the first dataset was then used to predict diagnoses in
of sociodemographic and clinical-anamnestic factors,         the independent validation cohort (Table S2). The class
mood, stress, MPAS and EPDS allow for an accurate            probability p for the validation cohort was obtained
differentiation between HC, PPD and AD in the first           using the following standard logistic regression formula,
cohort. To that end, we used a logistic regression           where β denotes the coefficients and X the included
classifier (MATLAB built-in mnrfit and mnrval func-            features:
tions, no parameter optimization needed) performing
1000 repetitions of strict threefold cross-validation. The               1
classification was performed for each pair-wise group             p¼
                                                                      1 þ eXβ
comparison separately and oversampling was applied to
the PPD and AD groups. Low-variance variables (family
status, breastfeeding T0, education, completed profes-
sional education, income, and psychiatric diagnosis in         As for the validation cohort, we computed balanced
previous pregnancy), i.e., variables with low group cell     accuracy, sensitivity, specificity, AUC, ROC, and positive
counts (less than 80% of expected cell counts >5), were      and negative predictive value by comparing predicted
excluded from the analysis in the whole sample (see          versus actual group labels. To obtain a chance level spread
Table 1 and Table S1). Independent samples t tests           estimate for the classifier, we randomly permuted the
were performed in the training data to select the            “predicted” labels 1000 times across the validation cohort
baseline variables to be included in the classifier           recomputing all performance measures and their 95%
(p < 0.05).                                                  confidence interval.
Hahn et al. Translational Psychiatry (2021)11:121                                                              Page 5 of 10

Results                                                         (T0-T4) (p < 0.001). The difference between PPD and AD
Sociodemographic-anamnestic and baseline group                  was significant from T2 until T4 with higher EPDS scores
comparisons                                                     in PPD women (p < 0.001). MPAS scores were sig-
  In the first cohort, PPD and AD were associated with           nificantly lower at all time points (T1–T4) in PPD (p <
personal (p < 0.001 for HC vs. PPD and HC vs. AD) and           0.001) and AD (p < 0.001 for T1-T3, p = 0.008 for T4)
familial psychiatric history (p = 0.036 for HC vs. PPD, p =     compared to HC. Lower MPAS scores were observed in
0.009 for HC vs. AD), subjective birth-related psycholo-        PPD compared to AD at T4 (p = 0.001).
gical traumas (p = 0.024 for HC vs. PPD, p < 0.001 for HC
vs. AD), and postpartum blues (p = 0.003 for HC vs. PPD,        Prediction in the first cohort
p < 0.001 for HC vs. AD) (Table 1, S1 and S2). A higher           Next, we evaluated which combinations of socio-
PMS prevalence (p = .012 for HC vs. PPD) and reduced            demographic-anamnestic, mood, stress, EPDS, and MPAS
breastfeeding at T4 were observed in PPD compared to            data allow for reliable differentiation between PPD, AD,
HC (p = 0.021). No differences were seen between PPD            and HC. The outcomes of all evaluated combinations are
and AD. Similar effects were observed in the validation         summarized in Tables S7–14. For differentiation of PPD
cohort for all sociodemographic-anamnestic factors              from HC, a high balanced accuracy of 87% was achieved at
(Table 1, Table S1; for odds ratios see Table S3).              week 3 using a combination of baseline EPDS and follow-
                                                                up EPDS and mood levels at week 3 (Table 2, Fig. 2A, and
Univariate analyses of the first cohort                          Table S7). The best early differentiation between AD and
  The average participation over a total of 84 days of          HC with a 91% balanced accuracy was also achieved at
observation was 40 responses with a maximum of 45               week 3 using a combination of baseline EPDS and follow-
responses, with no significant differences between the           up EPDS, MPAS and mood scores at week 3 (Table 2,
subsamples (HC: M = 40, max = 45; AD: M = 40, max =             Fig. 2B, and Table S8). A reasonable differentiation of AD
44; PPD: M = 40, max = 45; F(2, 305) = 0.33, p = 0.717).        and PPD with a balanced accuracy of 76% was only
Both PPD and AD showed a distinct pattern in weekly             achieved at week 6 using only the mood levels (Table 2,
mood, stress, and mood-stress difference scores over the        Fig. 2C, and Table S9). Logistic regression coefficients
course of 12 weeks (significant time by diagnosis inter-         were trained with these combinations using the first
actions – mood: F(13.8,1303) = 16.3, p < 0.001; stress: F       cohort and applied to predict the diagnostic labels in the
(11.3,1026) = 9.85, p < 0.001; mood-stress difference: F        validation cohort (Table S2). The null model (i.e.
(13.1,1162) = 17.3, p < 0.001) (Fig. 1A-C). The groups          sociodemographic-anamnestic information alone) per-
differed significantly in mood and mood-stress difference        formed inferior compared to the best performing models
at all weeks (p = 0.004 for mood-stress baseline, all other     for all group comparisons (HC-PPD: BA = 0.72, HC-AD:
p < 0.001) (see Tables S4 and S5). For stress, the difference   BA = 0.75, AD-PPD: BA = 0.48; Table S9, Feature
was significant at all weeks except for baseline (all p <        Combination 1).
0.001, see Table S6).
  PPD had significantly lower mood levels compared to            Prediction in the validation cohort
HC at all weeks except for baseline (Fig. 1A). AD had             The validation cohort had an average participation of 37
significantly lower mood relative to HC from baseline            responses with a maximum of 45 responses for the remote
until week 6 reaching the highest difference at week 2.         assessments with no differences between the subgroups
PPD had lower mood compared to AD from week 4                   (HC: M = 38, max = 45; AD: M = 38, max = 43; PPD:
through week 12. Stress levels were significantly higher in      M = 34, max =43; F(2, 190) = 1.51, p = 0.223). The
PPD compared to HC from week 2 through week 12 and              classifier trained on the first cohort for differentiation of
compared to AD between week 5 and week 12. AD had               HC and PPD reached a high balanced accuracy of 93% in
higher stress levels relative to HC from week 1 until week      the validation cohort with a sensitivity of 88% and spe-
4 (Fig. 1B). Mood-stress difference differed significantly       cificity of 99% (Table 2, Fig. 2D). The classifier differ-
between HC and PPD from week 1 through week 12,                 entiating HC and AD reached a balanced accuracy of 79%
between HC and AD from week 1 through week 6, and               with a high specificity (98%) but only moderate sensitivity
between PPD and AD from week 4 through week 12                  (60%) (Table 2, Fig. 2E). For PPD and AD differentiation,
(Fig. 1C).                                                      the selected classifier reached a balanced accuracy of 73%,
  Both EPDS and MPAS showed significant time by                  again with high specificity (90%) but only low sensitivity
diagnosis interactions (EPDS: F(6.87,1034) = 34.4, p <          (56%) (Table 2, Fig. 2F).
0.001; MPAS: F(5.35,805) = 8.24, p < 0.001) with a sig-
nificant between-group difference at all weeks (all p <          Discussion
0.001) (Fig. 1D, E). EPDS scores were significantly lower          Here, we adopted a within- and out-of-sample valida-
in HC compared to PPD and AD at all time-points                 tion study design to identify combinations of
Hahn et al. Translational Psychiatry (2021)11:121                                                                                    Page 6 of 10

 Fig. 1 Mood, stress, mood-stress difference, EPDS, and MPAS scores. Weekly mood (A), stress, (B) and mood-stress difference scores (C) incl. 95%
 confidence intervals, results of the simple effects analyses, and within-sample AUCs incl. 95% confidence interval for each group comparison. EPDS
 (D) and MPAS (E) mean scores and associated within-sample AUCs for each time point and group separately incl. their standard error and 95%
 confidence interval. Statistically significant t tests for group comparisons are marked with *.
Hahn et al. Translational Psychiatry (2021)11:121                                                                                                                                                                                                                                                                                                                                                                                                                                                                                                   Page 7 of 10

                                                                         Chance (95% CI)

                                                                                                                                                                                                                                                                Balanced accuracy, sensitivity, specificity, positive and negative predictive value obtained for the validation cohort (out-of-sample validation). For comparison, results of the first cohort aside with chance-level classification
                                                                                                                                                                                                                                                                                                                                                                                                                                                                                                     sociodemographic-anamnestic and clinical factors allow-

                                                                                                                             0.50 (0.35; 0.67)

                                                                                                                                                            0.28 (0.07; 0.50)
                                                                                                                                                                                0.73 (0.63; 0.83)
                                                                                                                                                                                                    0.32 (0.08; 0.58)
                                                                                                                                                                                                                        0.68 (0.59; 0.78)
                                                                                                                                                                                                                                            0.50 (0.31; 0.68)
                                                                                                                                                                                                                                                                                                                                                                                                                                                                                                     ing for early and accurate identification and differentia-
                                                                                                                                                                                                                                                                                                                                                                                                                                                                                                     tion of PPD and AD in two large cohorts of postpartum
                                                                                                                                                                                                                                                                                                                                                                                                                                                                                                     women. In both cohorts high accuracy was achieved at
                                                                                                                                                                                                                                                                                                                                                                                                                                                                                                     week 3 for identification of PPD and AD compared to HC
                                                                                                                                                                                                                                                                                                                                                                                                                                                                                                     using a simple combination of EPDS, mood, and MPAS
                                                                         Out-of-sample

                                                                                                                                                                                                                                                                                                                                                                                                                                                                                                     (for AD) assessments. In contrast, differentiation of PPD
                                                                                                              validation

                                                                                                                                                                                                                                                                                                                                                                                                                                                                                                     and AD was possible only from week 6 based solely on

                                                                                                                                                                                                                                                                AD adjustment disorder, AUC area under the curve, CI confidence interval, HC healthy controls, PPD postpartum depression, PPV positive predictive value, NPV negative predictive value.
                                                                                                                                                                                                                                                                                                                                                                                                                                                                                                     mood levels.
                                                                                                                             0.73

                                                                                                                                                            0.56
                                                                                                                                                                                0.90
                                                                                                                                                                                                    0.75
                                                                                                                                                                                                                        0.79
                                                                                                                                                                                                                                            0.88
                                                                                                                                                                                                                                                                                                                                                                                                                                                                                                        In both cohorts, the prevalence of PPD was slightly
                                                                                                                                                                                                                                                                                                                                                                                                                                                                                                     lower than the 10–20 % reported in the literature23,24. As
                                                                                                                                                                                                                                                                                                                                                                                                                                                                                                     the focus of our study was on prediction of PPD, we
                                                                         Chance (95% CI) Cross-validation

                                                                                                                                                                                                                                                                                                                                                                                                                                                                                                     purposely excluded women with manifest depression at
                                                                                                              (1st cohort)
                                                            PPD vs. AD

                                                                                                                                                                                                                                                                                                                                                                                                                                                                                                     the time of inclusion in the study, which may explain the
                                                                                                                                                                                                                                                                                                                                                                                                                                                                                                     lower prevalence. Furthermore, studies estimating early
                                                                                                                             0.76

                                                                                                                                                            0.76
                                                                                                                                                                                0.76
                                                                                                                                                                                                    0.66
                                                                                                                                                                                                                        0.79
                                                                                                                                                                                                                                            0.79

                                                                                                                                                                                                                                                                                                                                                                                                                                                                                                     prevalence of PPD may have included women with AD.
                                                                                                                                                                                                                                                                                                                                                                                                                                                                                                     Although there is an increased risk for PPD within the
                                                                                                                                                                                                                                                                                                                                                                                                                                                                                                     first postpartum year25, meaning that some women may
                                                                                                                             0.50 (0.45; 0.57)

                                                                                                                                                            0.12 (0.03; 0.23)
                                                                                                                                                                                0.88 (0.86; 0.90)
                                                                                                                                                                                                    0.18 (0.05; 0.33)
                                                                                                                                                                                                                        0.83 (0.81; 0.85)
                                                                                                                                                                                                                                            0.50 (0.39; 0.62)

                                                                                                                                                                                                                                                                                                                                                                                                                                                                                                     develop PPD after four to six weeks (i.e. late onset), this
                                                                                                                                                                                                                                                                                                                                                                                                                                                                                                     was not the case for our sample. In line with previous
                                                                                                                                                                                                                                                                                                                                                                                                                                                                                                     research, we found postpartum blues, psychiatric history,
                                                                                                                                                                                                                                                                                                                                                                                                                                                                                                     subjective birth-related psychological traumas, and PMS
                                                                                                                                                                                                                                                                                                                                                                                                                                                                                                     to be significant risk factors for PPD14,26,27.
                                                                         Out-of-sample

                                                                                                                                                                                                                                                                                                                                                                                                                                                                                                        Interestingly, no differences between the PPD and AD
                                                                                                              validation

                                                                                                                                                                                                                                                                                                                                                                                                                                                                                                     groups were found with respect to risk factors, suggesting
                                                                                                                                                                                                                                                                                                                                                                                                                                                                                                     that similar mechanisms may be involved in the genera-
                                                                                                                             0.79

                                                                                                                                                            0.60
                                                                                                                                                                                0.98
                                                                                                                                                                                                    0.86
                                                                                                                                                                                                                        0.92
                                                                                                                                                                                                                                            0.92

                                                                                                                                                                                                                                                                                                                                                                                                                                                                                                     tion of initial depressive symptoms in both groups. Over
                                                                                                                                                                                                                                                                                                                                                                                                                                                                                                     the observation period, stress levels continuously
                                                                         Chance (95% CI) Cross-validation

                                                                                                                                                                                                                                                                                                                                                                                                                                                                                                     increased in women with PPD whilst they normalized
                                                                                                                                                                                                                                                                                                                                                                                                                                                                                                     after about five weeks in AD. Descriptively, mood levels in
                                                                                                            (1st cohort)
                                                            HC vs. AD

                                                                                                                                                                                                                                                                                                                                                                                                                                                                                                     AD followed the stress levels normalizing only after about
                                                                                                                                                                                                                                                                                                                                                                                                                                                                                                     seven weeks. The temporal delay is in line with the
                                                                                                                             0.91

                                                                                                                                                            0.88
                                                                                                                                                                                0.94
                                                                                                                                                                                                    0.66
                                                                                                                                                                                                                        0.98
                                                                                                                                                                                                                                            0.97
Results of prediction for the first and validation cohort.

                                                                                                                                                                                                                                                                                                                                                                                                                                                                                                     interpretation that reductions in stress may contribute to
                                                                                                                                                                                                                                                                                                                                                                                                                                                                                                     the recovery observed in mood. The increase in stress
                                                                                                                             0.50 (0.44; 0.59)

                                                                                                                                                            0.11 (0.00; 0.27)
                                                                                                                                                                                0.90 (0.89; 0.92)
                                                                                                                                                                                                    0.10 (0.00; 0.25)
                                                                                                                                                                                                                        0.91 (0.89; 0.92)
                                                                                                                                                                                                                                            0.50 (0.34; 0.65)

                                                                                                                                                                                                                                                                                                                                                                                                                                                                                                     levels and the simultaneous decline in mood levels in PPD
                                                                                                                                                                                                                                                                                                                                                                                                                                                                                                     may indicate the contribution of stress-mediated com-
                                                                                                                                                                                                                                                                                                                                                                                                                                                                                                     ponents in line with previous studies reporting parenting
                                                                                                                                                                                                                                                                                                                                                                                                                                                                                                     stress among the most important postpartum factors28,29.
                                                                                                                                                                                                                                                                                                                                                                                                                                                                                                     Whilst not a causal factor on its own, parenting stress is
                                                                                                                                                                                                                                                                                                                                                                                                                                                                                                     likely to increase vulnerability to depression in high-risk
                                                                         Out-of-sample

                                                                                                                                                                                                                                                                                                                                                                                                                                                                                                     individuals.
                                                                                                              validation

                                                                                                                                                                                                                                                                                                                                                                                                                                                                                                        Similarly, PPD and AD displayed distinct temporal
                                                                                                                                                                                                                                                                                                                                                                                                                                                                                                     courses of EPDS and attachment scores as measured by
                                                                                                                             0.93

                                                                                                                                                            0.88
                                                                                                                                                                                0.99
                                                                                                                                                                                                    0.88
                                                                                                                                                                                                                        0.99
                                                                                                                                                                                                                                            0.98

                                                                                                                                                                                                                                                                for the validation cohort are also reported.

                                                                                                                                                                                                                                                                                                                                                                                                                                                                                                     MPAS. The EPDS temporal dynamics were highly similar
                                                                                                                                                                                                                                                                                                                                                                                                                                                                                                     to the observed stress and mood levels. The initially
                                                                         Cross-validation

                                                                                                                                                                                                                                                                                                                                                                                                                                                                                                     lowest attachment scores were found to increase in AD
                                                                                                              (1st cohort)
                                                            HC vs. PPD

                                                                                                                                                                                                                                                                                                                                                                                                                                                                                                     while PPD maintained the low attachment levels
                                                                                                                                                                                                                                                                                                                                                                                                                                                                                                     throughout the study. These observations underscore the
                                                                                                                                                                                                                                                                                                                                                                                                                                                                                                     necessity of longitudinal monitoring of both measures to
                                                                                                                             0.87

                                                                                                                                                            0.85
                                                                                                                                                                                0.89
                                                                                                                                                                                                    0.45
                                                                                                                                                                                                                        0.98
                                                                                                                                                                                                                                            0.91

                                                                                                                                                                                                                                                                                                                                                                                                                                                                                                     better characterize the dynamic relationship between
                                                                                                                                                                                                                                                                                                                                                                                                                                                                                                     depressed mood and maternal attachment30,31. Differ-
                                                                                                                                                                                Specificity
                                                                                                                                                            Sensitivity

                                                                                                                                                                                                                                                                                                                                                                                                                                                                                                     ences in MPAS and EPDS remained significant between
          Table 2

                                                                                                                             Balanced
                                                                                                                                                 accuracy

                                                                                                                                                                                                                                                                                                                                                                                                                                                                                                     AD and HC at all time points. According to recent find-
                                                                                                                                                                                                                                            AUC
                                                                                                                                                                                                                        NPV
                                                                                                                                                                                                    PPV

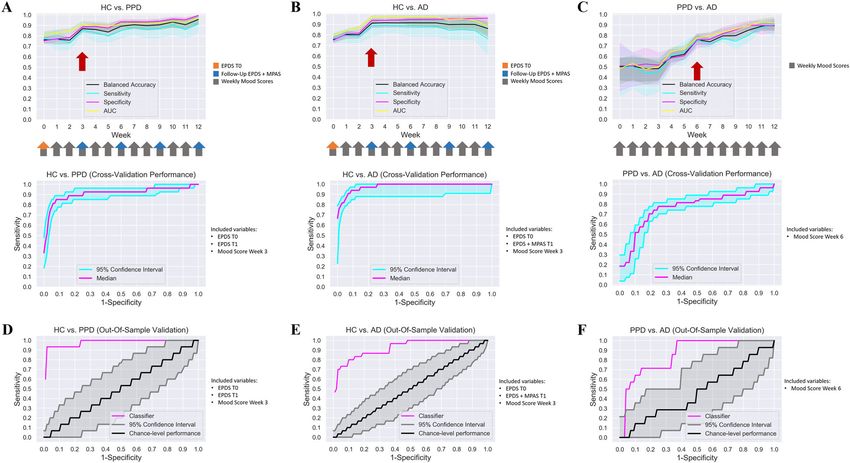
                                                                                                                                                                                                                                                                                                                                                                                                                                                                                                     ings, child neurodevelopment is affected by maternal
Hahn et al. Translational Psychiatry (2021)11:121                                                                                        Page 8 of 10

 Fig. 2 Results of machine learning analysis. Balanced accuracy, sensitivity, specificity and out-of-sample AUC for each group comparison are
 displayed for the first cohort (A–C). For HC vs. PPD (A), the values are displayed for EPDS at baseline and follow-up incl. mood scores. For HC vs. AD
 (B), the values are displayed for EPDS at baseline, EPDS and MPAS at follow-up incl. mood scores. For PPD vs. AD (C), the values are displayed for
 mood scores. (D–F) AUCs obtained for the validation cohort are displayed for the classifier selected based on results from the first cohort aside with
 chance-level performance.

depressive symptoms even when they do not exceed                             between PPD and AD. In particular, the addition of mood
clinical thresholds32,33. Our observations emphasize the                     scores led to a substantial increase in balanced accuracies
need for further detailed evaluation of potential con-                       for all group differentiations compared to all other feature
sequences also for the AD group.                                             combinations (e.g., addition of stress scores). Interest-
  A combination of baseline EPDS and week 3 remote                           ingly, the classifiers performed superior for the out-of-
follow-up EPDS, and mood scores achieved about 90%                           sample prediction in several cases. As we applied a strict
balanced accuracy for early identification of PPD as                          cross-validation procedure the differences in prediction
compared to HC. The same combination with addition of                        may simply reflect random variation in the accuracy of
MPAS achieved a similar accuracy for early identification                     our model.
of AD. Both findings were largely confirmed in the vali-                         Three potential limitations need to be mentioned. First,
dation cohort with an accuracy reduction from 90 to 80%                      as we did not register the reason for refusal during
seen only for differentiation of AD and HC. None of the                      recruitment, we cannot exclude a bias based on the dif-
evaluated combinations allowed for an accurate early                         ferences between women willing and women unwilling to
differentiation between PPD and AD with all classifiers                       participate. However, according to a recent study, there
performing close to chance level until week 5. A reason-                     are no differences in motivation and willingness to par-
able differentiation of both groups was only achieved                        ticipate between healthy controls and patients with psy-
through mood scores at week 6 with a moderately high                         chiatric mood disorders34. Therefore, we do not expect
accuracy but a high specificity for PPD as confirmed in the                    any significant bias regarding the exclusion of women
validation cohort. Our classification results suggest that a                  with PPD or AD based on their refusal to participate in
simple stepwise procedure including remote mood, EPDS,                       the study. A potential bias introduced by the recruitment
and MPAS assessments may be a promising approach                             after childbirth vs. before childbirth may be a second
towards early identification of PPD. Whilst week 3 remote                     limitation. However, the main goal of the current study
testing provided a high accuracy and a particularly high                     was the identification of a risk group through a method,
specificity for detection of both populations at risk, week 6                 which could be easily applied in routine care. Prediction
data additionally allowed for further differentiation                        before childbirth may be more difficult to incorporate into
Hahn et al. Translational Psychiatry (2021)11:121                                                                                                         Page 9 of 10

routine care as it may require the transfer of information                           Publisher’s note
between multiple institutions (e.g. gynecologist and hos-                            Springer Nature remains neutral with regard to jurisdictional claims in
                                                                                     published maps and institutional affiliations.
pital). Third, oversampling was applied only to the cross-
validation in the first cohort, but not to the training of the                        Supplementary information The online version contains supplementary
classifier for prediction in the validation cohort, resulting                         material available at https://doi.org/10.1038/s41398-021-01245-6.
in a potential bias of the logistic regression classifier due
                                                                                     Received: 26 June 2020 Revised: 6 January 2021 Accepted: 21 January 2021
to asymmetric group sizes. However, considering that the
highly similar results for the cross-validation and the out-
of-sample (with the out-of-sample validation results being
even superior at times), these findings indicate a minor                              References
influence of the asymmetric group sizes on the outcomes                                1. Munk-Olsen, T., Laursen, T. M., Pedersen, C. B., Mors, O. & Mortensen, P. B. New
of our study.                                                                             parents and mental disorders: a population-based register study. JAMA 296,
                                                                                          2582–2589 (2006).
  In summary, by means of a longitudinal approach we                                  2. Stewart, D. E. et al. Postpartum depression: Literature review of risk factors and
identify and validate combinations of remote assessments                                  interventions. Tor. Univ. Health Netw. Women’s Health Program Tor. Public
allowing for early and accurate identification and differ-                                 Health 1–289 (2003).
                                                                                      3. American PsychiatricAssociation. Diagnostic and statistical manual of mental
entiation of PPD and AD using a step-wise procedure. By                                   disorders (DSM-5®). (American Psychiatric Pub, 2013).
administering the EPDS and mood assessments in-clinic                                 4. Halfin, A. Depression: the benefits of early and appropriate treatment. Am. J.
immediately after childbirth and a second assessment                                      Manag. Care 13, S92–S97 (2007).
                                                                                      5. Shen, H. et al. Associations of parental depression with child school perfor-
remotely after three weeks, these findings can be easily                                   mance at age 16 years in Sweden. JAMA Psychiatry 73, 239–246 (2016).
translated into routine care. The behavioral and clinical                             6. Weissman, M. M. et al. Offspring of depressed parents: 20 years later. Am. J.
time courses over 12 weeks provided important insight                                     Psychiatry 163, 1001–1008 (2006).
                                                                                      7. Pearson, R. M. et al. Maternal perinatal mental health and offspring academic
into the development and interaction of mood, stress, and                                 achievement at age 16: the mediating role of childhood executive function. J.
maternal sensitivity in the first weeks postpartum.                                        Child Psychol. Psychiatry 57, 491–501 (2016).
                                                                                      8. Yang, J. et al. Effects of parental emotional warmth on the relationship
Funding                                                                                   between regional gray matter volume and depression-related personality
The study was supported by the DFG (Grant number: 410314797). NC was                      traits. Soc. Neurosci. 12, 337–348 (2017).
supported by the Clinical Scientist Program (rotation program) of the medical         9. Weissman, M. M. et al. Treatment of maternal depression in a medi-
faculty RWTH, Aachen (2015–2017). S.B.E. was supported by the European                    cation clinical trial and its effect on children. Am. J. Psychiatry 172,
Union’s Horizon 2020 Research and Innovation Programme under Grant                        450–459 (2015).
Agreement No. 785907 (HBP SGA2). Open Access funding enabled and                     10. O’Hara, M. W. Postpartum depression: what we know. J. Clin. Psychol. 65,
organized by Projekt DEAL.                                                               1258–1269 (2009).
                                                                                     11. O’Hara, M. W. & McCabe, J. E. Postpartum depression: current status and future
Author details                                                                           directions. Annu. Rev. Clin. Psychol. 9, 379–407 (2013).
1
 Institute of Neuroscience and Medicine, Brain & Behaviour (INM-7), Research         12. Galea, L. A. & Frokjaer, V. G. Perinatal depression: embracing variability toward
Centre Jülich, Jülich, Germany. 2Institute of Systems Neuroscience, Medical              better treatment and outcomes. Neuron 102, 13–16 (2019).
Faculty, Heinrich Heine University Düsseldorf, Düsseldorf, Germany.                  13. Schipper-Kochems, S. et al. Postpartum depressive disorder–psychosomatic
3
 Department of Psychiatry, Psychotherapy and Psychosomatics, Medical                     aspects. Geburtshilfe Frauenheilkd. 79, 375–381 (2019).
Faculty, Uniklinik RWTH Aachen University, Aachen, Germany. 4Institute of            14. Buttner, M. M. et al. Examination of premenstrual symptoms as a risk factor for
Neuroscience and Medicine, Brain Structure Function Relationship (INM-10),               depression in postpartum women. Arch. Women’s Ment. Health 16, 219–225 (2013).
Research Centre Jülich, Jülich, Germany. 5Department of Gynecology and               15. Tortajada, S. et al. Prediction of postpartum depression using multilayer per-
Obstetrics, Medical Faculty, Uniklinik RWTH Aachen University, Aachen,                   ceptrons and pruning. Methods Inf. Med. 48, 291–298 (2009).
Germany. 6Department of Obstetrics, RoMed Hospital Rosenheim, Rosenheim,             16. Jiménez-Serrano, S., Tortajada, S. & García-Gómez, J. M. A mobile health
Germany. 7Clinical Institute of Psychosomatic Medicine and Psychotherapy,                application to predict postpartum depression based on machine learning.
Medical Faculty, Heinrich-Heine-Universität Düsseldorf, Düsseldorf, Germany              Telemed. E-Health 21, 567–574 (2015).
                                                                                     17. Hamilton, M. A rating scale for depression. J. Neurol. Neurosurg. Psychiatry 23,
                                                                                         56 (1960).
Author contributions
                                                                                     18. Steiner, M., Haskett, R. F. & Carroll, B. J. Premenstrual tension syndrome: the
L.H. performed all analyses and wrote the manuscript. S.B.E., N.C., and J.D.
                                                                                         development of research diagnostic criteria and new rating scales. Acta Psy-
designed the overall study. N.C., P.S., U.H., E.S., T.W.G., and S.S. conducted the
                                                                                         chiatr. Scand. 62, 177–190 (1980).
clinical studies. All authors reviewed and commented on the manuscript.
                                                                                     19. Goodman, L. A., Corcoran, C., Turner, K., Yuan, N. & Green, B. L. Assessing
                                                                                         traumatic event exposure: general issues and preliminary findings for the
Data availability                                                                        stressful life events screening questionnaire. J. Trauma. Stress. Publ. Int. Soc.
The data of this study are not publicly available due to privacy and ethical             Trauma. Stress Stud. 11, 521–542 (1998).
restrictions. Data to support the findings of this study are available upon           20. Bergant, A. M., Nguyen, T., Heim, K., Ulmer, H. & Dapunt, O. German language
reasonable request.                                                                      version and validation of the Edinburgh postnatal depression scale. Dtsch.
                                                                                         Med. Wochenschr. 1946 123, 35–40 (1998).
Code availability                                                                    21. Condon, J. T. & Corkindale, C. J. The assessment of parent-to-infant attach-
The computer code used for the prediction analysis is available upon                     ment: Development of a self-report questionnaire instrument. J. Reprod. Infant
reasonable request.                                                                      Psychol. 16, 57–76 (1998).
                                                                                     22. The jamovi project (2020). jamovi (Version 1.2) [Computer Software]. Retrieved
Conflict of interest                                                                      from https://www.jamovi.org.
J.D. is a former employee and current consultant for F.Hoffmann-La Roche. All        23. Anokye, R., Acheampong, E., Budu-Ainooson, A., Obeng, E. I. & Akwasi, A. G.
authors report no conflicts of interest with respect to the work presented in             Prevalence of postpartum depression and interventions utilized for its man-
this study.                                                                              agement. Ann. Gen. Psychiatry 17, 18 (2018).
Hahn et al. Translational Psychiatry (2021)11:121                                                                                                      Page 10 of 10

24. Hahn-Holbrook, J., Cornwell-Hinrichs, T. & Anaya, I. Economic and health           30. Akman, İ. et al. Breastfeeding duration and postpartum psychological
    predictors of national postpartum depression prevalence: a systematic review,          adjustment: role of maternal attachment styles. J. Paediatr. Child Health 44,
    meta-analysis, and meta-regression of 291 studies from 56 countries. Front.            369–373 (2008).
    Psychiatry 8, 248 (2018).                                                          31. Mason, Z. S., Briggs, R. D. & Silver, E. J. Maternal attachment
25. Stowe, Z. N., Hostetter, A. L. & Newport, D. J. The onset of postpartum                feelings mediate between maternal reports of depression, infant
    depression: Implications for clinical screening in obstetrical and primary care.       social–emotional development, and parenting stress. J. Reprod. Infant
    Am. J. Obstet. Gynecol. 192, 522–526 (2005).                                           Psychol. 29, 382–394 (2011).
26. Beck, C. T. Predictors of postpartum depression: an update. Nurs. Res. 50,         32. Goodman, S. H. et al. Maternal depression and child psychopathology:
    275–285 (2001).                                                                        A meta-analytic review. Clin. Child Fam. Psychol. Rev. 14,
27. O’Hara, M. W. & Swain, A. M. Rates and risk of postpartum depression—a                 1–27 (2011).
    meta-analysis. Int. Rev. Psychiatry 8, 37–54 (1996).                               33. Evans, J. et al. The timing of maternal depressive symptoms and child cog-
28. Venkatesh, K. K., Phipps, M. G., Triche, E. W. & Zlotnick, C. The relationship         nitive development: a longitudinal study. J. Child Psychol. Psychiatry
    between parental stress and postpartum depression among adolescent                     53, 632–640 (2012).
    mothers enrolled in a randomized controlled prevention trial. Matern. Child        34. Morán-Sánchez, I., Maurandi-López, A. & Pérez-Cárceles, M. D. Assessment of
    Health J. 18, 1532–1539 (2014).                                                        motivations and willingness to participate in research of outpatients with
29. Leigh, B. & Milgrom, J. Risk factors for antenatal depression, postnatal               anxiety, mood, and psychotic disorders. J. Empir. Res. Hum. Res. Ethics 13,
    depression and parenting stress. BMC Psychiatry 8, 24 (2008).                          546–560 (2018).
You can also read