Ecological Connectivity Networks for Multi-dispersal Scenarios Using UNICOR Analysis in Luohe Region, China - gis.Point
←
→
Page content transcription
If your browser does not render page correctly, please read the page content below
230                                                                                              Full Paper

Ecological Connectivity Networks for Multi-dispersal
Scenarios Using UNICOR Analysis in Luohe Region,
China
Guifang Wang1, Samuel A. Cushman2, Ho Yi Wan3, Huawei Li4,5, Zita Szabó5,
Dongge Ning5, Sándor Jombach5
1Institute of Landscape Architecture, Urban Planning and Garden Art, Hungarian University of
Agriculture and Life Sciences, Budapest/Hungary · wgf0317@163.com
2USDA Forest Service, Rocky Mountain Research Station, AZ/USA
3Department of Wildlife, Humboldt State University, CA/USA
4Department of Landscape Architecture, Henan Agricultural University, Zhengzhou/China
5Institute of Landscape Architecture, Urban Planning and Garden Art, Hungarian University of Agri-

culture and Life Sciences, Budapest/Hungary

Abstract: Habitat loss and fragmentation are increasingly disrupting natural ecosystems across the
world, especially in areas that have experienced extensive recent anthropogenic land use change. Eval-
uating multi-dispersal scenarios of ecological connectivity networks provides an important means to
evaluate how dispersal ability influences the prediction of optimal ecological networks. Few examples
exist of the dependence of connectivity networks on the scale of dispersal ability used in the analysis.
In this study, we performed supervised classification to map land use types using Landsat 8 imagery,
then used Morphological Spatial Pattern Analysis and Conefor to identify important core areas for bi-
odiversity, and finally used UNICOR to simulate the resistant kernel and factorial least-cost path con-
nectivity networks. Our main results show: (1) Species with dispersal abilities of ≤ 2 km showed gen-
erally low connectivity in most areas, with core areas of high connectivity mainly in Luohe central area,
Linying county and Wuyang county, and major corridors were restricted within the Luohe central area,
Linying county and Wuyang county. Species with dispersal abilities of 4 km and 8 km showed a net-
work of connectivity with multiple pathways connecting the interior of the study area. Finally, species
with dispersal abilities of ≥ 16 km showed high connectivity levels and appeared fairly insensitive to
current configurations of human development in the study area. (2) Intensely developed areas may be
obstructing species movements into the southeastern and northeastern parts of the region. The green
space along roads and rivers may facilitate movement and promote connectivity. In future planning,
planners should consider ways to enhance ecological connectivity networks, such as identified in this
study, for conserving species with limited dispersal range.
Keywords: Ecological network, dispersal ability, resistant kernel, factorial least-cost path

1      Introduction
With the rapid increase of industrialization and urbanization, natural ecosystems and ecosys-
tem services in China are experiencing landscape fragmentation and degradation due to urban
sprawl (PENG et al. 2018, UPADHYAY et al. 2017). In effect, landscape fragmentation and
degradation cause habitat loss and impact the movement of species (CLOSSET-KOPP et al.
2016). Thus, maintaining landscape connectivity and mitigating the fragmentation of habitat
may be critical for ecological processes such as gene flow, dispersal and migration (RUDNICK
et al. 2012). Ecological Networks (ENs) can provide conservation solutions to mitigate the
damage caused by intensified land use (JONGMAN 2008) by promoting landscape connectiv-
ity and reducing landscape fragmentation (UPADHYAY et al. 2017) through facilitating gene

Journal of Digital Landscape Architecture, 6-2021, pp. 230-244. © Wichmann Verlag, VDE VERLAG GMBH ·
Berlin · Offenbach. ISBN 978-3-87907-705-2, ISSN 2367-4253, e-ISSN 2511-624X, doi:10.14627/537705020.
This article is an open access article distributed under the terms and conditions of the Creative Commons
Attribution license (http://creativecommons.org/licenses/by-nd/4.0/).
G. Wang et al.: Ecological Connectivity Networks for Multi-dispersal Scenarios              231

flow, migration, dispersal of species (RICOTTA et al. 2000). Therefore, an optimized ecolog-
ical network (EN) spatial pattern is of great significance for the sustainable development of
urban and rural ecosystems (RUIZ-GONZÁLEZ et al. 2014).
While several studies have assessed ecological network connectivity for species of conser-
vation concern in many parts of the world (e. g., CUSHMAN et al. 2014 and 2016, KASZTA et
al. 2019 and 2020, ASHRAFZADEH et al. 2020), relatively few have explicitly evaluated the
sensitivity of these network predictions to the dispersal ability of focal organisms. This is
particularly important, as dispersal ability has been shown to be the most important factor
affecting functional connectivity in several taxonomic groups (e. g., CUSHMAN et al. 2010a,
ASH et al. 2020). The few ecological network assessments that have explicitly assessed the
effects of dispersal ability have found strong influences on predictions and conclusions re-
garding conservation recommendations (e. g., CUSHMAN et al. 2010a, 2013a and 2016,
RIORDAN et al. 2016, MACDONALD et al. 2018).
Despite being one of the largest nations in the world, with the world’s largest population and
one of the fastest-growing economies, there have been relatively few landscape-scale assess-
ments of the structure, function and optimality of ecological networks completed in China.
In 1979, Three-North Shelterbelt was the first exploration of ecological construction to im-
prove the desert environment in China. After the 1990s, the Chinese government announced
a set of urbanization policies which resulted in the creation of vast urban development, but
also the first coordinated efforts to enhance green areas for health, aesthetic and biodiversity
values. These included initiatives such as Landscape Garden City, Forest City, Ecological
Garden City and City in the Park. In recent years, national planning in China has increasingly
considered the security and health of ecological processes to protect ecosystems systemati-
cally (PENG et al. 2018).
Luohe city was designated a National Landscape Garden City in 2002 and National Forest
City in 2010, which have directed development to enhance green open space for the physical
and mental health of residents. Its developments of ecological connectivity networks and
green urbanization represent an example of a national focus on green development. While
Luhoe is a focus of green development, there has been relatively little quantitative and ana-
lytical work to assess the effectiveness and optimize the future development of green infra-
structure in the region. Little is known about how multi-dispersal scenarios can influence the
ecological connectivity network in the Luohe region. To provide this critical information, we
applied the UNIversal CORridor and network simulation model (UNICOR) (LANDGUTH et
al. 2012) to map the ecological connectivity networks for multi-dispersal scenarios in Luohe
region, China, where intensive construction activities over the past several decades have re-
sulted in massive and rapid land use change and reduction in natural ecosystems and habitats.
We have three goals: (1) to map and compare resistant kernel maps at multi-dispersal scenar-
ios, (2) to map and compare factorial least-cost paths at multi-dispersal scenarios, and (3) to
rank conservation orders of ecological connectivity network.

2     Study Area
Luohe region is located in central Henan province (113º27′ – 114º16′E, 33º24′ – 33º59′N)
and is characterized by varied topography of plateau and hills in the west and lower riverine
valleys in the east. The total municipal territory of Luohe region is 2617 km2, including
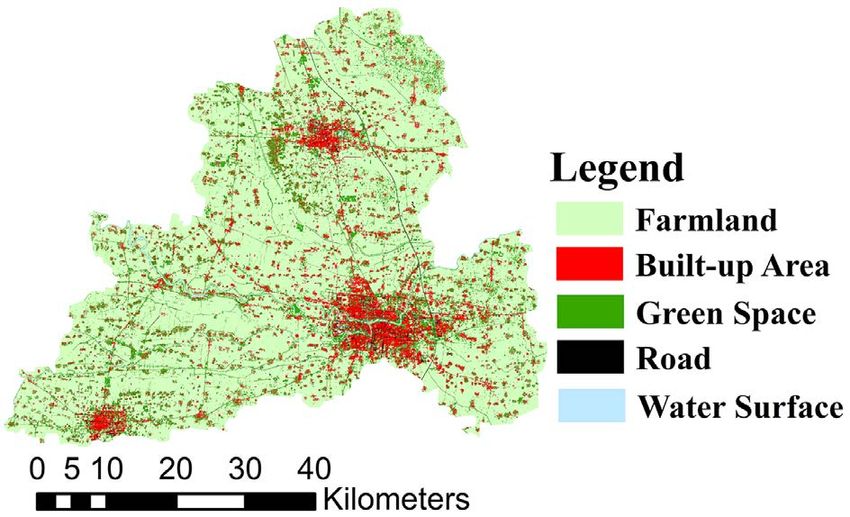
232                                          Journal of Digital Landscape Architecture · 6-2021

Yuanhui district, Yancheng district, Shaoling district, Wuyang county and Linying county
(Figure 1), spanning 76 km from east to west and 64 km from north to south. Luohe city is
developed along Sha and Li rivers which meet in the central area.

Fig. 1: Location of Luohe region within Henan Province

3     Methods
3.1   Multi-dispersal Scenarios and Ecological Source Selection
We evaluated connectivity network predictions across seven dispersal thresholds, including
1 km, 2 km, 4 km, 8 km, 16 km, 32 km, 64 km (MATEO SANCHEZ et al. 2013), which follows
power two scaling to span the scale of the study area and the potential dispersal ability of
most native species. In this way, we evaluated a general sensitivity of ecological network
predictions to dispersal for species associated with green space.

3.2   Remotely Sensed Image Acquisition and Preprocessing
1) Image acquisition. We downloaded two Landsat 8 images on June 14, 2019 and July 7,
   2019 (Resolution: 30 m; Coordinate system: WGS_1984_UTM_zone_50N and WGS_
   1984_UTM_zone_49N respectively) from EarthExplorer – USGS (INTERNET 1. 2021).
   At that time the wheat in Henan province was fully mature, with a distinctive yellow
   color, and as green space is characterized by high reflectance in the green wavelengths,
   it is possible to distinguish green space and farmland spectrally with great accuracy.
2) Image preprocessing. In ENVI 5.3, we used Radiometric Calibration and FLAASH
   Atmospheric Correction functions to produce two maps, then clipped them using the
   boundary of the Luohe region. Because the whole Luohe region involves two images,
   classification accuracy was not high at the edge of the maps when we mosaicked them.
   Classifying them first then mosaicking them solved the problem.
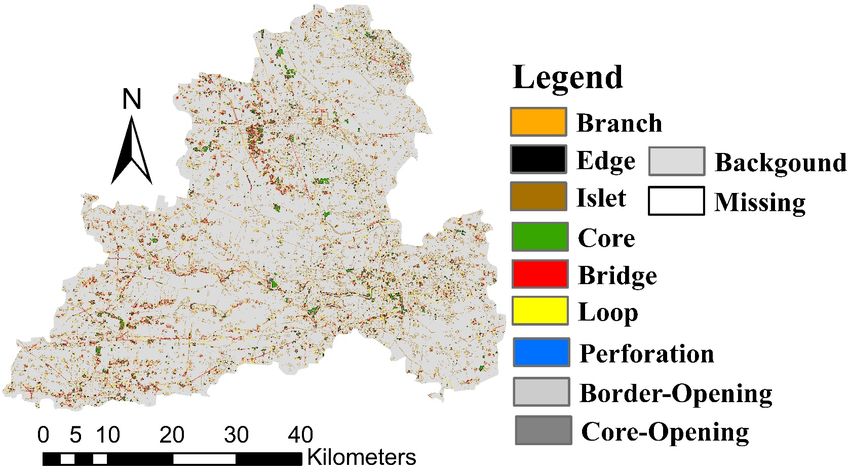
G. Wang et al.: Ecological Connectivity Networks for Multi-dispersal Scenarios          233

3) Classification. We selected five types of the land cover of interest – green space (e. g.
   forest, grassland, shrubland, orchard, urban green area), farmland, water surface, road
   and built-up area (AQSIQ, SAC. 2017), and performed a supervised classification to pre-
   pare land use/land cover (LULC) map using Support Vector Machine Classification in
   ENVI, then we input two classification maps into ArcGIS to mosaic them using Mosaic
   To New Raster function (Figure 2).

Fig. 2: LULC classification of Luohe region

4) Accuracy assessment. We chose 100 ground truth points on a Sentinel-2 image (Reso-
   lution: 10 m) on September 30, 2019, to test the accuracy of classification using the
   Confusion Matrix Using Ground Truth ROIs function in ENVI.
5) Fragmentation analysis. Calculated five class metrics including Patch Density (PD),
   Percentage of Landscape (PLAND), Radius of Gyration_Area-Weighted Mean
   (GYRATE_AM), Edge Density (ED), and Aggregation Index (AI) in Fragstats
   (MCGARIGAL et al. 2002 and 2012) to quantify the structure and composition of the land
   use mosaic. These metrics were chosen given past research that demonstrated their utility
   in species environment relationship modeling (GRAND et al. 2004, CHAMBERS et al.
   2016), and connectivity and gene flow modeling (CUSHMAN et al. 2013b and 2012b).
   The ecological meaning of these metrics can be found in (CUSHMAN & MCGARIGAL
   2008, CUSHMAN et al. 2008, CUSHMAN & MCGARIGAL 2019).

3.3   Identifying and Ranking Core Areas
We used two criteria to evaluate the importance of core areas of green habitat.
1) The size of green space, since species often have minimum patch area requirements to
   occupy and persist in a habitat patch. To accomplish this, we reclassified the land use
   types in ArcGIS. We set the value of green space is two as foreground, the value of other
   land use types is one as background, then input the data into GuidosToolbox and con-
   ducted Morphological Spatial Pattern Analysis (MSPA) (SOILLE & VOGT 2009). The
   green space was divided into seven classes – core, branch, edge, islet, bridge, loop and
234                                               Journal of Digital Landscape Architecture · 6-2021

      perforation. The core is defined as areas of large extent of green space, the islet is defined
      isolated pixels unconnected any other pixels, the bridge and loop are connectors linking
      core areas, edge and perforation are the outer and inner boundaries of habitat patches,
      the branch is connector linking one end to a habitat patch (SOILLE & VOGT 2009,
      CARLIER & MORAN 2019). Then we chose class metrics of PD, PLAND, GYRATE_AM,
      ED, AI to measure the spatial pattern of each type of green space. Among them, we
      extracted Core as core areas, then we selected all core with areas greater than 50,000 m2
      for inclusion in the next analysis.
2) Degree of Probability of Connectivity (dPC), representing habitat availability and con-
   nectivity (HOFMAN et al. 2018). We used Conefor 2.6 to identify the important nodes,
   and chose core areas whose dPC is larger than 1 to represent the important nodes for the
   connectivity network across the Luohe region. Then we calculated landscape metrics of
   PD, GYRATE_AM, ED, AI to measure the landscape pattern of important nodes.

3.4    Ecological Connectivity Network Mapping and Evaluating
The UNIversal CORridor and network simulation model (UNICOR) (LANDGUTH et al. 2012)
includes two approaches for quantifying landscape connectivity. The first approach is re-
sistant kernel modeling (COMPTON et al. 2007). Resistant kernel modeling predicts the inci-
dence function of the rate of expected movement from a defined set of source locations cu-
mulatively through a landscape (CUSHMAN et al. 2012a) for every pixel in the study area,
rather than only for a few selected “linkage zones” (COMPTON et al. 2007). The second ap-
proach is factorial least-cost path modeling (CUSHMAN et al. 2009). Factorial least-cost path
modeling predicts movement corridors and corridor strength (CUSHMAN et al. 2013c) for
species with multi-dispersal abilities.
1) Resistance Surface. Based on the literature review (YIN et al. 2011, JIANG et al. 2016)
   and the purposes of this study, we set the resistance values of green space, water surface,
   farmland, road, built-up area is 1, 10, 30, 90, and 100 respectively.
2) Source points. We extracted centroids of the important nodes from Conefor to be the
   source points.
3) Resistant kernel modeling and factorial least-cost path modeling. We input resistance
   surface and points location in UNICOR and predicted resistant kernel and factorial least-
   cost path networks for each dispersal ability threshold.
4) Ecological connectivity network evaluation. We used the function of Raster Calculator
   in ArcGIS to standardize values of resistant kernels in order to compare the differences
   of multi-dispersal scenarios. We overlapped the resistant kernel & factorial least-cost
   path and main road & main river to show the location of the paths.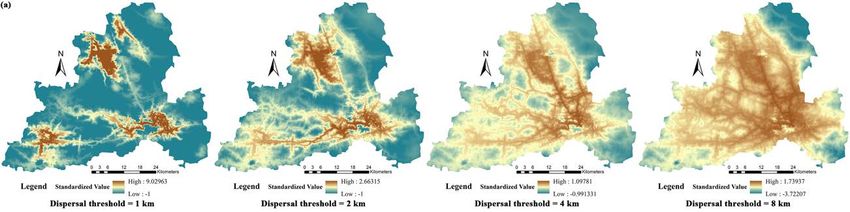
G. Wang et al.: Ecological Connectivity Networks for Multi-dispersal Scenarios 235
4 Results
4.1 Land Use Classification
Accuracy assessment (Table 1) showed the overall accuracy is 92.1478%, with a Kappa Co-
efficient of 0.8806. This shows the classification is highly successful and robust for use as
the basis of the rest of the analysis.
4.2 Definition and Rank of Core Areas
MSPA analysis (Figure 3) indicated that Core is 1.4%, islet is 4.65%, perforation is 0.01%,
Edge is 2.85%, loop is 0.37%, bridge is 1.18%, branch is 2.77% of the extent of the analysis
area. The highest ratio of islet showed that 4,65% of green space is isolated. The core ratio
showed that 1.4% of the area is core areas. The bridge and the loop ratio showed that 0.37%
+ 1.18% of area connect the core area. The edge and the perforation ratio showed that 2.85%
+ 0.01% of green space are the outer and inner boundaries of habitat patches. The branch
ratio showed that 2.77% of green space only connect one end to a habitat patch.
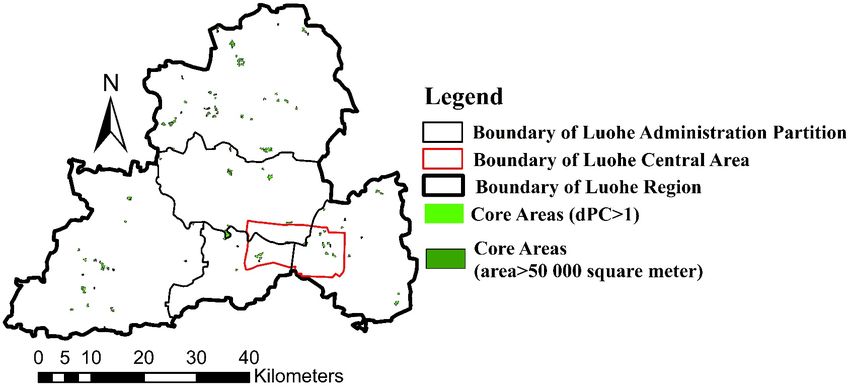
Conefor analysis showed there are 80 core areas which a value of dPC greater than 1, which
were chosen for the first protection order. Through MSPA analysis we chose 96 core areas
which have areas larger than 50,000 m2. Based on these two criteria, there were 96 – 80 =16
core areas to be the second protection order. Most of the core areas are located in Luohe
central area, Linying county and Wuyang county (Figure 4).
Table 1: Accuracy assessment of land use classification (Overall Accuracy = 92.1478%,
Kappa Coefficient = 0.8806)
Class Commission Omission Prod. Acc. User Acc.
(Percent) (Percent) (Percent) (Percent)
Farmland 3.88 0 100 96.12
Built-up Area 16.07 7.84 92.16 83.93
Green Space 26.47 28.57 71.43 73.53
Road 4.55 46.15 53.85 95.45
Water Surface 6.74 2.35 97.65 93.26
4.3 Fragmentation Analysis
Fragmentation analysis of land use types is reported in Table 2. The PLAND revealed that
the proportion of land use types in descending order of extent is: farmland > green space >
built-up area > water surface > road. This showed that the Luohe region has farmland-domi-
nated land use. The PD and ED of green space are 12.3583 and 70.1397 respectively, showing
that green space in the region is highly fragmented. AI of green space is larger than road and
water surface, showing that green space is more aggregated than these highly heterogeneous
cover types.
236                                           Journal of Digital Landscape Architecture · 6-2021

Fig. 3: MSPA results of Luohe region

After selecting green space core areas using Conefor, we reanalyzed fragmentation on this
subset (Tables 3 and 4). The PD and ED decreased, the GYRATE_AM and AI increased for
the core area green space subset compared to the full green space mosaic. This shows that
raw green space has many more and smaller patches of a higher diversity of types, and that
the final core areas have more homogeneous patches of larger size. This shows our selection
was successful in identifying the largest and most aggregated patches of green space for con-
servation and management focus.

Fig. 4: Location of core areas of Luohe region
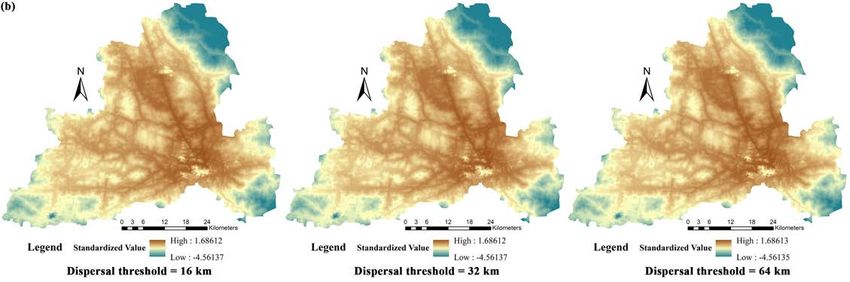
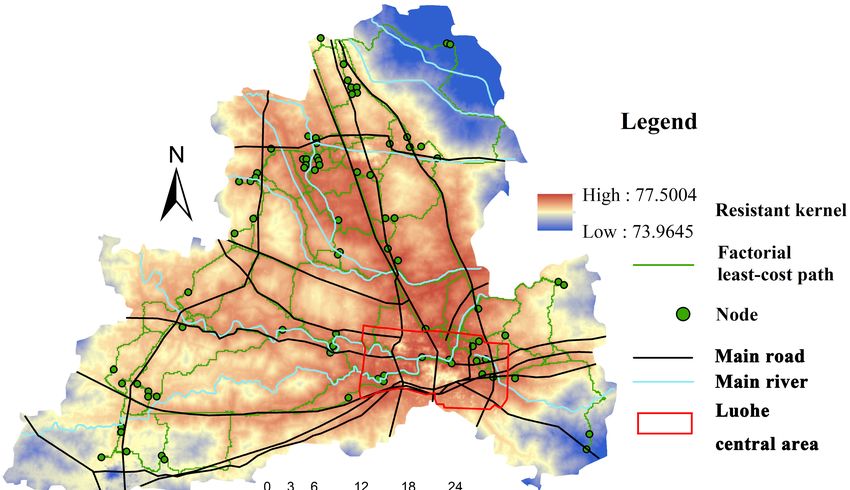
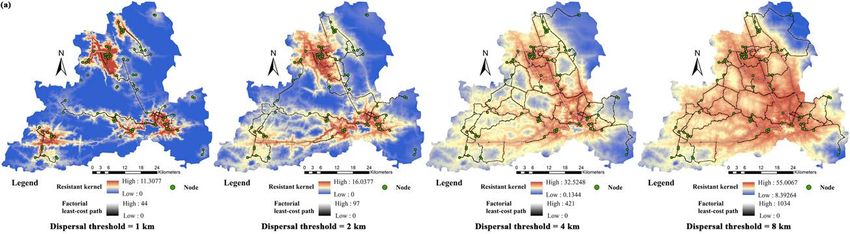
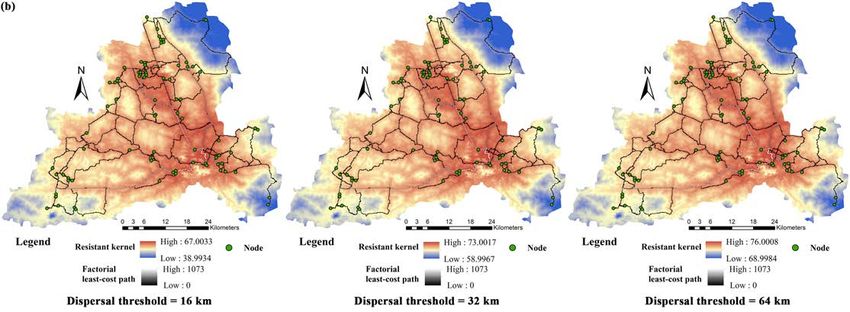
G. Wang et al.: Ecological Connectivity Networks for Multi-dispersal Scenarios              237

Table 2: Fragmentation analysis of land use types (class metrics)
Class                PLAND          PD            ED            GYRATE_AM        AI
Farmland             75.2578        4.3621        70.2955       8906.892         92.9359
Built-up Area        9.3464         4.807         36.0924       600.3523         71.152
Green Space          13.2222        12.3583       70.1397       280.5806         60.2107
Road                 0.768          1.9858        6.1258        118.3107         40.3934
Water Surface        1.4057         2.2244        7.3363        3327.675         59.9499

Table 3: Fragmentation analysis of MSPA results (class metrics)
TYPE                 PLAND           PD           ED           GYRATE_AM         AI
Loop                 3.5063          3.0822       10.2066      101.7828          42.4706
Islet                35.137          86.1615      0            63.0258           41.3329
Branch               20.9781         52.6468      33.3189      68.7404           40.739
Edge                 17.4077         22.713       76.018       75.5529           43.0736
Core                 10.5946         15.7893      53.9287      101.939           61.986
Bridge               12.3253         6.9406       39.3989      154.3613          45.8415
Perforation          0.0509          0.0504       0.253        56.3837           51.2

Table 4: Fragmentation analysis of core areas (landscape metrics)
TYPE                 PD                   ED                GYRATE_AM            AI
Core Areas           7.9146               0                 225.3534             84.2022

4.4   Resistant Kernel Evaluation
Resistant kernel (Figure 5) values are the spatial incidence function of the expected density
of movement through each cell in the landscape by dispersing organisms with the specified
dispersal ability, moving from the specified source cells, and responding to the specified re-
sistance surface (Cushman et al. 2012a). Generally speaking, the resistant kernel increased
with the dispersal threshold increased. The values of the resistant kernel (Figure 5) and stand-
ardized value (Figure 6) changed dramatically with dispersal thresholds of ≤ 2 km; species
with dispersal abilities of ≤ 2 km showed generally low connectivity in most of areas (Figure
5 and 6), with core areas of high connectivity mainly in Luohe central area, Linying county
and Wuyang county. That means species with dispersal abilities ≤ 2 km, and which are de-
pendent on greenspace for habitat, will experience fragmentation of their populations across
the Luohe region. In future planning in the Luohe region, planners should consider species
of short dispersal abilities and build stepping stones strategically across the region to enable
linkage among the green space network to meet their biodiversity requirements.
The values of the resistant kernel (Figure 5) and standardized value (Figure 6) have a mod-
erate increase with dispersal thresholds of 4 km and 8 km. Species with dispersal abilities of
4 km and 8 km showed a network of connectivity with multiple pathways connecting the
interior of the study area. That means species whose dispersal or migration distance is be-
tween 4 km and 8 km and which are dependent on greenspace for habitat would be affected
intermediately with strong connectivity in the core network of central green space but limited
longer distance connectivity, particularly to the northeast and southwest corners of the study
238                                             Journal of Digital Landscape Architecture · 6-2021

region. Planners should build parks or gardens in the areas where linkage is most limited
between the core areas to protect medium dispersal abilities’ species in future planning.

Fig. 5: Comparison of resistant kernel and factorial least-cost path

Finally, the value of the resistant kernel (Figure 5) increased slowly and the standardized
value (Figure 6) almost did not change with dispersal thresholds ≥ 16 km. Species with dis-
persal abilities of ≥ 16 km showed high connectivity levels and appeared fairly insensitive to
current configurations of human development in the study area. That means species whose
dispersal abilities are ≥ 16 km which are dependent on greenspace for habitat would be af-
fected slightly by the location and configuration of green space patches given their ability to
integrate and move between patches through high dispersal. Planners could choose a few
conservation areas with complete ecosystem functionality to conserve long distance dispersal
species. Species with large dispersal ability, however, generally also have larger body sizes
and lower population densities, so their ability to persist is likely limited by the small extent
and generally small size of green space patches. For these species with high vagility but large
habitat area requirements conservation strategies should focus on increasing the extent of
green space as much as possible with less concern about where it is located.
In the southeastern and the northeastern parts of the region, the connectivity is the lowest at
all dispersal scenarios (Figure 5), because of limited green space in these intensively agricul-
tural areas, and because built-up areas of Luohe central area and Linying county may act as
movement barriers inhibiting species to move to the southeast and northeast. Planners should
consider more about how to increase the connectivity in intense built-up areas. In the central
area, there is still high connectivity even if there is the most intense built-up area, the plenty
of green space along the Sha-Li river in the central area results in the consequences.
G. Wang et al.: Ecological Connectivity Networks for Multi-dispersal Scenarios              239

Fig. 6: Comparison of the standardized value of the resistant kernel

4.5   Factorial Least-Cost Path Evaluation
Multi-dispersal scenarios have the same corridor patterns, but very different network extents
and linkage (Figure 5). This means that different dispersal abilities do not influence the cor-
ridor patterns, but strongly affect how extensive and interlinked the corridor network is. The
pattern is primarily driven by the source points and the resistance layer, which are consistent
among scenarios. The strength, extent and connectivity of the network are primarily driven
by dispersal ability. The number and strength of paths changed dramatically with dispersal
thresholds of ≤ 2 km, with the network highly limited and localized around clusters of core
patches. The number and strength of paths stayed approximately the same at dispersal thresh-
olds of 4 km and 8 km. The number and strength of paths changed relatively little as well at
dispersal thresholds of ≥ 16 km. This means species with short dispersal ability are very
sensitive to network breakage and fragmentation, and planners must carefully plan networks
of stepping stone green space patches along the routes of most important connectivity among
core areas of green space.

4.6   Overlapping Map Evaluation
Main roads and rivers passed through high connectivity areas, and most Factorial least-cost
paths are aligned with main roads and rivers (Figure 7). This reflects past urban design ap-
plications in which planners concentrated on the creation of green space along roads and
rivers based on national policies. This showed that not only land use type influences the spe-
cies’ dispersal, but also national policies about the green space construction. It reminds plan-
ners to build more green space combined with other landscape elements, for instance, river
corridors and transport corridors.
240                                             Journal of Digital Landscape Architecture ꞏ 6-2021

Fig. 7: Overlapping map of main road & main river and resistant kernel & factorial least-
        cost path

5     Discussion
Our overall goal in this study was to assess the pattern of green network connectivity in the
Luhoe region across a range of dispersal abilities. Our main result is that connectivity, as-
sessed both by the factorial least-cost path and resistant kernel methods, was highly sensitive
to dispersal ability, with strong threshold effects below 4 km dispersal distance at which the
connectivity of the system broke down dramatically. Conversely, above 8 km dispersal abil-
ity, the network appeared highly connected across the full region. Moreover, we identified
three hypotheses to discuss.
1) Hypothesis 1: Kernel connectivity will increase with dispersal ability. Kernel con-
   nectivity represents the predicted spatially-explicit dispersal rates across the study area
   extent (CUSHMAN et al. 2010b). As expected, species with small dispersal abilities of ≤
   2 km have low kernel connectivity, which changed dramatically from the larger dispersal
   abilities. Species with large dispersal abilities are predicted to have high kernel connec-
   tivity and the value of that stayed stable above dispersal ability of 16 km. These results
   suggest that planners should rank the conservation order based on the study results: spe-
   cies with dispersal abilities of ≤ 2 km are the first protection order, species with dispersal
   abilities of 4 km and 8 km are the second protection order, species with dispersal abilities
   of ≥ 16 km are the third protection order in Luohe region.
2) Hypothesis 2: Symmetry of thresholds of kernel connectivity and factorial least-
   cost path connectivity. Factorial least-cost path analysis showed the optimal routes of
   potential corridors across all combinations of source points, and reflected the relative
   strength of linkage across the landscape (CUSHMAN et al. 2018). Our analysis showed
G. Wang et al.: Ecological Connectivity Networks for Multi-dispersal Scenarios 241
that the number and strength of paths changed dramatically with dispersal abilities of ≤
2 km, and the number and strength of paths stayed stable with large dispersal abilities,
showing the same dispersal threshold sensitivity as the kernel connectivity analysis. That
means the change of the factorial least-cost path is synchronous with the change of the
kernel connectivity. These results remind planners to improve connectivity through
building more green space concentrated in areas predicted to be important linkages based
on both kernel and factorial least-cost path methods, across the full range of dispersal
abilities.
3) Hypothesis 3: Most ecological connectivity networks are along with roads and riv-
ers. After 1990, the Chinese government launched policies to improve ecosystem man-
agement and conservation, resulting in the creation of extensive green space along trans-
portation corridors and riparian corridors (PENG et al. 2017). Luohe city reflects this
characteristic; most ecological connectivity networks are along roads and rivers. It re-
minds planners that future green space should be created in other landscape contexts,
particularly in areas of the landscape with low human activity levels and disturbance to
promote the existence and movement of species sensitive to human disturbance.
4) Scope and limitations. The resolution of Landsat 8 images is low, which might affect
the results of the land use classification and MSPA analysis. In future research, we
should use high-resolution images to compare how the resolution of images affects the
results. We defined five classes of land use for general species, we will specify the green
space types (e. g. forest, grassland, shrubland, orchard, urban green area) based on the
exact species in the future deep research. There might be some errors because of the
number of ground points we chose, we should choose more points in the next study.
6 Conclusion and Outlook
In UNICOR analysis, we had three conclusions based on the results and goals:
1) Resistant kernel analysis predicted the density of dispersal movement across the land-
scape, and showed that the extensiveness of kernel connectivity was highly dependent
on dispersal ability. At small dispersal abilities of ≤ 2 km there were high levels of frag-
mentation, and as dispersal ability increased kernel connectivity produced broader ex-
tents of interconnected habitat.
2) Factorial least-cost paths predicted the routes of highest potential connectivity linking
all pairs of source points. This shows the optimal network of linkages among the source
locations. Different dispersal abilities have the same pattern of corridors, but the extent
and connectivity of the network are highly sensitive to dispersal ability. Depending on
dispersal ability, least-cost paths do not connect all the ecological nodes because of the
high density of built-up areas, but the paths pass through the central area thanks to the
green space along the rivers.
3) Conservation order based on the results. We recommend planners should build plenty of
stepping stones located in breakages in our predicted connectivity network of additional
roadside green spaces, residential area green spaces, transport corridor, river corridor to
protect species with dispersal ability of ≤ 2 km, which is the first conservation order.
Planners should build some parks or gardens with city features to protect species with242 Journal of Digital Landscape Architecture · 6-2021
dispersal ability of 4 km and 8 km, which the second conservation order. Planners should
build fewer but larger conservation areas in areas of low human activity and disturbance
to protect species with dispersal ability of ≥ 16 km, which is the third conservation order.
References
AQSIQ & SAC (2017), Classification of land use status GB/T 21010-2017. Standards Press of
China, Beijing.
ASH, E., CUSHMAN, S. A., MACDONALD, D. W., REDFORD, T. & KASZTA, Ż. (2020), How
important are resistance, dispersal ability, population density and mortality in temporally
dynamic simulations of population connectivity? A case study of tigers in Southeast Asia.
Land, 9 (11), 415.
ASHRAFZADEH, M. R., KHOSRAVI, R., ADIBI, M. A., TAKTEHRANI, A., WAN, H. Y. &
CUSHMAN, S. A. (2020), A multi-scale, multi-species approach for assessing effective-
ness of habitat and connectivity conservation for endangered felids. Biological Conser-
vation, 245, 108523.
CARLIER, J. & MORAN, J. (2019), Landscape typology and ecological connectivity assess-
ment to inform Greenway design. Science of the Total Environment, 651, 3241-3252.
CHAMBERS, C. L., CUSHMAN, S. A., MEDINA-FITORIA, A., MARTÍNEZ-FONSECA, J. & CHÁ-
VEZ-VELÁSQUEZ, M. (2016), Influences of scale on bat habitat relationships in a forested
landscape in Nicaragua. Landscape Ecol., 31, 1299-1318.
CLOSSET-KOPP, D., WASOF, S. & DECOCQ, G. (2016), Using process-based indicator species
to evaluate ecological corridors in fragmented landscapes. Biological Conservation, 201,
152-159.
COMPTON, B. W., MCGARIGAL, K., CUSHMAN, S. A. & GAMBLE, L. R. (2007), A resistant-
kernel model of connectivity for amphibians that breed in vernal pools. Conservation Bi-
ology, 21 (3), 788-799.
CUSHMAN, S. A. & MCGARIGAL, K. (2008), Landscape metrics, scales of resolution. In:
GADOW, K. & PUKKALA, T. (Eds.) (2008), Designing Green Landscapes – Managing
Forest Ecosystems, 15. Springer, Dordrecht, Netherlands.
CUSHMAN, S. A., MCGARIGAL, K. & NEEL, M. C. (2008), Parsimony in landscape metrics:
Strength, universality, and consistency. Ecological Indicators, 8 (5), 691-703.
CUSHMAN, S. A., MCKELVEY, K. S. & SCHWARTZ, M. K. (2009), Use of Empirically Derived
Source‐Destination Models to Map Regional Conservation Corridors. Conservation Bio-
logy, 23 (2), 368-376.
CUSHMAN, S. A., COMPTON, B. W. & MCGARIGAL, K. (2010a), Habitat fragmentation effects
depend on complex interactions between population size and dispersal ability: modeling
influences of roads, agriculture and residential development across a range of life-history
characteristics. In: CUSHMAN S. A. & HUETTMAN, F. (Eds.) (2010), Spatial complexity,
informatics, and wildlife conservation. Springer, Tokyo, Japan.
CUSHMAN S. A., LANDGUTH E. L. & FLATHER C. H. (2010b), Climate change and connec-
tivity: Assessing landscape and species vulnerability – Phase 1: Final Report to USFWS
Great Plains Landscape Conservation Cooperative, December 21, 2010.
CUSHMAN, S. A., LANDGUTH, E. L. & FLATHER, C. H. (2012a), Evaluating the sufficiency
of protected lands for maintaining wildlife population connectivity in the U.S. northern
Rocky Mountains. Diversity and Distributions, 18 (9), 873-884.G. Wang et al.: Ecological Connectivity Networks for Multi-dispersal Scenarios 243 CUSHMAN, S. A., SHIRK, A. & LANDGUTH, E. L. (2012b), Separating the effects of habitat area, fragmentation and matrix resistance on genetic differentiation in complex land- scapes. Landscape Ecology, 27, 369-380. CUSHMAN, S. A., LANDGUTH, E. L. & FLATHER, C. H. (2013a), Evaluating population con- nectivity for species of conservation concern in the American Great Plains. Biodiversity and Conservation, 22, 2583-2605. CUSHMAN, S. A., SHIRK, A. J. & LANDGUTH, E. L. (2013b), Landscape genetics and limiting factors. Conservation Genetics, 14, 263-274. CUSHMAN, S. A., LEWIS, J. S. & LANDGUTH, E. L. (2013c), Evaluating the intersection of a regional wildlife connectivity network with highways. Movement Ecology, 1, 12. CUSHMAN, S. A., LEWIS, J. S. & LANDGUTH, E. L. (2014), Why did the bear cross the road? Comparing the performance of multiple resistance surfaces and connectivity modeling methods. Diversity, 6 (4), 844-854. CUSHMAN, S. A., ELLIOT, N. B., MACDONALD, D. W. & LOVERIDGE, A. J. (2016), A multi- scale assessment of population connectivity in African lions (Panthera leo) in response to landscape change. Landscape Ecol., 31, 1337-1353. CUSHMAN, S. A., ELLIOT, N. B., BAUER, D., KESCH, K., BAHAA-EL-DIN, L. & BOTHWELL, H. (2018), Prioritizing core areas, corridors and conflict hotspots for lion conservation in southern Africa. PLoS ONE, 13 (7), e0196213. CUSHMAN, S. A. & MCGARIGAL, K. (2019), Metrics and models for quantifying ecological resilience at landscape scales. Frontiers in Ecology and Evolution, 7, 440. doi:10.3389/fevo.2019.00440. GRAND, J., BUONACCORSI, J., CUSHMAN, S. A., GRIFFIN, C. R. & NEEL, M. C. (2004), A multiscale landscape approach to predicting bird and moth rarity hotspots in a threatened pitch pine-scrub oak community. Conservation Biology, 18 (4), 1063-1077. HOFMAN, M. P. G., HAYWARD, M. W., KELLY, M. J. & BALKENHOL, N. (2018), Enhancing conservation network design with graph-theory and a measure of protected area effec- tiveness: Refining wildlife corridors in Belize, Central America. Landscape and Urban Planning, 178, 51-59. https://earthexplorer.usgs.gov/ (21.03.2021). JONGMAN, R. (2008), Ecological networks are an issue for all of us. Journal of Landscape Ecology, 1 (1), 7-13. JIANG, S., ZHANG, Q. & TAO, H. (2016), Construction and evaluation of green space ecolog- ical network in Guangzhou. Acta Scientiarum Naturalium Universitatis Sunyatseni, 55 (4), 162-170. KASZTA, Ż., CUSHMAN, S. A., HEARNA, A. J., BURNHAM, D., MACDONALD, E. A., GOOSSENS, B., NATHAN, S. K. S. S. & MACDONALD, D. W. (2019), Integrating Sunda clouded leopard (Neofelis diardi) conservation into development and restoration planning in Sabah (Bor- neo). Biological Conservation, 235, 63–76. KASZTA, Ż., CUSHMAN, S. A. & MACDONALD, D. W. (2020), Prioritizing habitat core areas and corridors for a large carnivore across its range. Animal Conservation, 23 (5), 607- 616. LANDGUTH, E. L., HAND, B. K., GLASSY, J., CUSHMAN, S. A. & SAWAYA, M. A. (2012), UNICOR: a species connectivity and corridor network simulator. Ecography, 35 (1), 9- 14. MACDONALD, E. A., CUSHMAN, S. A., LANDGUTH, E. L., HEARN, A. J., MALHI, Y. & MACDONALD, D. W. (2018), Simulating impacts of rapid forest loss on population size, connectivity and genetic diversity of Sunda clouded leopards (Neofelis diardi) in Borneo. PLoS ONE, 13 (9), e0196974.
244                                            Journal of Digital Landscape Architecture · 6-2021

MATEO SÁNCHEZ, M. C., CUSHMAN, S. A. & SAURA, S. (2013), Scale dependence in habitat
   selection: the case of the endangered brown bear (Ursus arctos) in the Cantabrian Range
   (NW Spain). International Journal of Geographical Information Science, 28 (8), 1531-
   1546.
MCGARIGAL, K., CUSHMAN, S. A., NEEL, M. C. & ENE, E. (2002), FRAGSTATS: spatial
   pattern analysis program for categorical maps. Computer software program produced by
   the authors at the University of Massachusetts, Amherst.
   www.umass.edu/landeco/research/fragstats/fragstats.html (21.03.2021).
MCGARIGAL, K., CUSHMAN, S. A. & ENE, E. (2012), FRAGSTATS v4: spatial pattern anal-
   ysis program for categorical and continuous maps. Computer software program produced
   by the authors at the University of Massachusetts.
   http://www.umass.edu/landeco/research/fragstats/fragstats.html (21.03.2021).
PENG, J., PAN, Y., LIU, Y., ZHAO, H. & WANG Y. (2018), Linking ecological degradation
   risk to identify ecological security patterns in a rapidly urbanizing landscape. Habitat In-
   ternational, 71, 110-124.
PENG, J., ZHAO, H. & LIU, Y. (2017), Urban ecological corridors construction: A review.
   Acta Ecologica Sinica, 37 (1), 23-30.
RICOTTA, C., STANISCI, A., AVENA, G. C. & BLASI, C. (2000), Quantifying the network con-
   nectivity of landscape mosaics: a graph-theoretical approach. Community Ecology, 1 (1),
   89-94.
RIORDAN, P., CUSHMAN, S. A., MALLON, D., SHI, K. & HUGHES, J. (2016), Predicting global
   population connectivity and targeting conservation action for snow leopard across its
   range. Ecography, 39 (5), 419-426.
RUDNICK, D. A., RYAN, S. J., BEIER, P., CUSHMAN, S. A., DIEFFENBACH, F., EPPS, C. W.,
   GERBER, L. R., HARTTER, J., JENNESS, J. S., KINTSCH, J., MERENLENDER, A. M., PERKL,
   R. M., PREZIOSI, D. V. & TROMBULAK, S. C. (2012), The role of landscape connectivity
   in planning and implementing conservation and restoration priorities. Issues in Ecology.
   Report 16. Ecological Society of America. Washington, D.C, U.S.
RUIZ-GONZÁLEZ, A., GURRUTXAGA, M., CUSHMAN, S. A., MADEIRA, M. J., RANDI, E. &
   GÓMEZ-MOLINER, B. J. (2014), Landscape genetics for the empirical assessment of re-
   sistance surfaces: The European pine marten (Martes martes) as a target-species of a re-
   gional ecological network. PLoS ONE, 9 (10), e110552.
   doi:10.1371/journal.pone.0110552.
SOILLE, P. & VOGT, P. (2009), Morphological segmentation of binary patterns. Pattern
   Recognition Letters, 30 (4), 456-459.
UPADHYAY, S., ROY, A., RAMPRAKASH, M., IDICULLA, J., SENTHIL, K. A. & BHAT-
   TACHARYA, S. (2017), A network theoretic study of ecological connectivity in Western
   Himalayas. Ecological Modelling, 359, 246-257.
YIN, H., KONG, F., QI, Y., WANG, H., ZHOU, Y. & QIN, Z. (2011), Developing and optimizing
   ecological networks in urban agglomeration of Hunan Province, China. Acta Ecologica
   Sinica, 31 (10), 2863-2874.
You can also read