Metagenome Profiling Identifies Potential Biocontrol Agents for Selaginella kraussiana in New Zealand - MDPI
←
→
Page content transcription
If your browser does not render page correctly, please read the page content below
G C A T
T A C G
G C A T
           genes
Article
Metagenome Profiling Identifies Potential Biocontrol
Agents for Selaginella kraussiana in New Zealand
Zhenhua Dang 1, *, Patricia A. McLenachan 2 , Peter J. Lockhart 2 , Nick Waipara 3 , Orhan Er 4 ,
Christy Reynolds 5 and Dan Blanchon 6, *
 1   Ministry of Education Key Laboratory of Ecology and Resource Use of the Mongolian Plateau & Inner
     Mongolia Key Laboratory of Grassland Ecology, School of Ecology and Environment, Inner Mongolia
     University, Hohhot 010021, China
 2   Institute of Fundamental Sciences, College of Sciences, Massey University,
     Palmerston North 4442, New Zealand; p.a.mclenachan@massey.ac.nz (P.A.M.);
     p.j.lockhart@massey.ac.nz (P.J.L.)
 3   The New Zealand Institute for Plant & Food Research Limited, Mt Albert, Auckland 1142, New Zealand;
     nick.waipara@plantandfood.co.nz
 4   Arborlab Consultancy Services, Auckland 0632, New Zealand; orhaner8@gmail.com
 5   Greenscene New Zealand Ltd., Auckland 1024, New Zealand; christy.reynolds@greenscenenz.com
 6   School of Environmental and Animal Sciences, Unitec Institute of Technology, Private Bag 92025,
     Auckland 1142, New Zealand
 *   Correspondence: zhdang_1982@aliyun.com (Z.D.); dblanchon@unitec.ac.nz (D.B.);
     Tel.: +86-151-4802-6396 (Z.D.); +64-098-154321 (ext. 7355) (D.B.)

 Received: 15 November 2018; Accepted: 22 January 2019; Published: 31 January 2019

 Abstract: Metagenomics can be used to identify potential biocontrol agents for invasive species and
 was used here to identify candidate species for biocontrol of an invasive club moss in New Zealand.
 Profiles were obtained for Selaginella kraussiana collected from nine geographically disjunct locations
 in Northern New Zealand. These profiles were distinct from those obtained for the exotic club moss
 Selaginella moellendorffii and the native club mosses Lycopodium deuterodensum and Lycopodium volubile
 also collected in Northern New Zealand. Fungi and bacteria implicated elsewhere in causing plant
 disease were identified on plants of Selaginella that exhibited signs of necrosis. Most notably, high
 densities of sequence reads from Xanthomonas translucens and Pseudomonas syringae were associated
 with some populations of Selaginella but not Lycopodium. Since these bacteria are already in use as
 biocontrol agents elsewhere, further investigation into their potential as biocontrol of Selaginella in
 New Zealand is suggested.

 Keywords: Selaginella kraussiana; invasive species; biocontrol agents; metagenome profiling

1. Introduction
     Invasive plants are generally thought to have a competitive advantage over native plants in
their new range because they have few or no natural enemies [1–4]. However, the longer a species
has been in the geographical area they have invaded, the more likely it is to accumulate pests and
pathogens, reducing that advantage [3,5–7]. It can be expected that the wider the range an invasive
plant species has, the more likely it is that it will encounter pathogens native to the region that are
capable of infecting it [3,6,8]. In addition, the longer an invasive species has been in a geographical
region, the more likely a pathogen from its original home range will also be present [6]. Other
factors, such as degree of relatedness between invasive and native plant species [9], diversity of native
pest and pathogen species, and resource availability [10], can all affect pathogen accumulation. The
diversity of pathogens that an invasive plant exhibits will thus depend on the extent of elimination of

Genes 2019, 10, 106; doi:10.3390/genes10020106                                 www.mdpi.com/journal/genes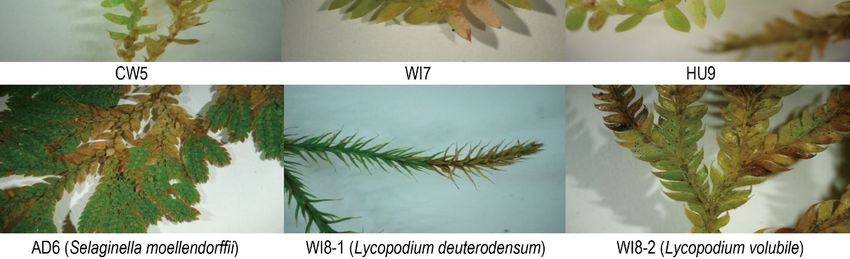
Genes 2019, 10, 106                                                                               2 of 9

co-evolved pathogens during the invasion of its new habitat and the subsequent gain of pathogens
native to its new range [11]. Potential biological control agents can be sourced from the original
home range of the invasive plant [12–15] or from the new range by screening diseased material for
candidate fungi, bacteria, and viruses [3,9,16]. As we illustrate here, metagenome profiling using
high throughput sequencing can be used to screen plants exhibiting symptoms of disease to identify
candidate organisms for biocontrol of invasive species.
     Selaginella kraussiana (African club moss) is an invasive club moss species that has naturalised
in Australasia, Europe, and North, Central, and South America [17]. In New Zealand, it has
subsequently established in shady damp conditions in lowland bush areas, home gardens, and
waterways throughout most of the country. The species forms thick forest floor mats that can
reduce species richness and suppress seedling growth of native plants [14,18]. Selaginella kraussiana
is potentially a useful organism to observe the interplay between pathogen release and pathogen
accumulation. In New Zealand, it was first reported in Wellington and the Bay of Islands in 1919 [19]
and has subsequently established throughout the country, so it has a wide geographic spread and has
had nearly a century of time for native pathogens to infect the species. The closest native relatives
(and potential source of pathogens) of S. kraussiana (Selaginellaceae) are the native club mosses in
the genera Lycopodium, Lycopodiella, and Huperzia (Lycopodiaceae). As yet there appears to be little
knowledge of naturally occurring pathogens of S. kraussiana in New Zealand or elsewhere [20]. Some
fungal species with varying degrees of pathogenicity towards the species have been reported recently
in collections of S. kraussiana in New Zealand [21,22], and more recently a study included a comparison
with the native club mosses Lycopodium deuterodensum and Lycopodium volubile. Here, we analyse
the microbial profiles of 18 samples of S. kraussiana collected from nine disjunct locations in New
Zealand matched against protein databases to gain a better understanding of the plant–fungal and
plant–bacteria associations. Microbial profiles were also determined for accessions of the related
invasive plant Selaginella moellendorffii and native L. deuterodensum to aid as references.

2. Materials and Methods

2.1. Sample Collection
     Field collection involved sampling from nine sites in the Auckland, Northland, and Waikato
regions (Figure 1). At each site, plant material was collected from two spatially separated subsites.
Samples all came from a single plant at each subsite. Subsites were chosen where S. kraussiana showed
signs of dieback, yellowing or other discolouration (Figure 2) and were also far enough removed
from the track to avoid human or animal factors in plant symptoms. Leaves, stems, and strobili were
collected from each subsite, and samples were selected to include the junction between green and
discoloured tissue. Material was collected using instruments sterilized in 70% ethanol, soil and roots
were avoided, and plant material was placed in a sealed plastic bag with a damp cloth to prevent
drying out. A hundred milligrams of material showing signs of disease was placed into 1 mL of
RNAlater (Ambion, Austin, TX, USA) in a sterile 1.7 mL microtube. The samples were stored at −20 ◦ C
prior to DNA extraction and DNA sequencing.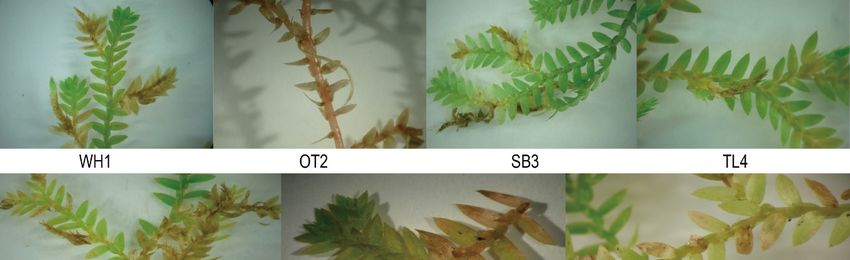
Genes 2019, 10, 106                                                                                                                             3 of 9
                 Genes 2018, 9, x FOR PEER REVIEW                                                                         3 of 11

      Figure 1. Sampling
                    Figure 1. locations      and principal
                               Sampling locations    and principalcoordinates     analysis
                                                                     coordinates analysis     (PCoA)
                                                                                          (PCoA) of Brayof  Bray
                                                                                                         Curtis    Curtis dissimilarities
                                                                                                                dissimilarities

      in taxonomicincontent
                       taxonomic content of club moss species. Blue triangles indicate two Selaginella moellendorffii samples.
                                 of club moss species. Blue triangles indicate two Selaginella moellendorffii samples.
                    Green diamond and square represent Lycopodium volubile and Lycopodium deuterodensum, respectively.
      Green diamond Filledand   square
                            Circles        represent
                                    indicate               Lycopodium
                                              Selaginella kraussiana       volubile
                                                                     samples.        and
                                                                              Sites are     Lycopodium
                                                                                        colour-coded.     deuterodensum,
                                                                                                      Location codes used are respectively.
      Filled Circles indicate Selaginella kraussiana samples. Sites are colour-coded. LocationOT2:
                    those  from  an earlier report prepared   for the Auckland  Council  WH1:  Whareora  Rd, Whangarei;    codes used are
      those from anOtaika
                      earlierValley, Whangarei; SB3: Spragg Bush, Waitakere Ranges; TL4: Tramline Track, Waitakere
                                 report prepared for the Auckland Council WH1: Whareora Rd, Whangarei; OT2:
                    Ranges; CW5: City Walk Track, Waitakere Ranges; AD6: Fernz Fernery, Auckland Domain; W17:
      Otaika Valley,Waiheke
                      Whangarei;       SB3: Te
                               Forest; W18:    Spragg
                                                  MatukuBush,      Waitakere
                                                             Bay; HU9:   Earnies Ranges;    TL4:Ranges.
                                                                                 Track, Hunua     Tramline     Track,
                                                                                                        Subsites       Waitakere
                                                                                                                  within each         Ranges;
      CW5: City WalklocationTrack,    Waitakere
                              are denoted   1–3.      Ranges; AD6: Fernz Fernery, Auckland Domain; W17: Waiheke
      Forest; W18: Te Matuku Bay; HU9: Earnies Track, Hunua Ranges. Subsites within each location are
      denoted Genes
               1–3.2018, 9, x FOR PEER REVIEW                                                                                 4 of 11

                  Figure 2. Symptoms
      Figure 2. Symptoms              suggesting
                             suggesting          disease
                                           disease   on on Selaginella and
                                                         Selaginella    andLycopodium at nineat
                                                                             Lycopodium       locations. All Selaginella
                                                                                                nine locations.       All Selaginella
                  populations exhibited some symptoms of diseased tissue.
      populations exhibited some symptoms of diseased tissue.
                 2.2. DNA Extraction
                      DNA was extracted from the samples using the Nucleospin Plant II kit from Macherey–Nagel
                 (Düren, Germany) and the protocol for Genomic DNA from Fungi outlined in the user manual. The
                 manufacturer’s protocol was followed except for the following modifications: The plant material was
                 removed from the RNAlater into a screw cap micro tube (Sarstedt, Nümbrecht, Germany). Twenty to
                 thirty 2-mm Zirconia Beads (11079124zx; BioSpec Products, Bartlesville, OK, USA) were added to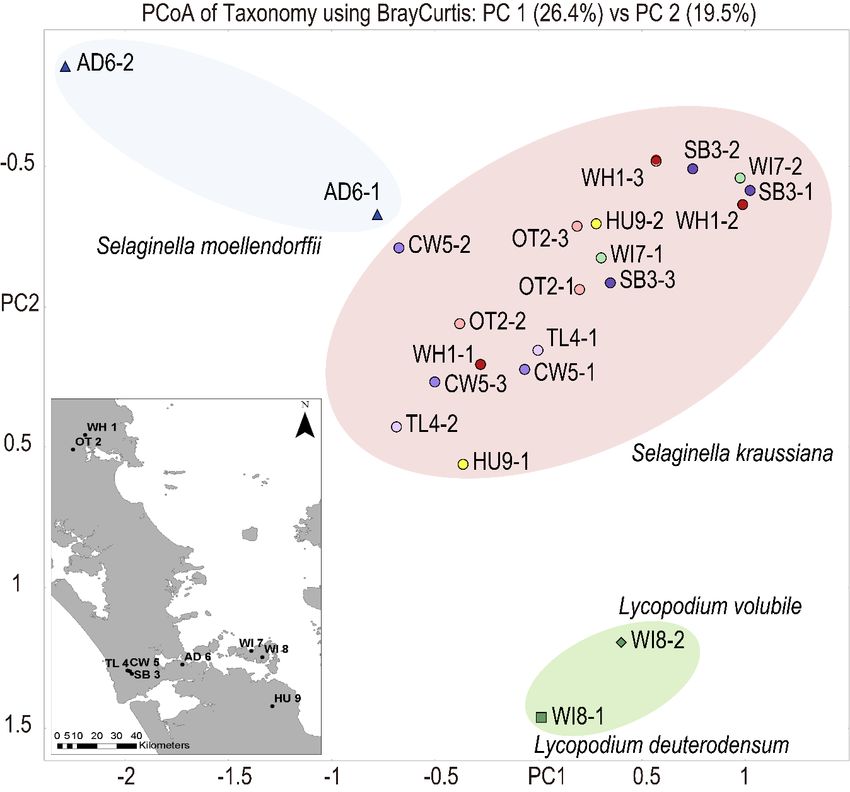
Genes 2019, 10, 106                                                                                  4 of 9

2.2. DNA Extraction
     DNA was extracted from the samples using the Nucleospin Plant II kit from Macherey–Nagel
(Düren, Germany) and the protocol for Genomic DNA from Fungi outlined in the user manual. The
manufacturer’s protocol was followed except for the following modifications: The plant material was
removed from the RNAlater into a screw cap micro tube (Sarstedt, Nümbrecht, Germany). Twenty to
thirty 2-mm Zirconia Beads (11079124zx; BioSpec Products, Bartlesville, OK, USA) were added to each
sample, along with 300 µL of Buffer PL1 (from the kit), and the screw cap was sealed with parafilm.
The samples were homogenized with the beads in a Roche MagnaLyser (Mannheim, Germany) for
90 s at 5000 rpm, RNase was not added, and the samples were incubated for 20 min at 65 ◦ C. The
protocol was followed exactly after addition of the chloroform and the DNA was eluted in 50 µL of
Elution Buffer. The concentration of DNA ranged from 0.7–17.9 ng/µL, and the purity as measured on
a Nanodrop as a 260/280 ratio varied between 1.37 and 2.07, with most samples between 1.7 and 1.9.

2.3. Sequencing
      Nextera XT libraries were prepared for the Illumina MiSeq. They were prepared manually
following the manufacturer’s protocol (15031942; Illumina, San Diego, CA, USA). DNA extracts
were quantified and normalized to 0.2 ng/µL using a Quant-iT PicoGreen assay system (Q33120;
Thermo Fisher Scientific, Waltham, MA, USA) on a Qubit 3 reader (Thermo Fisher Scientific) and then
fragmented and tagged via tagmentation for 8 minutes at 55 ◦ C (default is 5 minutes) to ensure optimal
fragmentation by the enzyme “transposase”. Prior to amplification, 5 µL of stop tagmentation buffer
(NTA) was added to stop any enzymatic activity. PCR enrichment was performed by adding 30 µL
of amplification master mix to Illumina primers and incubated using the following protocol: 72 ◦ C
for 3 minutes, 95 ◦ C for 30 seconds, 15 cycles of 95 ◦ C for 10 seconds, 55 ◦ C for 30 seconds and 72 ◦ C
for 30 seconds, 72 ◦ C for 5 minutes and, lastly, a hold at 10 ◦ C. It was followed immediately by an
AMPure XP bead cleanup (A63880l; Beckman Coulter, Takanini, Auckland, New Zealand) using PEG:
A NaCI ratio of 0.6x to retain more than 450 bp products. The Nextera XT libraries were then further
quantified for fragment size and DNA concentration using the LabChip GX Touch high sensitivity 3k
Assay (Perkin Elmer, Melbourne, Australia) and Qubit 3.0 fluorometer (Thermo Fisher Scientific). The
Nextera XT libraries (sample 5734) were then diluted to 2 nM in pooling buffer (10 mM Tris-HCL pH
8.0, dH2 O, and 0.1% (v/v) of Tween-20), prior to sequencing library cluster generation and sequencing
on a MiSeq instrument.

2.4. Data Processing
      Illumina MiSeq 2x150 base pair reads were firstly processed for quality using a standard Illumina
sequence analysis pipeline. Quality trimming was performed using DynamicTrim (a program of
the SolexaQA [23]) with an error probability cutoff of 0.01 to remove any low-quality base calls.
Follow this processing, the second round of data trimming was executed using Trimmomatic (version
0.32 [24]). Reads were hard trimmed to 120 bp by executing the Trimmomatic commands MINLEN:120
and CROP:120. The 120 base pair reads were then matched with default parameters against a local
version of the NCBI nr database (nr_2015_05_05) using DIAMOND (version 0.7.9 [25]). The weighted
LCA algorithm in MEGAN CE (version 6.9.2 [26]) was used in pair-end mode to make taxonomic
assignments. To validate the taxonomic assignments, we also performed taxonomic classification using
Kaiju (version 1.5.0 [27]) by submitting our data to the Kaiju Web Server http://kaiju.binf.ku.dk/server.
In these analyses, the NCBI BLAST nr + euk database (updated 16 May 2017) was used. We chose the
Greedy model and default parameter settings. The classification results obtained from MEGAN and
Kaiju were visualized in Microsoft Excel and compared using a Wilcoxon signed-rank test. Note that
as the number of paired-end reads with quality Phred quality score 30 varied per sample, the number
of paired-end taxonomic assignments with MEGAN–LCA also differed per sample. With MEGAN,
we normalized counts to 186,029 paired-end assignments per sample. To examine whether data base
Genes 2019, 10, 106 5 of 9
representation might have impacted inferences made concerning the presence and absence of fungal
pathogens, paired reads used in DIAMOND–MEGAN and Kaiju analyses were independently mapped
using BWA [28] (default parameter settings) to the internal transcribed spacer (ITS) regions of Phoma
selaginellicola and Pestalotiopsis clavispora which had previously been cultured from Selaginella kraussiana
in New Zealand [21,22]. The reads were also mapped to the ITS region of Parastagonospora phoenicicola
and Parastagonospora caricis, since this genus was identified in DIAMOND–MEGAN analyses of
S. kraussiana. Of interest was determining whether analyses of ITS sequences would suggest the
presence of Phoma and Pestalotiopsis on any of the accessions S. kraussiana, since these fungal species
had previously been cultured from S. kraussiana in New Zealand [21,22].
3. Results
Figure 1 shows a principle coordinates analysis (PCoA) plot visualizing Bray Curtis dissimilarities
in the DIAMOND–MEGAN bacterial and fungal taxonomic profiles of 18 samples of S. kraussiana,
two samples of S. moellendorffii, and two samples of Lycopodium. Supplementary Table S1 provides
details on taxonomy assignments for all samples made with MEGAN–LCA analyses. The S. kraussiana
profiles from the nine disjunct locations tended to be very similar and distinct from those of the
other club moss species. Figure 3 shows the relative number of paired sequence reads in each
of the 18 samples of S. kraussiana that matched to bacterial and fungal genera implicated in plant
disease elsewhere. While the microbial profiles on S. kraussiana were relatively similar between
locations, Figure 3 shows significant variation in the frequencies of reads assigned to genera represented
by potential pathogens. Microbial profiling using DIAMOND database matching and taxonomic
assignment with MEGAN–LCA identified four genera of bacteria listed among the top 10 pathogenic
bacteria of plants [29]. These were Agrobacterium, Erwinia, Pseudomonas, and Xanthomonas. The
same bioinformatic analyses also identified four genera of fungi listed among the top 10 pathogenic
fungi of plants [29]. They were Botrytis, Magnaporthe, Colletotrichum, Fusarium, Ustilago, Melampsora,
and Puccinia. Other fungal genera identified representing putative pathogens were Dothistroma,
Pseudocercospora, Sphaerulina, Zymoseptoria, Aureobasidium, Leptosphaeria, Parastagonospora, Bipolaris,
Pyrenophora,
Genes 2018, 9,Setosphaeria, Verticillium, and Rhizoctonia.
x FOR PEER REVIEW 6 of 11
Figure
Figure 3. Genera
3. Genera representingpotentially
representing potentially pathogenic
pathogenic bacteria
bacteriaand
andfungi
fungion
onS.S.kraussiana exhibiting
kraussiana exhibiting
signs
signs of disease
of disease at at nine
nine locations.
locations.
Figure 4 visualizes the relative number of MEGAN–LCA assignments to bacterial and fungal
species implicated elsewhere in plant pathogenesis. Supplementary Table S2 details the read counts
used to construct Figure 4. Supplementary Table S3 provides results from comparative analyses
with Kaiju. Very similar trends were observed between Kaiju and DIAMOND–MEGAN analyses
in the relative number of taxonomic assignments made to bacterial and fungal taxa. A relativelyGenes 2019, 10, 106 6 of 9
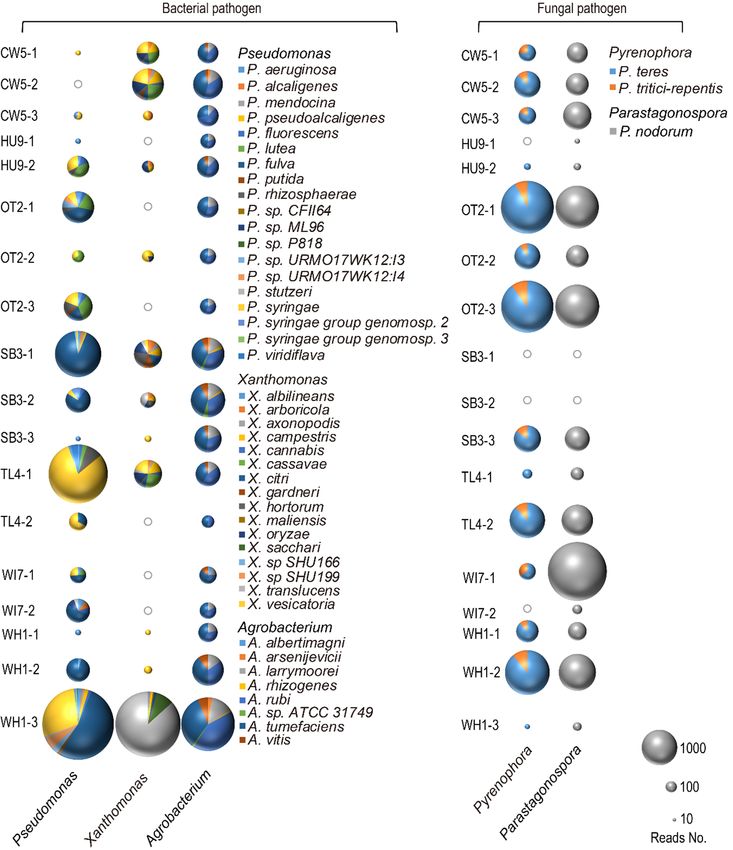
high number of reads were assigned to Pseudomonas syringae [29] at 12 subsites, including City Walk
Track (CW5-1and CW5-3), Earnies Track, Hunua Ranges (HU9-2), Otaika Valley, Wangarei (OT2-1,
OT2-2 and OT2-3), Spragg Bush, Waitakere Ranges (SB3-1and SB3-2), Tramline Track, Waitakere
Ranges (TL4-1and TL4-2), Waiheke Forest (WI7-1), and Whareora Rd, Wangarei (WH1-3). Xanthomonas
translucens [30] was identified at the subsites SB3-1, SB3-2, TL4-1, and WH1-3 and was most common
at WH1-3. Xanthomonas vesicatoria [31] was identified at 9 subsites (CW5-1, CW5-2, CW5-3, OT2-2,
SB3-1, SB3-3, TL4-1, WH1-1, and WH1-2). A smaller number of reads assigned to Agrobacterium rubi,
Agrobacterium tumefaciens, Agrobacterium larrymoorei and Agrobacterium vitis [32] occurred at almost
all subsites. All the above species are known to be pathogenic on different host plants under certain
conditions. Figure 4 shows that in terms of potential fungal pathogens, most reads were assigned to
the genera Pyrenophora and Parastagonospora (reads number > 2000). While not in the list of the top 10
fungal pathogens [33], Pyrenophora teres [34] and Pyrenophora tritici-repenti [35] are pathogens of barley
and wheat, and these species predominated at almost all of the subsites. Parastagonospora nodorum [36],
a pathogen of wheat, was also identified at most subsites (all except for SB3-1 and SB3-2).
Genes 2018, 9, x FOR PEER REVIEW 7 of 11
Figure 4. Three-dimensional bubble-pie
Figure 4. Three-dimensional plot
bubble-pie plotshowing species
showing species of potentially
of potentially pathogenic
pathogenic bacteria and
bacteria and
fungi on S.fungi on S. kraussiana
kraussiana at sevenat seven locations.The
locations. The relative
relative number
numberof reads assigned
of reads to each to
assigned species
eachis species is
indicated by the size and area of each bubble. Grey hollow circles indicate where no reads were
indicated by the size and area of each bubble. Grey hollow circles indicate where no reads were
assigned to the relevant subsite.
assigned to the relevant subsite.
Figure 4 visualizes the relative number of MEGAN–LCA assignments to bacterial and fungal
species implicated elsewhere in plant pathogenesis. Supplementary Table 2 details the read counts
used to construct Figure 4. Supplementary Table 3 provides results from comparative analyses with
Kaiju. Very similar trends were observed between Kaiju and DIAMOND–MEGAN analyses in the
relative number of taxonomic assignments made to bacterial and fungal taxa. A relatively high
number of reads were assigned to Pseudomonas syringae [29] at 12 subsites, including City Walk Track
(CW5-1and CW5-3), Earnies Track, Hunua Ranges (HU9-2), Otaika Valley, Wangarei (OT2-1, OT2-2Genes 2019, 10, 106 7 of 9
BWA mapping of the paired reads from S. kraussiana to ITS sequences from Parastagonospora
(P. phoenicicola and P. caricis) produced a low number of matches: 1–77 reads per subsite across all
populations. A lower number of the same read set mapped to Pestalotiopsis clavispora (1–8 reads).
Greater variation for the same read set mapped to Phoma selaginellicola (1–257 reads). As discussed
below, the low read number contributing to limited phylogenetic resolution of the sequenced ITS
regions makes interpretation of these observations problematic.
4. Discussion
Metagenomic profiling was conducted using DIAMOND–MEGAN–LCA short read sequence
analyses, and the findings corroborated using Kaiju. Both methods matched DNA sequence reads
against protein databases. Numerous fungal and bacterial species were identified that are known plant
pathogens. Potentially pathogenic Xanthomonas and Pseudomonas species occurred at high frequency on
some populations of Selaginella. Similarly, Pyrenophora, Bipolaris, and Parastagonospora were relatively
common pathogenic fungi also occurring on Selaginella. A significant level of variation in relative read
numbers for potential pathogens occurred between samples (Figure 3). This might in part be explained
by different extents of disease progression at different sites or in different stages of disease progression
of the sampled tissue. Differences in the pathogen dynamics resulting in disease progression could
also occur at the different sites. More intensive sampling, not possible with this initial survey, would
be required to evaluate these possibilities, and a weakness of the present study is the unknown
relationship between the appearance of necrotic symptoms on the plants and the state of disease.
Nevertheless. despite this shortcoming, it is interesting that Xanthomonas and Pseudomonas are
bacterial genera under consideration as bioherbicides for weeds elsewhere [16], and the large number
of reads associated with some diseased samples encourages investigation of these genera and the
species identified as potential biological control agents for Selaginella in New Zealand. In further
evaluating their biocontrol potential, future studies should include sampling of necrotic and visibly
healthy tissues at sites where S. krausianna is found, as well as more intensive sampling of Lycopodium
Lycopodiella and Huperzia species, as their sampling was very limited in the present study.
As both DIAMOND–MEGAN–LCA and Kaiju analyses involved database matching of translated
reads to protein databases, future work to complement our findings in the present study could involve
matching the sequenced reads to fungal ITS and 18S rDNA databases. These markers do not produce
the phylogenetic resolution of whole genome shotgun sequences, but there is currently much greater
phylogenetic representation of diverse fungal phylogenetic lineages for rDNA loci than for coding
regions and genomes [37,38]. Neither MEGAN nor Kaiju analyses identified Pestalotiopsis clavispora or
Phoma selaginellicola on any of the plants surveyed. These fungal species had previously been cultured
from New Zealand Selaginella kraussiana and were identified based on ITS sequence analyses [21,22].
Genome information from both species was poorly represented in the databases used by Kaiju and
MEGAN in the present study, and thus it is possible that lack of representation for these and possibly
other fungal species in our results might be explained by poor database representation. This question
was investigated in the present work by mapping the paired end reads from the S. kraussiana samples
to ITS sequences from two fungal species previously isolated on Selaginella in New Zealand, and
also mapping the same read sets to the ITS region of a fungal species that was identified by our
protein-based homology assignments in the present study. Overall, the number of reads mapping to all
reference sequences was very low, and this finding cautions against over interpretation of our mapping
results with BWA. A more thorough investigation of this issue is warranted, and this will require
specifically targeting rDNA loci during Illumina library preparation to ensure even and appropriate
coverage of marker regions for statistical analyses.
Supplementary Materials: The following are available online at http://www.mdpi.com/2073-4425/10/2/106/s1,
Table S1: Taxonomy assignments for all samples made with MEGAN–LCA; Table S2: Assigned paired read counts
used to construct Figure 4; Table S3: Comparison of MEGAN–LCA and Kaiju assignments.Genes 2019, 10, 106 8 of 9
Author Contributions: Conceptualization and project design: D.B., P.J.L., Z.D., N.W. Sampling: D.B., N.W., O.E.,
C.R. Wet lab work: P.A.M., O.E., C.R. Bioinformatic analyses: Z.D., P.J.L. Writing and Review Z.D., P.J.L., D.B.
Funding: We gratefully acknowledge financial support provided by the Auckland Council, Unitec Institute of
Technology Applied Molecular Solutions Focus funding and the NZ BioProtection Research Centre. Z.D. received
funding for an internship at Massey University provided by the China Scholarship Council.
Acknowledgments: We thank Sarah Killick for technical support.
Conflicts of Interest: We declare no conflicts of interest.
References
1. Keane, M.J.; Crawley, R.M.J. Exotic plant invasions and the enemy release hypothesis. Trends Ecol. Evol. 2002,
17, 164–170. [CrossRef]
2. Burkhart, K.; Nentwig, W. Control of Impatiens glandulifera (Balsaminaceae) by antagonists in its invaded
range. Invasive Plant Sci. Manag. 2008, 1, 352–358. [CrossRef]
3. Flory, S.L.; Clay, K. Pathogen accumulation and long-term dynamics of plant invasions. J. Ecol. 2013, 101,
607–613. [CrossRef]
4. Najberek, K.; Nentwig, W.; Olejniczak, P.; Król, W.; Baś, C.; Solarz, W. Factors limiting and promoting
invasion of alien Impatiens balfourii in Alpine foothills. Flora 2017, 234, 224–232. [CrossRef]
5. Diez, J.M.; Dickie, I.; Edwards, G.; Hulme, P.E.; Sullivan, J.J.; Duncan, R.P. Negative soil feedbacks accumulate
over time for non-native plant species. Ecol. Lett. 2010, 13, 803–809. [CrossRef] [PubMed]
6. Mitchell, C.E.; Blumenthal, D.; Jarošík, V.; Puckett, E.E.; Pyšek, P. Controls on pathogen species richness in
plants’ introduced and native ranges: Roles of residence time, range size and host traits. Ecol. Lett. 2010, 13,
1525–1535. [CrossRef] [PubMed]
7. Chen, B.M.; Li, S.; Liao, H.X.; Peng, S.L. Do forest soil microbes have the potential to resist plant invasion? A
case study in Dinghushan Biosphere Reserve (South China). Acta Oecol. 2017, 81, 1–9. [CrossRef]
8. Stricker, K.; Harmon, P.; Goss, E.; Clay, K.; Flory, S.L. Emergence and accumulation of novel pathogens
suppress an invasive species. Ecol. Lett. 2016, 19, 469–477. [CrossRef]
9. Crous, C.J.; Burgess, T.I.; Le Roux, J.J.; Richardson, D.M.; Slippers, B.; Wingfield, M.J. Ecological
disequilibrium drives insect pest and pathogen accumulation in non-native trees. AoB Plants 2017, 9,
plw081. [CrossRef]
10. Dostál, P.; Müllerová, J.; Klinerová, P.; Pyšek, T.; Pergl, J. The impact of an invasive plant changes over time.
Ecol. Lett. 2013, 16, 1277–1284. [CrossRef]
11. Mitchell, C.E.; Power, A.G. Release of invasive plants from fungal nature, and viral pathogens. Nature 2003,
421, 625–627. [CrossRef] [PubMed]
12. Barton, J. How good are we at predicting the field host-range of fungal pathogens used for classical biological
control of weeds? Biol. Control 2004, 31, 99–122. [CrossRef]
13. Ellison, C.A.; Barreto, R.W. Prospects for the management of invasive alien weeds using co-evolved fungal
pathogens: A Latin American perspective. Biol. Invasions 2004, 6, 23–45. [CrossRef]
14. Barton, J.; Fowler, S.V.; Gianotti, A.F.; Winks, C.J.; de Beurs, M.A.; Arnold, G.C.; Forrester, G. Successful
biological control of mist flower (Ageratina riparia) in New Zealand: Agent establishment, impact and benefits
to the native flora. Biol. Control 2007, 40, 370–385. [CrossRef]
15. Scott, J.K.; Yeoh, P.B.; Michael, P.J. Methods to select areas to survey for biological control agents: An example
based on growth in relation to temperature and distribution of the weed Conyza bonariensis. Biol. Control
2016, 97, 21–30. [CrossRef]
16. Harding, D.P.; Raizada, M.N. Controlling weeds with fungi, bacteria and viruses: A review. Front. Plant Sci.
2015, 6, 1–14. [CrossRef]
17. Van Leeuwen, J.F.N.; Schäfer, H.; van der Knaap, W.O.; Rittenour, T.; Björck, S.; Ammann, B. Native or
introduced? Fossil pollen and spores may say. An example from the Azores Islands. Neobiota 2005, 6, 27–34.
18. Nessia, H.; Dale, A.; Perrott, J.; Waipara, N.; Aguilar, G.; Blanchon, D. Comparison of species richness and
frequency cover of forest floor plants and lichens in sites invaded and uninvaded by the invasive club moss
Selaginella kraussiana (Kunze) A. Braun. Plant Prot. Q. 2014, 29, 66–70.
19. Cheeseman, T.F. Contributions to a fuller knowledge of the flora of New Zealand, No 6. Trans. N. Z. Inst.
1919, 51, 85–92.Genes 2019, 10, 106 9 of 9
20. Barton, J. Prospects for Biological Control of African Club Moss (Selaginella kraussiana: Selaginellaceae); Landcare
Reserch Contract Report: LC0405/066; Auckland Regional Council: Auckland, New Zealand, 2005; pp. 1–24.
21. McClymont, M.; Waipara, N.; Nessia, H.; Blanchon, D.J. First record of Phoma selaginellicola on Selaginella
kraussiana (African clubmoss): An invasive plant species in New Zealand. Plant Pathol. Quar. 2013, 3, 140–144.
[CrossRef]
22. McClymont, M.; Nessia, H.; Waipara, N.; Blanchon, D.J. First report of Pestalotiopsis clavispora from Selaginella
kraussiana (African club moss): An invasive plant species in New Zealand. Australas. Plant Dis. Notes 2013, 8,
79–80. [CrossRef]
23. Cox, M.P.; Peterson, D.A.; Biggs, P.J. SolexaQA: At-a-glance quality assessment of Illumina second-generation
sequencing data. BMC Bioinform. 2010, 11, e485. [CrossRef] [PubMed]
24. Bolger, A.M.; Lohse, M.; Usadel, B. Trimmomatic: A flexible trimmer for Illumina sequence data.
Bioinformatics 2014, 30, 2114–2120. [CrossRef] [PubMed]
25. Buchfink, B.; Xie, C.; Huson, D.H. Fast and Sensitive Protein Alignment using DIAMOND. Nat. Methods
2015, 12, 59–60. [CrossRef] [PubMed]
26. Huson, D.H.; Beier, S.; Flade, I.; Górska, A.; El-hadidi, M. MEGAN Community Edition-Interactive
Exploration and Analysis of Large-Scale Microbiome Sequencing Data. PLoS Comput. Biol. 2016, 12,
e1004957. [CrossRef] [PubMed]
27. Menzel, P.; Ng, K.L.; Krogh, A. Fast and sensitive taxonomic classification for metagenomics with Kaiju.
Nat. Commun. 2016, 7, e11257. [CrossRef]
28. Li, H.; Durbin, R. Fast and accurate short read alignment with Burrows-Wheeler Transform. Bioinformatics
2009, 25, 1754–1760. [CrossRef] [PubMed]
29. Mansfield, J.; Genin, S.; Magori, S.; Citovsky, V.; Sriariyanum, M.; Ronald, P.; Dow, M.; Verdier, V.; Beer, S.V.;
Machado, M.A.; et al. Top 10 plant pathogenic bacteria in molecular plant pathology. Mol. Plant Pathol. 2012,
13, 614–629.
30. Langlois, P.A.; Snelling, J.; Hamilton, J.P.; Bragard, C.; Koebnik, R.; Verdier, V.; Triplett, L.R.; Blom, J.;
Tisserat, N.A.; Leach, J.E. Characterization of the Xanthomonas translucens Complex Using Draft Genomes,
Comparative Genomics, Phylogenetic Analysis, and Diagnostic LAMP Assays. Phytopathology 2017, 107,
519–527. [CrossRef]
31. Vancheva, T.; Lefeuvre, P.; Bogatzevska, N.; Moncheva, P.; Koebnik, R. Draft Genome Sequences of Two
Xanthomonas euvesicatoria strains from the Balkan Peninsula. Genome Announc. 2015, 3, 3–4. [CrossRef]
32. Gelvin, S.B. Agrobacterium in the Genomics Age. Plant Physiol. 2009, 150, 1665–1676. [CrossRef] [PubMed]
33. Dean, R.; Van Kan, J.A.L.; Pretorius, Z.A.; Hammond-Kosack, K.E.; Di Pietro, A.; Spanu, P.D.; Rudd, J.J.;
Dickman, M.; Kahmann, R.; Ellis, J.; et al. The Top 10 fungal pathogens in molecular plant pathology. Mol.
Plant Pathol. 2012, 13, 414–430. [CrossRef] [PubMed]
34. Liu, Z.; Ellwood, S.R.; Oliver, R.P.; Friesen, T.L. Pyrenophora teres: Profile of an increasingly damaging barley
pathogen. Mol. Plant Pathol. 2010, 12, 1–19. [CrossRef] [PubMed]
35. Abdullah, S.; Sehgal, S.K.; Ali, S.; Liatukas, Z.; Ittu, M.; Kaur, N. Characterization of Pyrenophora tritici-repentis
(Tan Spot of Wheat) Races in Baltic States and Romania. Plant Pathol. J. 2017, 33, 133–139. [CrossRef]
[PubMed]
36. Richards, J.K.; Wyatt, N.A.; Liu, Z.; Faris, J.D.; Friesen, T.L. Reference Quality Genome Assemblies of Three
Parastagonospora nodorum Isolates Differing in Virulence on Wheat. G3 Genes Genom. Genet. 2018, 8, 393–399.
[CrossRef] [PubMed]
37. Yarza, P.; Yilmaz, P.; Panzer, K.; Glöckner, F.O.; Reich, M. A phylogenetic framework for the kingdom Fungi
based on 18S rRNA gene sequences. Mar. Genom. 2017, 36, 33–39. [CrossRef] [PubMed]
38. Schoch, C.L.; Seifert, K.A. Reply to Kiss: Internal transcribed spacer (ITS) remains the best candidate as a
universal DNA barcode marker for Fungi despite imperfections. Proc. Natl. Acad. Sci. USA 2012, 109, e1812.
[CrossRef]
© 2019 by the authors. Licensee MDPI, Basel, Switzerland. This article is an open access
article distributed under the terms and conditions of the Creative Commons Attribution
(CC BY) license (http://creativecommons.org/licenses/by/4.0/).You can also read