Nebula: ultra-efficient mapping-free structural variant genotyper - Oxford Academic Journals
←
→
Page content transcription
If your browser does not render page correctly, please read the page content below
Published online 27 January 2021                                                              Nucleic Acids Research, 2021, Vol. 49, No. 8 e47
                                                                                                                      doi: 10.1093/nar/gkab025

Nebula: ultra-efficient mapping-free structural variant
genotyper
Parsoa Khorsand1,* and Fereydoun Hormozdiari                                        1,2,3,*

1
 Genome Center, UC Davis, Davis, California, 95616, USA, 2 UC Davis MIND Institute, Sacramento, California,
95817, USA and 3 Department of Biochemistry and Molecular Medicine, UC Davis, Sacramento, California, 95817,
USA

Received November 18, 2020; Revised January 03, 2021; Editorial Decision January 05, 2021; Accepted January 11, 2021

                                                                                                                                                              Downloaded from https://academic.oup.com/nar/article/49/8/e47/6121467 by guest on 31 August 2021
ABSTRACT                                                                        of efficient and accurate discovery and genotyping of these
                                                                                types of variants. It is hypothesized that lack of comprehen-
Large scale catalogs of common genetic variants (in-                            sive study of SVs is one of the contributing factors among
cluding indels and structural variants) are being cre-                          others to the missing heritability gap observed in complex
ated using data from second and third generation                                disorders (7,8).
whole-genome sequencing technologies. However,                                     The advent of high-throughput sequencing (HTS) tech-
the genotyping of these variants in newly sequenced                             nologies has made it possible to understand the contribu-
samples is a nontrivial task that requires extensive                            tion of SVs in diseases and evolution. In the 1000 Genomes
computational resources. Furthermore, current ap-                               Project (1KG) more than 42 000 SVs were discovered and
proaches are mostly limited to only specific types of                           genotyped in over 2500 samples (9). Recently, a few samples
variants and are generally prone to various errors and                          (e.g. CHM1 and CHM13) were sequenced using long-read
ambiguities when genotyping complex events. We                                  technologies (i.e. PacBio). A comparison of the SV predic-
                                                                                tions made using the state-of-the-art computational meth-
are proposing an ultra-efficient approach for geno-
                                                                                ods (e.g. LUMPY (10), DELLY (11), TARDIS (12) and
typing any type of structural variation that is not lim-                        Pindel (13)) using the short-read HTS data against the calls
ited by the shortcomings and complexities of cur-                               produced using long-read data indicated that many SVs
rent mapping-based approaches. Our method Neb-                                  (> 50%) are missed by our best practices using short-read
ula utilizes the changes in the count of k-mers to                              sequencing data (14). Thus, we are in need of approaches
predict the genotype of structural variants. We have                            which can efficiently genotype these newly found SVs in a
shown that not only Nebula is an order of magnitude                             large number of WGS samples.
faster than mapping based approaches for genotyp-                                  With WGS data of additional samples being produced
ing structural variants, but also has comparable ac-                            at a breathtaking rate, an approach to accurately and ef-
curacy to state-of-the-art approaches. Furthermore,                             ficiently genotype the (common) SVs in newly sequenced
Nebula is a generic framework not limited to any                                samples is needed. In addition, with more comprehensive
                                                                                sets of SVs being predicted using long-read technologies we
specific type of event. Nebula is publicly available
                                                                                would like to be able to genotype these newly discovered
at https://github.com/Parsoa/Nebula.                                            SVs in the samples that have been already processed.
                                                                                   The current approaches for genotyping SVs using WGS
INTRODUCTION                                                                    data are mainly based on first mapping the reads to the ref-
Structural variants (SVs) are defined as medium and large                       erence genome and then predicting the genotype (15,16).
size (>50 bp) genomic alterations. SVs have many different                      This framework has three main drawbacks. First, the map-
types, e.g. deletions, insertions, duplication, transposon in-                  ping step is resource intensive. Second, these approaches are
sertions and inversions (1–4). It has become clear that SVs                     mostly tailored to specific types of variants (SNV, small in-
are a major contributing factor in diseases (5) and evolution                   dels and large CNVs). Third, genotyping any variant close
(6). However, efficient and accurate genotyping of all types                    to repeats in the reference genome would be less accurate
of SVs using whole-genome sequencing (WGS) data is not a                        due to the potential of inaccurate mapping.
trivial task. In many of the large scale genomic studies SVs                       Mapping-free approaches are becoming popular for
are being ignored or are merely an afterthought. One of the                     different genomic and transcriptome applications. The
main reasons behind SVs not being as thoroughly studied as                      mapping-free approaches are not limited by the shortcom-
other types of variants such as SNVs, is due to complexity                      ings of the mapping algorithms and tend to be much more

* To
   whom correspondence should be addressed. Tel: +1 530 754 9725; Email: fhormozd@ucdavis.edu
Correspondence may also be addressed to Parsoa Khorsand. Email: pkhorsand@ucdavis.edu


C The Author(s) 2021. Published by Oxford University Press on behalf of Nucleic Acids Research.
This is an Open Access article distributed under the terms of the Creative Commons Attribution License (http://creativecommons.org/licenses/by/4.0/), which
permits unrestricted reuse, distribution, and reproduction in any medium, provided the original work is properly cited.
e47 Nucleic Acids Research, 2021, Vol. 49, No. 8 PAGE 2 OF 8
efficient. Mapping-free transcriptome analysis tools such as need to map the reads to the reference genome (genotyp-
Kallisto (17) and Salmon (18) have been very helpful in ef- ing phase). This is done by counting the k-mers in the WGS
ficient and accurate quantification of RNAseq data. These reads of the new sample(s) and predicting genotypes using
approaches have also been recently utilized successfully in a likelihood model.
variant discovery.
One of the first tools to introduce a mapping-free method
for variant discovery is Cortex (19). Cortex introduces the Likelihood model
concept of colored de bruijn graphs to compare the k-mers The key assumption in Nebula is that each SV will increase
from different samples to predict variants between the sam- and/or decrease the copy number of a specific set of k-
ples (19). Cortex was also used successfully for predicting mers in the genome. Note that the count of each k-mer in
variants in the 1000 Genomes Project. The method DIS- the WGS reads of a sample is directly correlated with the
COSNP (20) was one of the first approaches developed copy number of the k-mer in the corresponding genome. We
for predicting SNPs efficiently using k-mers counts. This develop a likelihood model to calculate the probability of
approach was later developed into DISCOSNP++ to pre-
Downloaded from https://academic.oup.com/nar/article/49/8/e47/6121467 by guest on 31 August 2021
different genotypes ({0/0, 0/1, 1/1}) per SV based on the
dict indels between multiple sequenced samples using raw counts of k-mers.
unassembled reads (21). We define a unique k-mer as one that appears in ex-
Mapping-free approaches have also have gained traction actly one loci in the sample’s genome. For a given sam-
in predicting somatic variants between a normal sample and ple, we assume the number of reads containing a unique
the matching tumor. NovoBreak (22) is one such tool that k-mer that are coming from each haplotype to follow a nor-
utilizes k-mer counts to predict different types of somatic mal distribution N (μh , σh2 ). We also model the total num-
variants between tumor and normal samples using whole- ber of reads containing that k-mer (i.e., the k-mer’s count)
genome sequencing data. Another application of mapping- in a diploid genome as the summation of the two normal
free approaches is discovery of de novo variants in families. distributions representing the number of reads containing
The tools Scalpel (23), COBASI (24) and Kevlar (25) are the k-mer in each haplotype as N (μ, σ 2 ) = N (μ1 , σ12 ) +
mapping free approach for accurate discovery of de novo
variants using whole-exome sequenced or whole-genome N (μ2 , σ22 ) where μi and σi2 are mean and variance for the
sequenced samples. corresponding haplotype. However as we generally don’t
Fast and accurate genotyping of common variants is an- know which haplotype a sequencing read is from, we will di-
other recent application of the mapping-free framework. rectly estimate the sample-wide parameters μ and σ 2 rather
The tools LAVA (26) and VarGeno(27) are developed for than the haplotype-specific ones. For this, we select a large
fast genotyping of common SNPs using k-mer counts. Fur- number of unique k-mers from conserved regions of the
thermore, the tool MALVA (28) is a recent mapping-free genome (e.g. exons) and count them in the sequencing reads
method for genotyping both SNPs and indels. of the sample. By further assuming that the sequencing cov-
Finally, mapping-free approaches have also been utilized erage is equal for both haplotypes, the count of a unique k-
in improving the association studies using whole-genome mer present on only one haploid can be approximated using
sequencing data (29). The tool HAWK (29) is capable of the normal distribution N (μ/2, σ 2 /2). Finally, the count of
fast and accurate discovery of variants associated with phe- a k-mer not expected to be present in the genome is esti-
notypes of interest by comparing the k-mers frequencies be- mated by setting μ to zero and using a small fixed number
tween cases and controls. for the variance. This provides the basis of the model that
The growing list of mapping-free methods and their ap- we use to calculate likelihood of SVs genotypes based on
plications has also resulted in development of several tools the k-mer counts.
for fast and accurate k-mer quantification. Some of the
tools used for fast k-mer quantification include JellyFish
k-mer extraction
(30), Khmer (31), DSK (32) and KMC (33).
Here we are proposing a novel mapping-free approach, Nebula uses the coordinates of the input SVs, the reference
Nebula, that utilizes k-mer counts for efficient and accu- genome and mapped reads of WGS sample(s) on which the
rate genotyping of (common) SVs in any whole-genome se- genotype of the SVs of interest are known to extract k-mers
quenced sample. whose copy number is affected by the SVs. These k-mers
either cross the SV’s breakpoint or fall inside the region that
is affected by the SV.
METHODS
Sequencing reads that cross a SV’s breakpoint are usu-
Nebula is a mapping-free approach for accurate and effi- ally soft-clipped when mapped to the reference genome. For
cient genotyping of SVs. Nebula is a two-stage approach each SV, Nebula looks at soft-clipped reads mapping near
and consists of a k-mer extraction phase and a genotyping its breakpoints and selects k-mers that overlap the clipped
phase (Figure 1). Given as input a set of SV coordinates part of the read (Figure 2).
(BED/VCF), the reference assembly (FASTA), and a set of Nebula also uses the reference genome to extract addi-
mapped samples on which the genotype of the input SVs is tional k-mers from within the region that is affected by a
already known (BAM), Nebula extracts a collection of k- SV (e.g. inside the deleted region for a deletion or from the
mers that represent the input SVs (k-mer extraction phase). sequence that would be inserted into the genome for an in-
These extracted k-mers will then be used to genotype the sertion). We also extract unique k-mers that cross the break-
same set of SVs on any new WGS sample(s) without the points from the reference genome.PAGE 3 OF 8 Nucleic Acids Research, 2021, Vol. 49, No. 8 e47
Downloaded from https://academic.oup.com/nar/article/49/8/e47/6121467 by guest on 31 August 2021
Figure 1. An overview of the entire Nebula pipeline. The upper half shows the k-mer extraction stage which takes as input a set of SV coordinates, the
reference assembly, and a set of samples on which the genotypes of these SVs is known. The k-mer extraction stage selects a collection of k-mers to be
used for genotyping. The bottom half shows the SV genotyping phase, which uses the k-mers extracted earlier to genotype the input SVs on any number
of newly sequenced samples without mapping the reads.
types. We use each k-mer independently to genotype its cor-
responding SV and filter those k-mers that do not predict
the correct genotype. After filtering, the remaining k-mers
are exported as the output of the k-mer extraction phase.
The likelihood of genotype g based on k-mer k with count
ck is calculated using the normal distribution as L(g|k) =
p(k|g) = p(ck |N (μk,g , σk,g
2
)) where μg,k and σg,k
2
are derived
from the sample-wide mean μ and variance σ based on the
2
expected copy number of the k-mer k for genotype g. For
example, for an insertion SV, a k-mer selected from the in-
serted sequence is expected to be present on both haploids
for a 1/1 genotype with μ1/1,k = μ and σ1/1,k 2
= σ 2 and on
only one haploid for a 1/0 genotype with μ1/0,k = μ/2 and
σ1/0,k
2
= σ 2 /2. We calculate the likelihood of all three possi-
ble genotypes using the above formulation and choose the
one with the maximum likelihood as the genotype predic-
tion.
Genotyping
Once k-mers have been extracted for a set of SVs, the same
set of SVs can be genotyped on any new WGS sample(s)
without the need to map the reads. The k-mers are counted
Figure 2. k-mer extraction clipped reads for a deletion (A) and an insertion
on the sample and genotypes are predicted using an ex-
(B). Red and green segments of the reads are soft-clipped by the aligner and tension of the likelihood model. For a SV supported by
correspond to the similarly colored regions of the alternate and reference multiple k-mers, the likelihood of each possible genotype
haplotypes. g ∈ {0/0, 0/1, 1/1} can be calculated as L(g|k1 , k2 , k3 , ...) =
p(k1 , k2 , k3 , ...|g) where each ki represents a different k-mer.
Note that the counts of k-mers corresponding to the same
With the k-mers selected, Nebula scans the reference SV might not be independent as the k-mers may overlap
genome to filter any k-mer that also occurs in loci not im- one another. However, if we assume independence between
pacted by the input SVs. Finally, the remaining k-mers are k-mer counts, we can approximate the above likelihood by
counted on each of the input sample with known SV geno- calculating the probability as the multiplication of probabil-e47 Nucleic Acids Research, 2021, Vol. 49, No. 8 PAGE 4 OF 8
ities of individual k-mers given the genotype (i.e. i p(ki |g)). running the k-mer extraction phase, Nebula found k-mers
Note that p(ki |g) is calculated as p(cki |N (μg,ki , σg,k
2
i
)) where to genotype 11330 (98%) of the simulated SVs.
the random variable cki is the count of k-mer ki in the sam- During the second stage of the simulation, another
ple. Furthermore, the values μg,ki and σg,k 2
are derived from diploid genome was constructed from GRCh38 and was
i
sample-wide μ and σ according to the genotype g. We calcu- randomly mutated with the same set of SVs but with all
late the likelihood for all three possible genotypes 1/1, 1/0 three possible genotypes (0/0, 0/1 and 1/1) allowed. Paired-
and 0/0 for each SV and choose the one with the maximum end short reads were generated from this genome at 30×
likelihood as our prediction. coverage in FASTQ format and the extracted k-mers were
used to genotype the sample.
The entire procedure was also repeated at 10× coverage
Implementation to measure Nebula’s resilience to low coverage. For the 10×
Nebula is implemented entirely in C++ and is heavily par- simulation, k-mers could be extracted for 11304 (97.8%)
allelized using OpenMP (34). To improve speed and reduce SVs.
We compared Nebula’s predictions against those of the
Downloaded from https://academic.oup.com/nar/article/49/8/e47/6121467 by guest on 31 August 2021
memory usage, k-mers are hashed into integer values and
string comparison operations are implemented in binary mapping-based approaches SVTyper (16) and Delly (11),
arithmetic. This allows Nebula to count millions of k-mers the graph-based approach Paragraph (38) and the k-mer-
in WGS reads at a rate of >500 000 reads per second using based approach BayesTyper (39). Due to limitation of SV-
a single processor core. typer and Delly on genotyping long insertions (40), we
To increase the accuracy of k-mer counts, Nebula keeps have excluded these tools from the comparison for inser-
the immediate left and right k-mers surrounding a selected tions. Note that none of the mentioned methods except
k-mer during the extraction phase and checks that at least BayesTyper can genotype unmapped samples in FASTQ
one of these k-mers exists around the k-mer in a sequenc- format directly and instead require mapped reads as input.
ing read before incrementing the count. This is discussed in We calculated four different measures of accuracy for
more detail in the Supplementary Materials. each method: The true genotyping rate (TGR) is defined as
Although Nebula is meant to genotype unmapped the number of correct genotype calls for each tool divided
FASTQ files, k-mers can also be counted in SAM, BAM and by the total number of input events. The false genotyping
CRAM files with slight differences in performance between rate (FGR) is similarly defined as the number of false geno-
the different formats due to parsing and decoding. Unlike type calls made by a tool divided by the total number of
many mapping-based tools that require certain fields in in- calls made by that tool. Precision is defined as the number
put VCF files, Nebula only requires the SV coordinates (and of true positive calls divided by all the positive calls (1/1 and
optionally the inserted sequence for insertions). For the ex- 1/0) made by a tool and finally recall is defined as the num-
periments presented in this manuscript, we have also devel- ber of true positive calls produced by a tool divided by the
oped a Docker version of Nebula that can be easily deployed total number of 1/1 or 1/0 SVs present on the sample. The
to various cloud computing platforms such as Cancer Ge- detailed results for each simulation, separated by event type
nomics Cloud (35). are presented in Figure 3 and Supplementary Figure S1. In
both simulations, Nebula has produced comparable results
to state-of-the-art genotyping approaches without requir-
RESULTS ing the mapping of the reads to the reference genome.
We utilized both simulations and real data to quantify
and evaluate the performance of Nebula using high qual-
ity SV predictions from long-read sequencing data on 1KG Real data
samples HG00514 (CHS trio, child), HG00733 (PUR trio,
child) and NA19240 (YRI trio, child) (36). We also used real WGS data for experimental evaluation
of Nebula. We considered the union of all insertions, dele-
tions and inversions reported from non-repeat regions of
Simulation
the HG00514 and HG00733 genomes as the set of input
An extensive WGS simulation was performed to evaluate SVs (36). We used these two samples to extract k-mers for
Nebula’s performance for accurately genotyping SVs. The the SVs and used the k-mers to genotype a third sample
simulation consists of two stages: first we mutated a genome NA19240 with Nebula. We also used Delly, SVTyper, Para-
with the set of SVs from the 1KG dataset and used it for k- graph and BayesTyper to genotype the selected set of SVs
mer extraction. Second, we simulated a subset of these SVs on NA19240 and validated their predictions against the
on a new sample and used the extracted k-mers to genotype 1KG callset.
the simulated SVs. For evaluation, we only considered SVs that could be cor-
During the first step, a diploid GRCh38 genome was mu- rectly genotyped on HG00514 and HG00733 using at least
tated with the union of all insertions and deletions reported one of the four methods (Delly, SVTyper, Paragraph and
for samples HG00514 and HG00733 (11551 total SVs) with BayesTyper) in the comparison. For consistency in validat-
random genotype assignments of 1/0 or 1/1. Short paired- ing genotypes, we have merged overlapping deletions and
end sequencing reads were simulated from this diploid sim- insertions (less than 10bp apart) in different samples into a
ulated genome using wgsim (https://github.com/lh3/wgsim) single event. A total of 4810 deletions, 7511 insertions and
at 30x coverage and mapped using BWA-mem (37). After 81 inversions were considered for our evaluation.PAGE 5 OF 8 Nucleic Acids Research, 2021, Vol. 49, No. 8 e47
Downloaded from https://academic.oup.com/nar/article/49/8/e47/6121467 by guest on 31 August 2021
Figure 3. Comparison of different accuracy metrics between Nebula and
other methods when genotyping SVs on the 30× simulation.
We use the same metrics introduced earlier for compar-
ing the performance of different methods and we observe
that Nebula consistently performs equal to or better than
the other state-of-the-art methods (Figure 4). As the input
callset does not include genotypes for inversions and only
marks them as present or not, we have only reported pre-
cision and recall for inversions. We could not genotype the
inversions using Delly or BayesTyper and we have thus re-
moved these tools from the comparison for inversions. Note
that BayesTyper requires exact SV breakpoints for optimal Figure 4. Comparison of different accuracy metrics between Nebula and
performance; as a result, its performance for insertions and other methods when genotyping SVs on NA19240.
deletions may have been negatively affected due to inexact
breakpoints for some of the SVs in the dataset.
We also compared the performance of different tools
Time and memory performance
for genotyping SVs in repeat regions of the genome. We
used each method to genotype SVs reported in HG00514 Nebula’s main advantage is its ability to directly genotype
and HG00733 on the NA19240 sample. Nebula and other unmapped samples with high efficiency and comparable ac-
methods perform relatively well on SVs involving mobile curacy to the state-of-the-art mapping-based genotypers.
elements (e.g., SINE or LINE elements) and all methods Furthermore, Nebula is not limited to specific types of SVs
achieve a precision of over 90% (Supplementary Figure S2). and can genotype deletions, insertions, inversions, or other
However, on SVs incorporating genomic satellite and tan- types of SVs using a universal algorithm. We measured the
dem repeat regions all tools perform relatively poorly with runtime and peak memory usage of Nebula and other tools
every tool having a FGR of at least 40% (Supplementary for genotyping NA19240 (Figure 5).
Figure S3). Our results indicate novel methodological de- Assuming k-mers have already been extracted for a com-
velopments are required to accurately genotype these types mon set of SVs, Nebula can be as much as 40 times
of SVs. faster than mapping-based methods in genotyping newly se-e47 Nucleic Acids Research, 2021, Vol. 49, No. 8 PAGE 6 OF 8
Downloaded from https://academic.oup.com/nar/article/49/8/e47/6121467 by guest on 31 August 2021
Figure 5. Comparison of single-thread runtime (A) and peak memory us-
age (B) of Nebula and other genotyping tools while genotyping 12321
insertion and deletion SVs on unmapped NA19240 reads. Nebula and
BayesTyper are k-mer-based methods and don’t require read-mappings.
Delly and SVtyper mainly parallelize over the number of input samples
and don’t benefit from multiple threads when genotyping a single sample.
Peak memory usage excludes the memory usage of BWA-mem (peak mem-
ory usage of BWA-mem mapping was 16GB).
quenced samples. This is particularly useful in large studies
with hundreds to thousands of samples, where Nebula can
be efficiently used to genotype common SVs on the entire
cohort an order of magnitude faster than other approaches.
Nebula also has advantages when genotyping mapped
samples. For a mapping-based genotyper, the sequenc-
ing reads should be mapped against the same reference
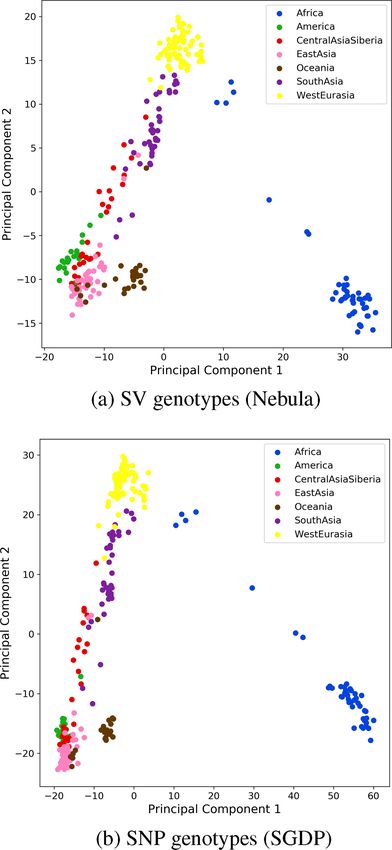
genome version that the SV coordinates are from; how- Figure 6. Population clustering of SGDP samples.
ever, once Nebula has extracted k-mers for a set of SVs re-
ported against a certain reference genome (e.g. GRCh38),
it can genotype them on samples mapped to other refer- On average, we see about 19% homozygous and 24% het-
ence genome versions (e.g. GRCh37) directly and without erozygous genotype predictions among all samples. We ex-
the need to remap the samples or lift SV coordinates. pect the genotypes to cluster samples based on geographical
origin. For this, we preformed a principal component anal-
ysis (PCA) on the SV genotypes and plotted the two most
Simons Genome Diversity Project Data (SGDP)
significant components (Figure 6). The PCA clearly sepa-
We used k-mers extracted for a total of 14103 insertion and rates populations of different continents with a greater level
deletion selected from the three 1KG samples HG00514, of separation between Africa and the rest (Figure 6A). We
HG00733 and NA19240 to genotype the entire set of 279 repeated the PCA analysis using one million randomly se-
samples from the Simons Genome Diversity Project (41) lected SNP calls from the Simons Genome Diversity Project
stored in BAM format on the cloud computation platform (41) and plotted the two most significant components (Fig-
Cancer Genomics Cloud (CGC) (35). ure 6B). The plot from Nebula’s genotypes captures thePAGE 7 OF 8 Nucleic Acids Research, 2021, Vol. 49, No. 8 e47
same structure as SGDP’s SNP calls, showing the accuracy FUNDING
of our method for population studies.
Sloan Research Fellowship [FG-2017-9159, in part];
The 1KG SVs are based on GRCh38 coordinates, how-
UC-Davis funding (to F.H.). Funding for open access
ever the SGDP samples are mapped against GRCh37. With
charge: Sloan Research Fellowship.
Nebula’s modest resource requirements and independence
Conflict of interest statement. None declared.
from mapping, each sample was genotyped accurately in
under an hour and at a cost of $0.30 per sample without
the need to remap the reads to GRCh38.
REFERENCES
1. Alkan,C., Coe,B.P. and Eichler,E.E. (2011) Genome structural
DISCUSSION variation discovery and genotyping. Nat. Rev. Genet., 12, 363.
2. Medvedev,P., Stanciu,M. and Brudno,M. (2009) Computational
We have presented here, Nebula, a novel approach for ultra- methods for discovering structural variation with next-generation
efficient and accurate genotyping of any type of SV with- sequencing. Nat. Methods, 6, S13–S20.
Downloaded from https://academic.oup.com/nar/article/49/8/e47/6121467 by guest on 31 August 2021
out the need to map the reads to the reference genome. We 3. Feuk,L., Carson,A.R. and Scherer,S.W. (2006) Structural variation in
have demonstrated that k-mers can act as a lightweight and the human genome. Nat. Rev. Genet., 7, 85–97.
4. Vendrell-Mir,P., Barteri,F., Merenciano,M., González,J.,
simple alternative for expensive mapping-based methods Casacuberta,J.M. and Castanera,R. (2019) A benchmark of
to genotype polymorphic SVs. Several tools have already transposon insertion detection tools using real data. Mobile DNA, 10,
achieved similar conclusions for other types of variants such 53.
as SNVs (26,27) and indels (21,28). Furthermore, our pro- 5. Stankiewicz,P. and Lupski,J.R. (2010) Structural variation in the
human genome and its role in disease. Annu. Rev. Med., 61, 437–455.
posed approach can easily be modified to genotype other 6. Zhang,F., Gu,W., Hurles,M.E. and Lupski,J.R. (2009) Copy number
types of variants (i.e. SNVs and indels). Thus, we believe variation in human health, disease, and evolution. Annu. Rev. Genom.
that utilizing a combination of these mapping-free methods Hum. G., 10, 451–481.
can provide a framework for accurate and efficient genotyp- 7. Manolio,T.A., Collins,F.S., Cox,N.J., Goldstein,D.B., Hindorff,L.A.,
ing of all types of variation using k-mer counts. This would Hunter,D.J., McCarthy,M.I., Ramos,E.M., Cardon,L.R.,
Chakravarti,A. et al. (2009) Finding the missing heritability of
significantly reduce the computational resources needed to complex diseases. Nature, 461, 747.
analyze new WGS samples and will speed-up large scale 8. Eichler,E.E., Flint,J., Gibson,G., Kong,A., Leal,S.M., Moore,J.H.
studies. and Nadeau,J.H. (2010) Missing heritability and strategies for finding
Note that Nebula does not require exact SV breakpoints the underlying causes of complex disease. Nat. Rev. Genet., 11, 446.
9. Sudmant,P.H., Rausch,T., Gardner,E.J., Handsaker,R.E.,
for genotyping SVs and can work with approximate break- Abyzov,A., Huddleston,J., Zhang,Y., Ye,K., Jun,G., Fritz,M. H.-Y.
points. This is an advantage over approaches that require et al. (2015) An integrated map of structural variation in 2,504
exact breakpoints or assembled haplotypes to guide k-mers human genomes. Nature, 526, 75.
selection and accurate variant genotyping. Nebula only 10. Layer,R.M., Chiang,C., Quinlan,A.R. and Hall,I.M. (2014) LUMPY:
counts the k-mers directly associated with the SVs, signif- a probabilistic framework for structural variant discovery. Genome
Biol., 15, R84.
icantly reducing the runtime and memory usage compared 11. Rausch,T., Zichner,T., Schlattl,A., Stütz,A.M., Benes,V. and
to other k-mer based approaches. Korbel,J.O. (2012) DELLY: structural variant discovery by integrated
Furthermore, genotype imputation algorithms (42) can paired-end and split-read analysis. Bioinformatics, 28, i333–i339.
be incorporated into Nebula’s pipeline to improve the 12. Soylev,A., Le,T.M., Amini,H., Alkan,C. and Hormozdiari,F. (2019)
Discovery of tandem and interspersed segmental duplications using
method’s accuracy and ability to genotype variants that high-throughput sequencing. Bioinformatics, 35, 3923–3930.
are difficult to genotype using solely k-mers, e.g. SVs with 13. Ye,K., Schulz,M.H., Long,Q., Apweiler,R. and Ning,Z. (2009)
breakpoints in repeat regions of the genome. Pindel: a pattern growth approach to detect break points of large
Finally, extending Nebula to utilize k-mers that are deletions and medium sized insertions from paired-end short reads.
shared between different SVs may help us improve our per- Bioinformatics, 25, 2865–2871.
14. Chaisson,M.J., Huddleston,J., Dennis,M.Y., Sudmant,P.H.,
formance when genotyping SVs in repeat regions of the Malig,M., Hormozdiari,F., Antonacci,F., Surti,U., Sandstrom,R.,
genome (e.g. tandem repeats). Boitano,M. et al. (2015) Resolving the complexity of the human
genome using single-molecule sequencing. Nature, 517, 608.
15. Handsaker,R.E., Korn,J.M., Nemesh,J. and McCarroll,S.A. (2011)
Discovery and genotyping of genome structural polymorphism by
DATA AVAILABILITY sequencing on a population scale. Nat. Genet., 43, 269.
The code and data used in these experiments are available 16. Chiang,C., Layer,R.M., Faust,G.G., Lindberg,M.R., Rose,D.B.,
Garrison,E.P., Marth,G.T., Quinlan,A.R. and Hall,I.M. (2015)
at https://github.com/Parsoa/Nebula. SpeedSeq: ultra-fast personal genome analysis and interpretation.
Nat. Methods, 12, 966.
17. Bray,N.L., Pimentel,H., Melsted,P. and Pachter,L. (2016)
SUPPLEMENTARY DATA Near-optimal probabilistic RNA-seq quantification. Nat. Biotechnol.,
34, 525.
Supplementary Data are available at NAR Online. 18. Patro,R., Duggal,G., Love,M.I., Irizarry,R.A. and Kingsford,C.
(2017) Salmon provides fast and bias-aware quantification of
transcript expression. Nat. Methods, 14, 417.
19. Iqbal,Z., Caccamo,M., Turner,I., Flicek,P. and McVean,G. (2012) De
ACKNOWLEDGEMENTS novo assembly and genotyping of variants using colored de Bruijn
graphs. Nat. Genet., 44, 226.
We would like to acknowledge helpful discussions with Drs 20. Uricaru,R., Rizk,G., Lacroix,V., Quillery,E., Plantard,O., Chikhi,R.,
Farhad Hormozdiari, Titus Brown, Can Alkan and Daniel Lemaitre,C. and Peterlongo,P. (2014) Reference-free detection of
Standage regarding this paper. isolated SNPs. Nucleic Acids Res., 43, e11.e47 Nucleic Acids Research, 2021, Vol. 49, No. 8 PAGE 8 OF 8
21. Peterlongo,P., Riou,C., Drezen,E. and Lemaitre,C. (2017) Fay,S. et al. (2015) The khmer software package: enabling efficient
DiscoSnp++: de novo detection of small variants from raw nucleotide sequence analysis. F1000Research, 4, 900.
unassembled read set (s). bioRxiv doi: 32. Rizk,G., Lavenier,D. and Chikhi,R. (2013) DSK: k-mer counting
https://doi.org/10.1101/209965, 27 October 2017, preprint: not peer with very low memory usage. Bioinformatics, 29, 652–653.
reviewed. 33. Deorowicz,S., Debudaj-Grabysz,A. and Grabowski,S. (2013)
22. Chong,Z., Ruan,J., Gao,M., Zhou,W., Chen,T., Fan,X., Ding,L., Disk-based k-mer counting on a PC. BMC Bioinformatics, 14, 160.
Lee,A.Y., Boutros,P., Chen,J. et al. (2017) novoBreak: local assembly 34. Dagum,L. and Menon,R. (1998) OpenMP: an industry standard API
for breakpoint detection in cancer genomes. Nat. Methods, 14, 65. for shared-memory programming. IEEE Comput. Sci. Eng., 5, 46–55.
23. Narzisi,G., O’rawe,J.A., Iossifov,I., Fang,H., Lee,Y.-h., Wang,Z., 35. Lau,J.W., Lehnert,E., Sethi,A., Malhotra,R., Kaushik,G., Onder,Z.,
Wu,Y., Lyon,G.J., Wigler,M. and Schatz,M.C. (2014) Accurate de Groves-Kirkby,N., Mihajlovic,A., DiGiovanna,J., Srdic,M. et al.
novo and transmitted indel detection in exome-capture data using (2017) The Cancer Genomics Cloud: collaborative, reproducible, and
microassembly. Nat. Methods, 11, 1033. democratized––a new paradigm in large-scale computational
24. Gómez-Romero,L., Palacios-Flores,K., Reyes,J., Garcı́a,D., research. Cancer Res., 77, e3–e6.
Boege,M., Dávila,G., Flores,M., Schatz,M.C. and Palacios,R. (2018) 36. Chaisson,M.J., Sanders,A.D., Zhao,X., Malhotra,A., Porubsky,D.,
Precise detection of de novo single nucleotide variants in human Rausch,T., Gardner,E.J., Rodriguez,O.L., Guo,L., Collins,R.L. et al.
genomes. Proc. Natl. Acad. Sci. U.S.A., 115, 5516–5521. (2019) Multi-platform discovery of haplotype-resolved structural
25. Standage,D.S., Brown,C.T. and Hormozdiari,F. (2019) Kevlar: a variation in human genomes. Nat. Commun., 10, 1784.
Downloaded from https://academic.oup.com/nar/article/49/8/e47/6121467 by guest on 31 August 2021
mapping-free framework for accurate discovery of de novo variants. 37. Li,H. (2013) Aligning sequence reads, clone sequences and assembly
iScience, 18, 28–36. contigs with BWA-MEM. arXiv doi: https://arxiv.org/abs/1303.3997,
26. Shajii,A., Yorukoglu,D., William Yu,Y. and Berger,B. (2016) Fast 26 May 2013, preprint: not peer reviewed.
genotyping of known SNPs through approximate k-mer matching. 38. Chen,S., Krusche,P., Dolzhenko,E., Sherman,R.M., Petrovski,R.,
Bioinformatics, 32, i538–i544. Schlesinger,F., Kirsche,M., Bentley,D.R., Schatz,M.C., Sedlazeck,F.J.
27. Sun,C. and Medvedev,P. (2018) Toward fast and accurate SNP et al. (2019) Paragraph: A graph-based structural variant genotyper
genotyping from whole genome sequencing data for bedside for short-read sequence data. Genome Biol., 20, 291.
diagnostics. Bioinformatics, 35, 415–420. 39. Sibbesen,J.A., Maretty,L. and Krogh,A. (2018) Accurate genotyping
28. Denti,L., Previtali,M., Bernardini,G., Schönhuth,A. and Bonizzoni,P. across variant classes and lengths using variant graphs. Nat. Genet.,
(2019) MALVA: genotyping by Mapping-free ALlele detection of 50, 1054–1059.
known VAriants. iScience, 18, 20–27. 40. Chander,V., Gibbs,R.A. and Sedlazeck,F.J. (2019) Evaluation of
29. Rahman,A., Hallgrı́msdóttir,I., Eisen,M. and Pachter,L. (2018) computational genotyping of structural variation for clinical
Association mapping from sequencing reads using k-mers. eLife, 7, diagnoses. GigaScience, 8, giz110.
e32920. 41. Mallick,S., Li,H., Lipson,M., Mathieson,I., Gymrek,M., Racimo,F.,
30. Marçais,G. and Kingsford,C. (2011) A fast, lock-free approach for Zhao,M., Chennagiri,N., Nordenfelt,S., Tandon,A. et al. (2016) The
efficient parallel counting of occurrences of k-mers. Bioinformatics, Simons genome diversity project: 300 genomes from 142 diverse
27, 764–770. populations. Nature, 538, 201–206.
31. Crusoe,M.R., Alameldin,H.F., Awad,S., Boucher,E., Caldwell,A., 42. Marchini,J. and Howie,B. (2010) Genotype imputation for
Cartwright,R., Charbonneau,A., Constantinides,B., Edvenson,G., genome-wide association studies. Nat. Rev. Genet., 11, 499–511.You can also read