VarSight: Prioritizing Clinically Reported Variants with Binary Classification Algorithms - bioRxiv
←
→
Page content transcription
If your browser does not render page correctly, please read the page content below
bioRxiv preprint first posted online Jan. 28, 2019; doi: http://dx.doi.org/10.1101/532440. The copyright holder for this preprint
 (which was not peer-reviewed) is the author/funder, who has granted bioRxiv a license to display the preprint in perpetuity.
                                  It is made available under a CC-BY 4.0 International license.

               VarSight: Prioritizing Clinically Reported Variants with
                          Binary Classification Algorithms
         James M. Holt1 , Brandon Wilk1 , Camille L. Birch1 , Donna M. Brown1 , Manavalan
          Gajapathy1 , Alexander C. Moss1 , Nadiya Sosonkina1 , Melissa A. Wilk1 , Julie A.
         Anderson1 , Jeremy M. Harris1 , Jacob M. Kelly1 , Fariba Shaterferdosian1 , Angelina
            E. Uno-Antonison1 , Arthur Weborg1 , Undiagnosed Diseases Network , and
                                      Elizabeth A. Worthey1
         1
             Software Development and Informatics, HudsonAlpha Institute for Biotechnology,
                                       Huntsville, 35806, USA

                                                                 Abstract
                Motivation: In genomic medicine for rare disease patients, the primary goal is to identify
                one or more variants that cause their disease. Typically, this is done through filtering and
                then prioritization of variants for manual curation. However, prioritization of variants in rare
                disease patients remains a challenging task due to the high degree of variability in phenotype
                presentation and molecular source of disease. Thus, methods that can identify and/or prioritize
                variants to be clinically reported in the presence of such variability are of critical importance.
                Results: We tested the application of classification algorithms that ingest variant predictions
                along with phenotype information for predicting whether a variant will ultimately be clinically
                reported and returned to a patient. To test the classifiers, we performed a retrospective study
                on variants that were clinically reported to 237 patients in the Undiagnosed Diseases Network.
                We treated the classifiers as variant prioritization systems and compared them to another vari-
                ant prioritization algorithm and two single-measure controls. We showed that these classifiers
                outperformed the other methods with the best classifier ranking 73% of all reported variants
                and 97% of reported pathogenic variants in the top 20.
                Availability: The scripts used to generate results presented in this paper are available at
                https://github.com/HudsonAlpha/VarSight.
                Contact: jholt@hudsonalpha.org

        1       Introduction
        Genome and exome sequencing are both currently being used as molecular diagnostic tools for
        patients with rare, undiagnosed diseases (Ramoni et al., 2017; Bagnall et al., 2018; Sweeney et al.,
        2018). Typically, these technologies are applied clinically following workflows consisting of blood
        draw, sequencing, alignment, variant calling, variant annotation, variant filtering, and variant pri-
        oritization (Worthey, 2017; Roy et al., 2018). Then, clinical analysts usually perform the more

                                                                       1
bioRxiv preprint first posted online Jan. 28, 2019; doi: http://dx.doi.org/10.1101/532440. The copyright holder for this preprint
(which was not peer-reviewed) is the author/funder, who has granted bioRxiv a license to display the preprint in perpetuity.
It is made available under a CC-BY 4.0 International license.
manual processes of inspecting and then clinically reporting variants based on the known set of
patient phenotypes.
In general, commonly used pipelines exist for the steps from sequencing through variant calling
(Rehm et al., 2013; Cornish et al., 2015). Despite differences in performance, most of these standards
ingest the same information to create a list of variants from sequencing data. In contrast, methods
for variant annotation and/or variant filtering are quite diverse (Wang et al., 2010; Hu et al.,
2013; Jger et al., 2014; Desvignes et al., 2018). These methods use a wide range of input sources
including but not limited to population allele frequencies (Lek et al., 2016), conservation scores
(Cooper et al., 2005; Siepel et al., 2006; Petrovski et al., 2013), haploinsufficiency scores (Huang
et al., 2010; Steinberg et al., 2015), deleteriousness scores (Steinberg et al., 2015; Rentzsch et al.,
2018), transcript impact scores (Kumar et al., 2009; Choi, 2012; Adzhubei et al., 2013; Dong et al.,
2014; Jian et al., 2014) , and previously associated disease annotation (Stenson et al., 2003; Hamosh
et al., 2005; Landrum et al., 2015). Variant prioritization is also quite diverse with some methods
relying on the variant annotations to prioritize variants (Hu et al., 2013) and some relying on patient
phenotype to rank the variants (Khler et al., 2009; Yang et al., 2015; Rao et al., 2018; Wilk et al.,
2018). There are also methods which combine both variant annotations and phenotype score to
rank the variants (Singleton et al., 2014; Zemojtel et al., 2014; Smedley et al., 2015a), a selection
of which are benchmarked on the same simulated datasets in Smedley et al. (2015b).
Given a prioritized list of variants, analysts manually inspect those variants and curate a list
of variants to ultimately report to the ordering physician. Unfortunately, manual curation is time
consuming and exhausting. An analyst must inspect each variant and the associated metadata
while simultaneously maintaining a mental picture of the patient’s phenotype, leading to what we
colloquially refer to as “variant fatigue”. This variant fatigue means that variants at the end of the
prioritized list are often regarded with less scrutiny and/or a less accurate patient model than those
near the beginning. Methods that can prioritize these variants accurately can reduce the impact of
variant fatigue, reducing the chances that variants are overlooked or mis-identified. Additionally,
if causative variants can be identified earlier due to a high rank from prioritization, it’s possible
that the full filtered variant list can be short-circuited to reduce the time needed to analyze a case.
Finally, accurate prioritization is a step towards the ultimate goal of automatically identifying all
variants that cause a patient’s primary phenotypes.
One of the issues with previously published ranking methods is that they were primarily tested
on simulated datasets with known, single-gene, pathogenic variants injected into real or simulated
background genomic datasets. Additionally, when phenotype terms were used, they tended to use
all available phenotype terms paired with the simulated disease with a few noisy terms added or
removed.
In this paper, we focus on real patient data from the multi-site collaboration of the Undiagnosed
Diseases Network (UDN) (Ramoni et al., 2017). Patients accepted into the UDN are believed to have
rare, undiagnosed diseases of genetic origin. Because the UDN is not focused on a single particular
disease, the patient population has a diverse range of phenotypes represented. Additionally, the
phenotypes associated to an individual patient can be quite noisy for a variety of reasons: multiple
genetic diseases, phenotype collection differences, and/or unrelated non-genetic diseases (such as
phenotypes caused by old age). Because the UDN is a research collaboration, there is also variability
in reported variants that range in pathogenicity from “variant of uncertain significance” (VUS)
through “pathogenic” as defined by the ACMG guidelines (Richards et al., 2015). The summation
of this real-world variation means that accurately prioritizing variants is challenging due to noise
and variation in phenotype inputs and variation in pathogenicity of reported variant outputs.
2bioRxiv preprint first posted online Jan. 28, 2019; doi: http://dx.doi.org/10.1101/532440. The copyright holder for this preprint
(which was not peer-reviewed) is the author/funder, who has granted bioRxiv a license to display the preprint in perpetuity.
It is made available under a CC-BY 4.0 International license.
2 Approach
In this paper, we tested the application of classification algorithms for two purposes: 1) predicting
whether a variant observed by an analyst would be clinically reported and 2) prioritizing all vari-
ants seen by clinical analysts. In particular, we focused our analyses on real patients with a diverse
collection of rare, undiagnosed diseases that were admitted to the Undiagnosed Diseases Network
(UDN) (Ramoni et al., 2017). We limited our patients to those who received whole genome sequenc-
ing and received at least one primary variant (i.e. not secondary or incidental) on their clinical
report. We extracted data directly from the same annotation and filtering tool used by the analysts
in order to replicate their data view of each variant in a patient. Additionally, we incorporated
phenotype information into the models using two scoring systems that are based on ranking genes
by their association to a set of patient phenotypes. Finally, each variant was either labeled as
“returned” or “not returned” depending on whether it was ultimately reported back to the clinical
site.
Given the above variant information, we split the data into training and testing sets for mea-
suring the performance of classifiers to predict whether a variant would be clinically reported or
not. We tested four classifiers that are readily available in the sklearn (Pedregosa et al., 2011) and
imblearn (Lematre et al., 2017) Python modules. Each classifier calculated probabilities of a vari-
ant belonging to the “returned” class, allowing for both classification analysis and ranking of the
variants by their calculated probabilities. After tuning each classifier, we generated summaries of
the performance of each method from both a binary classification perspective and a variant ranking
perspective. All of the scripts to train classifiers, test classifiers, and format results are contained
in the VarSight repository.
3 Methods
3.1 Data sources
All samples were selected from the cohort of Undiagnosed Diseases Network (UDN) (Ramoni et al.,
2017) genome sequencing samples that were originally sequenced at HudsonAlpha Institute for
Biotechnology (HAIB). In short, the UDN accepts patients with rare, undiagnosed diseases that
are believed to have a genetic origin. The UDN is not restricted to a particular disease, so there are
a diverse set of diseases and phenotypes represented across the whole population. The phenotypes
annotated to a patient are also noisy compared to simulated datasets for a variety of reasons
including: 1) some patients have multiple diseases, 2) phenotype collection is done at seven different
clinical sites leading to slightly different standards of collection, and 3) some patients exhibit more
or fewer phenotypes than are associated with the classic disease presentation. For more details on
the UDN, refer to Ramoni et al., 2017.
DNA for these UDN patients was prepared from blood samples (with few exceptions) and
sequenced via standard operation protocols for use as a Laboratory-Developed Test (LDT) in the
HAIB CAP/CLIA lab. The analyses presented in this paper are based on data that is or will be
deposited in the dbGaP database under dbGaP accession phs001232.v1.p1 by the UDN.
3bioRxiv preprint first posted online Jan. 28, 2019; doi: http://dx.doi.org/10.1101/532440. The copyright holder for this preprint
(which was not peer-reviewed) is the author/funder, who has granted bioRxiv a license to display the preprint in perpetuity.
It is made available under a CC-BY 4.0 International license.
3.2 Alignment and variant calling
After sequencing, we followed GATK best practices (DePristo et al., 2011) to align to the GRCh37
human reference genome with BWA-mem (Li, 2013). Aligned sequences were processed via GATK
for base quality score recalibration, indel realignment, and duplicate removal. Finally, SNV and
indel variants were joint genotyped, again according to GATK best practices (DePristo et al.,
2011). The end result of this pipeline is one Variant Call Format (VCF) file per patient sample.
This collection of VCF files is used in the following sections.
3.3 Variant annotation and filtering
After VCF generation, the clinical analysts followed various published recommendations (e.g. Worthey,
2017; Roy et al., 2018) to annotate and filter variants from proband samples. For variant annotation
and filtering, we used the same tool that our analysts used during their initial analyses. The tool,
Codicem (Envision, 2018), loads patient variants from a VCF and annotates the variants with over
fifty annotations that the analysts can use to interpret pathogenicity. These annotations include:
variant level annotations such as CADD (Rentzsch et al., 2018), conservation scores (Cooper et al.,
2005; Siepel et al., 2006), and population frequencies (Lek et al., 2016); gene level annotations such
as haploinsufficiency scores (Huang et al., 2010; Steinberg et al., 2015), intolerance scores (Petrovski
et al., 2013), and disease associations (Stenson et al., 2003; Hamosh et al., 2005; Landrum et al.,
2015); and transcript level annotations such as protein change scores (Kumar et al., 2009; Choi,
2012; Adzhubei et al., 2013; Dong et al., 2014) and splice site impact scores (Jian et al., 2014).
Additionally, if the variant has been previously curated in another patient through HGMD or Clin-
Var (Stenson et al., 2003; Landrum et al., 2015), those annotations are also made available to the
analysts.
Codicem also performs filtering for the analysts to reduce the number of variants that are viewed
through a standard clinical analysis. We used the latest version of the primary clinical filter for
rare disease variants to replicate the standard filtering process for patients in the UDN. In short,
the filter requires the following for a variant to pass through the clinical filter: sufficient total read
depth, sufficient alternate read depth, low population frequency, at least one predicted effect on
a transcript, at least one gene-disease association, and to not be a known, common false-positive
from sequencing. In general, the filter reduces the number of variants from the order of millions
to hundreds (anecdotally, roughly 200-400 variants per proband after filtering). For the specific
details on the filter used, please refer to Supplementary Documents.
3.4 Phenotype annotation
The Codicem annotations are all agnostic of the patient phenotype. As noted earlier, we expect
these patient phenotypes to be noisy when compared to simulated datasets due to the variety
and complexity of diseases, phenotypes, and genetic heritage tied to UDN patients. In order to
incorporate patient phenotype information, we used two distinct methods to rank genes based on
the Human Phenotype Ontology (HPO) (Khler et al., 2018). We then annotated each variant with
the best scores from their corresponding gene(s).
The first method uses base annotations provided by the HPO to calculate a simple cosine score
(Khler, 2017) between the patient’s phenotypes and each gene. This method tends to be more
conservative because it relies solely on curated annotations from the HPO. The second method, an
internally-developed tool called PyxisMap (Wilk et al., 2018), uses the same annotations from the
4bioRxiv preprint first posted online Jan. 28, 2019; doi: http://dx.doi.org/10.1101/532440. The copyright holder for this preprint
(which was not peer-reviewed) is the author/funder, who has granted bioRxiv a license to display the preprint in perpetuity.
It is made available under a CC-BY 4.0 International license.
HPO, but adds in automatically text-mined data from NCBI’s PubTator (Wei et al., 2013) and
performs a Random-Walk with Restart (Page et al., 1999) on the ontology graph structure. The
PyxisMap method has the added benefit of incorporating gene-phenotype connections from recent
papers that have not been manually curated into the HPO, but it also tends to make more spurious
connections due to the imprecision of the text-mining from PubTator. We used PyxisMap v1.2,
and we ran the standard installation script that downloads all required data sources on December
19, 2018. Each method generates a single numerical feature that is used in the following analyses.
3.5 Patient selection
In our analysis, we focused on variants that were clinically reported as “primary”, meaning the
analysts believed the variant to be directly related to the patient’s phenotype. Note that secondary
and/or incidental findings are specifically not included in this list. The analysts assigned each
primary variant a classification from variant of uncertain significance (VUS), likely pathogenic,
or pathogenic adhering to the recommendations in the ACMG guidelines for variant classification
(Richards et al., 2015).
We required the following for each proband sample included in our analyses: 1) at least one
clinically reported primary variant that came through the primary clinical filter (i.e. it was not
found through some other targeted search) and 2) a set of phenotypes annotated with Human
Phenotype Ontology (Khler et al., 2018) terms using the Phenotips software (Girdea et al., 2013).
At the time of writing, this amounted to 378 primary, reported variants spanning a total of 237
proband samples.
3.6 Data cleaning
For the purposes of classification, all annotations needed to be cleaned and stored as numerical
features. For numerical annotations (e.g. float values like CADD or GERP), we simply copied
the annotation over as a single value feature. Missing annotations were assigned a default value
that was outside the expected value range for that feature. Additionally, these default values were
always on the less impactful side of the spectrum (e.g. a default conservation score would err on
the side of not being conserved). The one exception to this rule was for variant allele frequencies
where a variant absent from the database was considered to have an allele frequency of 0.0.
For categorical data, we used a two step approach to cleaning the data: bin-count encoding
and principal component analysis. First, we chose to use a bin-count because there are many
categories where multiple categorical labels may be present at different quantities. For example, a
single ClinVar variant may have multiple entries where different sites have selected different levels
of pathogenicity. In this situation, we desired to capture not only the categorical label as a feature,
but also the number of times that label occurred in the annotations. Second, we found that the
bin-count encoding tended to create many extra features (one per category per annotation type)
that were ignored and/or diluted the useful features from the pool of features. To reduce this
dilution, we used principal component analysis (Jolliffe, 2011) to reduce the dimensions of each
category and stored at most two features per categorical feature.
3.7 Model training and tuning
As noted earlier, there are generally hundreds of variants per proband that pass the filter, but only a
few are ever clinically reported. Across all 237 proband samples, there were a total of 378 clinically
5bioRxiv preprint first posted online Jan. 28, 2019; doi: http://dx.doi.org/10.1101/532440. The copyright holder for this preprint
(which was not peer-reviewed) is the author/funder, who has granted bioRxiv a license to display the preprint in perpetuity.
It is made available under a CC-BY 4.0 International license.
reported variants and another 87819 variants that were seen but not reported. As a result, there is
a major imbalance in the number of true positives (variants clinically reported) and true negatives
(variants seen, but not clinically reported).
We split the data into training and test sets on a per-proband basis with the primary goal
of roughly balancing the total number of true positives in each set. Additionally, the cases were
assigned to a particular set by chronological order of analysis in order to reduce any chronological
biases that may be introduced by expanding scientific knowledge (i.e. there are roughly equal
proportions of “early” or “late” proband samples from the UDN in each set). In the training set,
there were a total of 189 returned variants and 44593 not returned variants spanning 120 different
probands. In the test set, there were a total of 189 returned variants and 43226 not returned variants
spanning 117 different probands. In our results, the returned test variants are further stratified in
their reported levels of pathogenicity.
We then selected four readily available models for classification that are capable of training on
imbalanced datasets: a random forest model by sklearn (Pedregosa et al., 2011), a logistic regression
model by sklearn, a balanced random forest model by imblearn (Lematre et al., 2017), and an
ensemble classification model by imblearn. For each model, we selected a list of hyperparameters
to test and tested each possible combination of those hyperparameters. For each model and set of
hyperparameters, we performed 10-fold cross validation on the training variants and recorded the
balanced accuracy scores (i.e. a weighted accuracy score where inputs are weighted by their inverse
class frequency). For each model type, we saved the hyperparameters and model with the best
average balanced accuracy score. These four tuned models were then tested against the unseen set
of test proband cases.
4 Results
4.1 Classifier Statistics
For each tuned model, we calculated the 10-fold cross validated balanced accuracy on the training
set. We then calculated the true positive rate (TPR), false positive rate (FPR), and area under
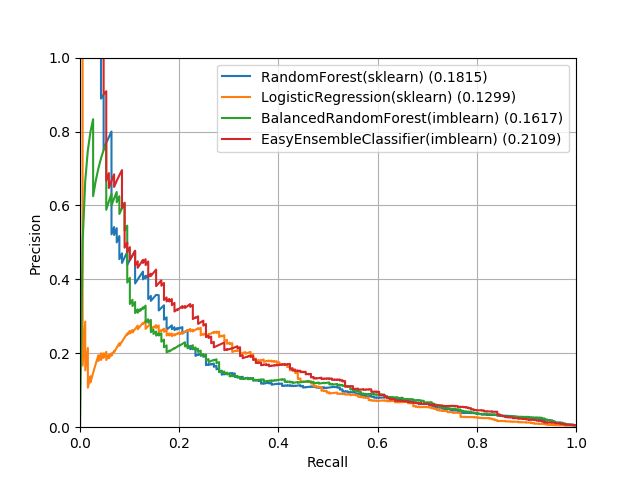
the receiver operator curve (AUROC) based on the unseen test data (see Table 1). Figure 1 show
receiver operator curves for FPR v. TPR and recall v. precision for the four models.
From these metrics, the two random forest models and the EasyEnsembleClassifier have similar
performance whereas whereas LogisticRegression performs slightly worse across the board. However,
these classifier all have relatively poor performance from a precision-recall perspective (best AUROC
for precision-recall was 0.2109). This indicates that from a classification perspective, these models
would identify a high number of false positives relative to the true positives unless a very conservative
cutoff score was used.
6bioRxiv preprint first posted online Jan. 28, 2019; doi: http://dx.doi.org/10.1101/532440. The copyright holder for this preprint
(which was not peer-reviewed) is the author/funder, who has granted bioRxiv a license to display the preprint in perpetuity.
It is made available under a CC-BY 4.0 International license.
Figure 1: Receiver operator curves. This figure shows the receiver operator curves for the test data
for each trained classifier. On the left, we show the false positive rate against the true positive
rate. On the right, we show the recall against the precision. Area under the receiver-operator curve
(AUROC) is reported beside each method in the legend. In general, the two random forest methods
and the EasyEnsembleClassifier perform very similarly with LogisticRegression performing slightly
worse overall.
Classifier CV10 Acc. TPR FPR AUROC
RandomForest(sklearn) 0.86+-0.13 0.80 0.91 0.9386
LogisticRegression(sklearn) 0.83+-0.11 0.81 0.86 0.8962
BalancedRandomForest(imblearn) 0.87+-0.12 0.88 0.87 0.9405
EasyEnsembleClassifier(imblearn) 0.87+-0.09 0.87 0.85 0.9364
Table 1: Classifier performance statistics. For each tuned classifier, we show performance measures
commonly used for classifiers (from left to right): 10-fold cross validation balanced accuracy (CV10
Acc.), true positive rate (TPR), false positive rate (FPR), and area under the receiver operator curve
(AUROC). In general, the two random forest methods and the EasyEnsembleClassifier perform very
similarly whereas LogisticRegression seems to be slightly worse across all measures.
7bioRxiv preprint first posted online Jan. 28, 2019; doi: http://dx.doi.org/10.1101/532440. The copyright holder for this preprint
(which was not peer-reviewed) is the author/funder, who has granted bioRxiv a license to display the preprint in perpetuity.
It is made available under a CC-BY 4.0 International license.
Case Rank - Median (Mean) Percentage in Top X Variants - X=(1, 10, 20)
Ranking System
All (n=189) VUS (n=111) LP (n=42) Path. (n=36) All (n=189) VUS (n=111) LP (n=42) Path. (n=36)
CADD Scaled 57.0 (99.13) 69.0 (107.78) 39.5 (91.24) 28.0 (81.67) 4, 17, 24 0, 9, 15 7, 21, 30 13, 41, 47
HPO-cosine 22.0 (53.96) 22.0 (56.05) 26.0 (56.38) 19.5 (44.69) 7, 32, 47 7, 31, 48 7, 28, 40 8, 38, 50
Exomiser(best) 16.0 (17.95) 14.0 (18.37) 17.5 (16.98) 17.0 (17.81) 7, 34, 61 6, 34, 65 7, 30, 57 13, 38, 55
Exomiser(avg) 138.5 (111.86) 134.5 (110.20) 82.2 (116.98) 152.5 (111.01) 7, 30, 39 6, 30, 40 7, 26, 35 13, 33, 38
RandomForest(sklearn) 8.0 (25.85) 12.0 (34.27) 7.0 (18.21) 3.5 (8.78) 18, 55, 67 13, 45, 60 23, 61, 71 27, 80, 83
LogisticRegression(sklearn) 8.0 (40.42) 14.0 (48.36) 4.0 (42.38) 2.0 (13.64) 14, 55, 69 9, 43, 59 19, 66, 78 22, 80, 91
BalancedRandomForest(imblearn) 7.0 (24.65) 12.0 (33.41) 6.0 (16.64) 3.0 (6.97) 15, 58, 71 10, 46, 63 16, 66, 76 30, 83, 88
EasyEnsembleClassifier(imblearn) 7.0 (26.37) 12.0 (34.89) 7.0 (21.79) 2.0 (5.44) 19, 57, 73 17, 47, 64 9, 61, 73 36, 83, 97
Table 2: Ranking performance statistics. This table shows the ranking performance statistics for all methods evaluated on our test set. CADD Scaled and HPO-
cosine are single value measures that were used as inputs to the classifiers we tested. Exomiser is an external tool that only reported ranks for a subset of the filtered
variants. “Exomiser(best)” conservatively assumed unranked primary variants were ranked at the next best position despite being unranked. In contrast, “Exomiser(avg)”
realistically assumed unranked primary variants were at the average rank (i.e. middle) for all unranked variants. The bottom four rows are the tuned, binary classification
methods tested in this paper. The “Case Rank” columns show the median and mean ranks for all reported variants along with the variants split into their reported
pathogenicity (calculated using the ACMG guidelines). The “Percentage in Top X Variants” columns show the percentage of variants that were found in the top 1, 10,
and 20 variants in a case after ranking by the corresponding method. All values were generated using only the test data that was unseen during training.bioRxiv preprint first posted online Jan. 28, 2019; doi: http://dx.doi.org/10.1101/532440. The copyright holder for this preprint
(which was not peer-reviewed) is the author/funder, who has granted bioRxiv a license to display the preprint in perpetuity.
It is made available under a CC-BY 4.0 International license.
4.2 Ranking Statistics
In addition to the model performance statistics, we also quantified the performance of each classifier
as a ranking system. For each proband, we calculated the probability of each class (reported or not
reported) for each variant and ordered them from highest to lowest probability of being reported.
We then calculated median and mean rank statistics for the reported variants. Additionally, we
quantified the percentage of reported variants that were ranked in the top 1, 10, and 20 variants
in each case. While the models were trained as a binary classification system, we broke down the
results further to demonstrate differences between variants that were clinically reported as a variant
of uncertain significance (VUS), likely pathogenic, and pathogenic.
For comparison, we selected to run Exomiser (Smedley et al., 2015a) because it performed com-
paratively well with all phenotypes even in the presence of noise (see benchmarking from Smedley
et al., 2015b). We followed the installation on their website to install Exomiser CLI v.11.0.0 along
with version 1811 for hg19 data sources. For each test case, we created a VCF file from the pre-
filtered list of annotated variants created by Codicem and passed those VCFs along with the full
list of patient HPO terms to Exomiser. We then parsed the output JSON file created by Exomiser
into a ranked order of variants.
Unfortunately, Exomiser did not rank every variant that was present in the filtered VCF, typ-
ically ranking only 10-50 variants from the pre-filtered VCF. For the reported variants, Exomiser
did not rank 98 of the 189 variants in the test set (58 variant of uncertain significance, 21 likely
pathogenic, and 19 pathogenic). For these unranked variants, we assigned a rank using two different
methods. The “Exomiser(best)” method conservatively assumed that unranked primary variants
were found at the next best position in the rank order (e.g. if Exomiser ranked 15 variants, we
assumed all unranked variants were ranked 16th). In contrast, the “Exomiser(avg)” method as-
sumed that unranked primary variants were ranked at the average position for all unranked variants
(e.g. if Exomiser ranked 10 of 100 variants, we assumed all unranked variants were ranked 55th).
“Exomiser(best)” represents the best possible ordering that Exomiser could give us for unranked
variants where “Exomiser(avg)” is a more realistic expectation.
Finally, we added two control scores for comparison: CADD scaled and HPO-cosine. These
scores were inputs to each classifier, but also represent two common ways one might naively order
variants after filtering (by predicted deleteriousness and by similarity to phenotype). The results
for the two control scores, both Exomiser approaches, and all four classifiers are shown in Table 2.
In the overall data, all four classifiers outperform the single-measure statistics and both Exomiser
approaches across the board, with the one exception being the mean of “Exomiser(best)” (a measure
that is heavily biased by the conservative ranking of unranked variants). As one would intuitively
expect, all classifiers perform better as the returned pathogenicity increases with the EasyEnsem-
bleClassifier ranking 36% of pathogenic variants in the first position and 97% of pathogenic variants
in the top 20. Of the classifiers tested, the trained EasyEnsembleClassifier performs best overall
with the strongest comparative performance in the pathogenic category.
4.3 Random Forest Feature Importances
After training and testing each classifier, we wished to explore which features played the largest
role in how the classifier functioned. Both random forest models calculate a feature importance
array that stores how important each feature is in the trained model (the other two classifiers do
not have this information readily available). The total feature importance array sums to 1.0, and
higher values indicate that a feature was used more by the trained model. By chance, we had
9bioRxiv preprint first posted online Jan. 28, 2019; doi: http://dx.doi.org/10.1101/532440. The copyright holder for this preprint
(which was not peer-reviewed) is the author/funder, who has granted bioRxiv a license to display the preprint in perpetuity.
It is made available under a CC-BY 4.0 International license.
Feature label RF(sklearn) BRF(imblearn)
HPO-cosine 0.2418 0.2055
PyxisMap 0.1661 0.1352
CADD Scaled 0.1033 0.0736
phylop conservation 0.0645 0.0535
phastcon100 conservation 0.0673 0.0481
phylop100 conservation 0.0473 0.0526
Gnomad Genome AF 0.0432 0.0452
GERP rsScore 0.0214 0.0332
HGMD assessment type-PCA1 0.0269 0.0236
Gnomad Exome AF 0.0212 0.0248
HGMD association confidence-PCA1 0.0193 0.0240
Gnomad Exome Hom alt allele count 0.0224 0.0178
Total (features with avg. ≥ 0.02) 0.8448 0.7370
Table 3: Random forest feature importances. This table shows the top feature importances reported
by the two random forest algorithms we tested. We had exactly 50 features passed into the classifier
algorithms, so we show all features with an average importance ≥ 0.02 indicating a feature utilized
more than we would expect by chance.
exactly 50 parameters as input to our model, thus we would expect approximately 2% weight to
be assigned to each parameter by chance. Table 3 shows each features with an average importance
≥ 0.02 across the random forest classifiers.
Interestingly, the two strongest individual features by far were the phenotype-based measures
(HPO-cosine and PyxisMap) making up ∼33-40% of the feature importance. These were followed
by CADD Scaled (∼7-10%) and three conservation scores (∼14%). GnomAD-related fields (∼8%),
GERP rsScore (∼2-3%), and HGMD-related fields (∼4%) made up the rest of features with higher
than expected importance. These results would suggest that phenotype-based metrics, deleterious-
ness scores, and conservation scores are of very high importance for predicting if a variant will be
clinically returned to a rare disease patient.
5 Conclusion
We assessed the application of binary classification algorithms for identifying variants that were
ultimately reported on a clinical report. We trained and tested these algorithms using real patient
variants and phenotype terms from the standard clinical process obtained from the Undiagnosed
Diseases Network (UDN). From a classification perspective, we found that these methods tend to
have low precision scores, meaning a high number of false positives were identified by each method.
However, when evaluated as a ranking system, all four methods out-performed single-measure
ranking systems and Exomiser. We consider the best classifier to be the EasyEnsembleClassifier
from imblearn that had a median rank of 7.0 for all reported variants while ranking 73% in the top
20 for the case. For “Pathogenic” variants, the median rank was 2.0 and 97% of those variants were
ranked in the top 20 for the case. While these algorithms are not perfect classifiers, their use as a
prioritization system is quite promising.
We expect these classification algorithms could be refined in a variety of ways. First, adding new
10bioRxiv preprint first posted online Jan. 28, 2019; doi: http://dx.doi.org/10.1101/532440. The copyright holder for this preprint
(which was not peer-reviewed) is the author/funder, who has granted bioRxiv a license to display the preprint in perpetuity.
It is made available under a CC-BY 4.0 International license.
features and/or removing unused features could lead to improvements in the algorithm. The top two
most important features were both phenotype related suggesting that a highly accurate phenotype
scoring system would greatly benefit these algorithms. Many features had a low importance, so
pruning them may improve the overall results. Additionally, some of the features represent data that
is not freely available to the research community, so pruning or replacing those features with publicly
accessible sources would likely influence the results. Second, there may be a better classification
algorithm for this type of data. The four selected classifiers were all freely available methods
intended to handle the large class imbalance in the training set, but other algorithms that aren’t as
readily available may improve the result. Finally, training the model on different patient populations
may yield different models. We trained on a fairly diverse patient population
We believe the trained classifiers in VarSight are a significant step forward in reducing the prob-
lem of variant fatigue. The models improve our ability to prioritize variants despite the variability
and uncertainty injected by real-world data. Ultimately, we believe implementing these models will
enable analysts to assess the best candidate variants first, reducing the time to analyze a case and
return molecular diagnoses to patients.
Acknowledgements
We are grateful for the participation of patients and family members of the UDN and all of their
referring clinicians. We would like to acknowledge all of the teams within the UDN including the
coordinating center and all of the clinical sites working hard to provide definitive diagnoses for
UDN patients. We would also like to acknowledge the UDN whole genome sequencing core headed
by Dr. Shawn Levy.
Funding
This work was supported in part by the Intramural Research Program of the National Human
Genome Research Institute and the NIH Common Fund through the Office of Strategic Coordina-
tion and Office of the NIH Director. Research reported in this manuscript was supported by the
NIH Common Fund through the Office of Strategic Coordination and Office of the NIH Director un-
der award numbers U01HG007530, U01HG007674, U01HG007703, U01HG007709, U01HG007672,
U01HG007690, U01HG007708, U01HG007942, U01HG007943, U54NS093793, and U01TR001395.
The content is solely the responsibility of the authors and does not necessarily represent the official
views of the NIH.
References
Adzhubei, Ivan, Daniel M. Jordan, and Shamil R. Sunyaev. ”Predicting functional effect of human missense mutations using
PolyPhen?2.” Current protocols in human genetics 76.1 (2013): 7-20.
Bagnall, Richard D., et al. ”Whole genome sequencing improves outcomes of genetic testing in patients with hypertrophic
cardiomyopathy.” Journal of the American College of Cardiology 72.4 (2018): 419-429.
Choi, Yongwook. ”A fast computation of pairwise sequence alignment scores between a protein and a set of single-locus
variants of another protein.” Proceedings of the ACM Conference on Bioinformatics, Computational Biology and
Biomedicine. ACM, 2012.
11bioRxiv preprint first posted online Jan. 28, 2019; doi: http://dx.doi.org/10.1101/532440. The copyright holder for this preprint
(which was not peer-reviewed) is the author/funder, who has granted bioRxiv a license to display the preprint in perpetuity.
It is made available under a CC-BY 4.0 International license.
Cooper, Gregory M., et al. ”Distribution and intensity of constraint in mammalian genomic sequence.” Genome research
15.7 (2005): 901-913.
Cornish, Adam, and Chittibabu Guda. ”A comparison of variant calling pipelines using genome in a bottle as a reference.”
BioMed research international 2015 (2015).
DePristo, Mark A., et al. ”A framework for variation discovery and genotyping using next-generation DNA sequencing
data.” Nature genetics 43.5 (2011): 491.
Desvignes, Jean-Pierre, et al. ”VarAFT: a variant annotation and filtration system for human next generation sequencing
data.” Nucleic acids research (2018).
Dong, Chengliang, et al. ”Comparison and integration of deleteriousness prediction methods for nonsynonymous SNVs in
whole exome sequencing studies.” Human molecular genetics 24.8 (2014): 2125-2137.
Envision Genomics. ”Codicem Analysis Platform.” Envision Genomics. URL: http://envisiongenomics.com/codicem-
analysis-platform/.
Girdea, Marta, et al. ”PhenoTips: Patient Phenotyping Software for Clinical and Research Use.” Human mutation 34.8
(2013): 1057-1065.
Hamosh, Ada, et al. ”Online Mendelian Inheritance in Man (OMIM), a knowledgebase of human genes and genetic disorders.”
Nucleic acids research 33.suppl 1 (2005): D514-D517.
Hu, Hao, et al. ”VAAST 2.0: improved variant classification and disease-gene identification using a conservation-controlled
amino acid substitution matrix.” Genetic epidemiology 37.6 (2013): 622-634.
Huang, Ni, et al. ”Characterising and predicting haploinsufficiency in the human genome.” PLoS genetics 6.10 (2010):
e1001154.
Jger, Marten, et al. ”Jannovar: A Java Library for Exome Annotation.” Human mutation 35.5 (2014): 548-555.
Jian, Xueqiu, Eric Boerwinkle, and Xiaoming Liu. ”In silico prediction of splice-altering single nucleotide variants in the
human genome.” Nucleic acids research 42.22 (2014): 13534-13544.
Jolliffe, Ian. ”Principal component analysis.” International encyclopedia of statistical science. Springer, Berlin, Heidelberg,
2011. 1094-1096.
Khler, Sebastian, et al. ”Clinical diagnostics in human genetics with semantic similarity searches in ontologies.” The Amer-
ican Journal of Human Genetics 85.4 (2009): 457-464.
Koehler, Sebastian. ”Ontology-based similarity calculations with an improved annotation model.” bioRxiv (2017): 199554.
Khler, Sebastian, et al. ”Expansion of the Human Phenotype Ontology (HPO) knowledge base and resources.” Nucleic
acids research (2018).
Kumar, Prateek, Steven Henikoff, and Pauline C. Ng. ”Predicting the effects of coding non-synonymous variants on protein
function using the SIFT algorithm.” Nature protocols 4.7 (2009): 1073.
Landrum, Melissa J., et al. ”ClinVar: public archive of interpretations of clinically relevant variants.” Nucleic acids research
44.D1 (2015): D862-D868.
Lek, Monkol, et al. ”Analysis of protein-coding genetic variation in 60,706 humans.” Nature 536.7616 (2016): 285.
Lematre, Guillaume, Fernando Nogueira, and Christos K. Aridas. ”Imbalanced-learn: A python toolbox to tackle the curse
of imbalanced datasets in machine learning.” The Journal of Machine Learning Research 18.1 (2017): 559-563.
Li, Heng. ”Aligning sequence reads, clone sequences and assembly contigs with BWA-MEM.” arXiv preprint arXiv:1303.3997
(2013).
Page, Lawrence, et al. ”The PageRank citation ranking: Bringing order to the web.” Stanford InfoLab, 1999.
Pedregosa, Fabian, et al. ”Scikit-learn: Machine learning in Python.” Journal of machine learning research 12.Oct (2011):
2825-2830.
12bioRxiv preprint first posted online Jan. 28, 2019; doi: http://dx.doi.org/10.1101/532440. The copyright holder for this preprint
(which was not peer-reviewed) is the author/funder, who has granted bioRxiv a license to display the preprint in perpetuity.
It is made available under a CC-BY 4.0 International license.
Petrovski, Slav, et al. ”Genic intolerance to functional variation and the interpretation of personal genomes.” PLoS genetics
9.8 (2013): e1003709.
Ramoni, Rachel B. et al. ”The undiagnosed diseases network: accelerating discovery about health and disease.” The Amer-
ican Journal of Human Genetics 100.2 (2017): 185-192.
Rao, Aditya, et al. ”Phenotype-driven gene prioritization for rare diseases using graph convolution on heterogeneous net-
works.” BMC medical genomics 11.1 (2018): 57.
Rehm, Heidi L., et al. ”ACMG clinical laboratory standards for next-generation sequencing.” Genetics in medicine 15.9
(2013): 733.
Rentzsch, Philipp, et al. ”CADD: predicting the deleteriousness of variants throughout the human genome.” Nucleic acids
research (2018).
Richards, Sue, et al. ”Standards and guidelines for the interpretation of sequence variants: a joint consensus recommendation
of the American College of Medical Genetics and Genomics and the Association for Molecular Pathology.” Genetics in
medicine 17.5 (2015): 405.
Roy, Somak, et al. ”Standards and guidelines for validating next-generation sequencing bioinformatics pipelines: a joint
recommendation of the Association for Molecular Pathology and the College of American Pathologists.” The Journal of
Molecular Diagnostics 20.1 (2018): 4-27.
Siepel, Adam, Katherine S. Pollard, and David Haussler. ”New methods for detecting lineage-specific selection.” Annual
International Conference on Research in Computational Molecular Biology. Springer, Berlin, Heidelberg, 2006.
Singleton, Marc V., et al. ”Phevor combines multiple biomedical ontologies for accurate identification of disease-causing
alleles in single individuals and small nuclear families.” The American Journal of Human Genetics 94.4 (2014): 599-610.
Smedley, Damian, et al. ”Next-generation diagnostics and disease-gene discovery with the Exomiser.” Nature protocols 10.12
(2015): 2004.
Smedley, Damian, and Peter N. Robinson. ”Phenotype-driven strategies for exome prioritization of human Mendelian disease
genes.” Genome medicine 7.1 (2015): 81.
Steinberg, Julia, et al. ”Haploinsufficiency predictions without study bias.” Nucleic acids research 43.15 (2015): e101-e101.
Stenson, Peter D., et al. ”Human gene mutation database (HGMD): 2003 update.” Human mutation 21.6 (2003): 577-581.
Sweeney, Nathaly M., et al. ”The case for early use of rapid whole genome sequencing in management of critically ill infants:
Late diagnosis of Coffin-Siris syndrome in an infant with left congenital diaphragmatic hernia, congenital heart disease
and recurrent infections.” Molecular Case Studies (2018): mcs-a002469.
Wang, Kai, Mingyao Li, and Hakon Hakonarson. ”ANNOVAR: functional annotation of genetic variants from high-
throughput sequencing data.” Nucleic acids research 38.16 (2010): e164-e164.
Wei, Chih-Hsuan, Hung-Yu Kao, and Zhiyong Lu. ”PubTator: a web-based text mining tool for assisting biocuration.”
Nucleic acids research 41.W1 (2013): W518-W522.
Wilk, Brandon, James M. Holt, and Elizabeth A. Worthey. ”PyxisMap.” HudsonAlpha Institute for Biotechnology. URL:
https://github.com/HudsonAlpha/LayeredGraph.
Worthey, Elizabeth A. ”Analysis and Annotation of Whole-Genome or Whole-Exome Sequencing Derived Variants for
Clinical Diagnosis.” Current protocols in human genetics 95.1 (2017): 9-24.
Yang, Hui, Peter N. Robinson, and Kai Wang. ”Phenolyzer: phenotype-based prioritization of candidate genes for human
diseases.” Nature methods 12.9 (2015): 841.
Zemojtel, Tomasz, et al. ”Effective diagnosis of genetic disease by computational phenotype analysis of the disease-associated
genome.” Science translational medicine 6.252 (2014): 252ra123-252ra123.
13You can also read