Advice on Water Reform - Report to Gisborne District Council
←
→
Page content transcription
If your browser does not render page correctly, please read the page content below
Advice on Water Reform

Report to Gisborne District Council

SEPTEMBER 2021

Copyright Castalia Limited. All rights reserved. Castalia is not liable for any loss caused by reliance on this document.
Castalia is a part of the worldwide Castalia Advisory Group.
CONFIDENTIAL

Table of contents
Executive summary                                                                                   5
1    Introduction                                                                                  11
2    Government’s Reform Scenario produces implausible household bill estimates                    11
           2.1    Required investment estimate is overstated                                       11
                  2.1.1      WICS approach to estimating required investment is unsound            12
                  2.1.2      Required investment level is based on inappropriate Scottish
                             comparators                                                           14
                  2.1.3      WICS’ required investment estimate is implausibly high due to
                             accumulated depreciation                                              18
           2.2    Efficiency estimates for Reform Scenario are implausible                         20
                  2.2.1      Capex efficiency estimates are implausible                            20
                  2.2.2      Opex efficiency estimates are implausible                             26
           2.3    WICS analytical approach has other methodological flaws                          28
3          GDC’s Opt-Out household bills are likely to be much lower than government
           estimates                                                                               29
           3.1    Improved regulatory regimes will incentivise improved performance by GDC 29
                  3.1.1      Water quality regulation will likely lead to improved
                             performance by GDC                                          30
                  3.1.2      Possible improvements from economic regulation regime have
                             been overlooked                                             31
                  3.1.3      GDC management and operational competence likely to improve
                             with competition between entities for staff                 32
           3.2    GDC can increase access to finance to lower short-term costs                     32
4          GDC residents face risks and costs from Reform Scenario                                 34
           4.1    Local accountability for significant public asset and public service will be lost 34
           4.2    Local variability in service and quality levels will be lost                      34
           4.3    Loss of economies of scope increases average cost of remaining council
                  services by at least $2.05 million per annum                                      35
5          Recommended next steps                                                                  35

Tables
Table 1.1: Average bill per household (current dollars and projected 2051 dollars)
            under different financing options for reform scenario (Entity C)                        9
Table 2.1: WICS modelling approaches for the required investment                                   13
Table 2.2: Urban population statistics of New Zealand and Scotland                                 17
Table 3.1: Average bill per household (current dollars and projected 2051 dollars)
            under different financing options for GDC (Opt-out scenario)                           33
Table 3.2: Average bill per household (current dollars and projected 2051 dollars)
            under different financing options for reform scenario (Entity C)                       33

Castalia                                                                                             2
CONFIDENTIAL

Figures
Figure 0.1: Government’s predicted outcomes in Reform Scenario and Opt-Out
             Scenario                                                                     6
Figure 0.2: Net investment scenario for GDC under WICS models and GDC’s own plan          7
Figure 0.3: Asset value per connected citizen for selected water utilities                8
Figure 2.1: New Zealand’s asset gap according to WICS                                    15
Figure 2.2: Asset value per connected citizen for selected water utilities               16
Figure 2.3: Required investment after capital price inflation for GDC (WICS modelling)   19
Figure 2.4: Net investment scenario for Gisborne under WICS models and GDC’s own
             plan                                                                        20
Figure 2.5: Population densities in Gisborne, Wairoa, Napier, Hastings and
             neighbouring localities                                                     22
Figure 2.6: Population densities in Entity C area                                        23
Figure 2.7: Population density (persons per square kilometre) in Scotland                24
Figure 2.8: Impact of time-profile adjustment on new investment path under the
             Reform Scenario                                                             29

Castalia                                                                                  3
CONFIDENTIAL Definitions DIA Department of Internal Affairs GDC Gisborne District Council IPART Independent Pricing and Regulatory Tribunal LGNZ Local Government New Zealand RFI Request for Information WICS Water Industry Commission for Scotland Castalia 4
CONFIDENTIAL

Executive summary
The government is proposing to reform the drinking, waste and storm water (three waters)
sector. The reform will involve amalgamating the water services of the 67 local authorities into
four new regional statutory corporations, with centralised management and a new governance
structure. The structure will have indirect Board appointment rights for local authorities to be
shared with mana whenua representatives.
The government proposes to amalgamate the water services of Gisborne District Council (GDC)
into a new statutory corporation called “Entity C” together with the water services of
Carterton, Central Hawke’s Bay, Chatham Islands, Horowhenua, Hastings, Kāpiti Coast, Lower
Hutt, Manawatu, Marlborough, Masterton, Napier, Nelson, Palmerston North, Porirua, South
Wairarapa, Tararua, Tasman, Upper Hutt, Wairoa and Wellington (the Reform Scenario).
The government has given GDC two choices; join the Reform Scenario or Opt-Out. GDC, along
with other local authorities, has been asked by the government to consider the evidence and
whether the government’s proposal to reform the water sector will deliver benefits to its
residents. The government also committed to providing Gisborne with $29 million in funding
under the “better off” package, an additional $3 million for stranded overhead costs under the
“no worse off” package, and further compensation for any loss in GDC’s debt headroom. 1                                   0F0F

These amounts are to be part-funded from the balance sheet of the new entity.
Key question: will the Reform Scenario deliver the claimed benefits?
The key question for this report is whether the benefits for GDC that are claimed by the
government are robust, and whether the Gisborne community is likely to be better off with the
Reform Scenario.
The Reform Scenario uses analysis provided by Water Industry Commission for Scotland
(WICS), the Scottish government’s regulator of its monopoly water provider Scottish Water.
The WICS analysis and modelling underpins the case for reform. The government has relied on
WICS for the claims that significant capital investment is needed in the New Zealand water
sector, and that amalgamation into four separate entities with accompanying institutional
changes is the only way to achieve the cost-efficiencies to make the reform affordable.
The government is promising that household bills in the Reform Scenario will be eight times lower than
the amount of the Opt-Out Scenario
The government is promising that the Reform Scenario will deliver household bills that are
eight times lower than what would exist in the Opt-Out Scenario. The government claims that
the Reform Scenario will deliver Gisborne residents:
    ▪ Household bills that average $1,255 by 2051
    ▪ Improvements in service delivery and affordability
    ▪ Improvement in the ability to raise finance.
In contrast, the government’s WICS analysis claims that if GDC provides water services as an
opt-out provider, household bills would rise to $10,458 by 2051. However, the Minister of
Local Government has acknowledged the weaknesses in the 30-year WICS forecast and that

1   Local Authority Indicative Financial Tool, released by DIA, available at https://taituara.org.nz/Story?Action=View&Story_id=334

Castalia                                                                                                                          5
CONFIDENTIAL
estimated bill amounts over a cap of $8,690 will be unaffordable for affected communities.2
Therefore the 2051 bill amount quoted publicly is $8,690+.
Figure 0.1: Government’s predicted outcomes in Reform Scenario and Opt-Out Scenario
Reform Scenario is based on faulty assumptions and flawed analysis
The Reform Scenario is based on faulty assumptions and flawed analysis. The government has
not shown with sufficient certainty that the claimed benefits of the Reform Scenario will
materialise.
The benefits of the Reform Scenario rest on three key claims:
▪ That GDC (and New Zealand as a whole) needs to invest to Scottish levels of water sector
capital stock per resident
▪ The amalgamated entity will be able to achieve up to 61.9 percent in opex efficiency and
up to 50 percent in capex efficiency compared to existing opt-out entities
▪ GDC as an opt-out entity will not improve over the next 30 years.
Required investment for GDC and for New Zealand as a whole is overstated
The Reform Scenario rests on WICS’ modelling and manual adjustments that assume New
Zealand will need significantly higher levels of capital investment over the next 30 years than is
currently estimated in local authorities’ own 10-year plans. Significant additional capital
expenditure is needed in the water sector for some locations in New Zealand. This will be
needed to meet the requirements of new regulatory requirements for water quality and
environmental outcomes, as well as ensuring resilience to climate change. However, the WICS
2
Minister for Local Government, Press Release and Note for Editors:
https://www.scoop.co.nz/stories/PA2106/S00237/government-water-reforms-to-build-economic-resilience-and-save-
ratepayers-money.htm
Castalia 6CONFIDENTIAL
approach to estimating the required capital expenditure for GDC is flawed and likely overstates
it. The required capital investment, compared to GDC’s own planned investment, is illustrated
below.
Figure 0.2 shows how WICS models a significant difference in net investment for GDC in the
Opt-Out Scenario compared to GDC’s own planned capital investment.
Figure 0.2: Net investment scenario for GDC under WICS models and GDC’s own plan
400
350
300
NZ $ millions
250
200
150
100
50
0
2024
2035
2046
2022
2023
2025
2026
2027
2028
2029
2030
2031
2032
2033
2034
2036
2037
2038
2039
2040
2041
2042
2043
2044
2045
2047
2048
2049
2050
2051
Year
GDC's net investment in Opt Out (WICS modelling)
Reform Scenario Entity C capex attributable to GDC (by connections)
GDC's long term plan forecast capex
In modelling the Opt-Out Scenario, WICS claims that GDC needs to increase capital investment
from 2021 because WICS selectively and mechanistically applies a model based on Scotland
and England/Wales assumptions. This model suggests that New Zealand requires water asset
capital stock of up to $70,000 per capita. However, there is no strong evidence that Scottish
and England/Wales asset levels are relevant to New Zealand in general, or to Gisborne in
particular. When we compare asset levels per capita to a wider range of water entities in
Australia, which has closer similarities to New Zealand’s urban geography than Scotland, the
choice of the UK models is less clear.
Castalia 7CONFIDENTIAL
Figure 0.3: Asset value per connected citizen for selected water utilities
25000
20000
Asset value per head ($)
15000
Gisborne District Council
Lower Murray
10000
Coliban Gippsland Icon Water
Barwon
Wannon Central Highlands
Goulburn Valley
Tas Water
5000
Hunter Water
South Gippsland
Scottish water
Yorkshire water
0
1.50 2.00 2.50 3.00 3.50
Log 4.00
of population 4.50
density 5.00 5.50 6.00 6.50
Note: Castalia could not reconcile WICS’ estimated asset value per connected citizen for Scottish Water and Yorkshire Water based
on those entities’ annual reports. It is possible that WICS may be using undepreciated replacement values for the assets of those
entities. For our analysis, we used asset values from the relevant entities’ annual reports. As a result, the asset value per connected
citizen in this figure for Scottish Water and Yorkshire Water do not match the WICS figures illustrated in this figure. We included all
vertically integrated Australian water utilities where recent replacement values were available.
WICS significantly overstates the required capital investment because it incorrectly uses accumulated
depreciation
The required investment in WICS’ model uses a crude assumption of future replacement
capital expenditure. WICS takes GDC asset values and asset lives (reported in the RFI) and
estimates investment based on cumulative economic depreciation. This approach essentially
assumes that future replacement capital expenditure will be exactly equal to estimated future
depreciation. The impact of this crude assumption is an overstatement of the estimated
replacement capital expenditure by approximately $1.75 billion over the modelling horizon
(expressed in projected outturn prices).
Efficiency assumptions are implausible
WICS’ modelling makes implausible assumptions about the efficiency in the Reform Scenario.
The government assumes that the Reform Scenario will deliver 50 percent capital expenditure
(capex) savings and 61.9 percent operating expenditure (opex) savings.
The capex saving is not grounded in any actual evidence, but rather on WICS’ observations.
The implausibility of capex savings has also been addressed in previous analysis by Castalia for
Local Government New Zealand and the Joint Steering Committee. Economies of scale in capex
are not available in New Zealand water services, except for relatively minor potential cost
savings in procurement. The opex saving is also derived from Ofwat and Scottish observations
and there is no strong evidence it will emerge in Entity C following reform.
Castalia 8CONFIDENTIAL
GDC is likely to make some improvements in water service delivery if it opts out, yet WICS assumes no
such improvements
In any case, GDC is likely to make some improvements in its services over the next 30 years,
yet WICS’ modelling assumes that GDC will make no efficiency gains under the Opt-Out
scenario. As a result, the Opt-Out scenario, as modelled by WICS, likely overstates GDC’s costs.
GDC will be subjected to water quality regulation and obtain guidance and expertise from
Taumata Arowai. Corporatisation and improved performance of other water service providers
will lead to changes at GDC that drive better performance as GDC seeks to match the
benchmarks set.
Economic regulation is likely to apply across the sector, not just to four amalgamated entities.
The government’s assumption that it cannot regulate all council-owned water services is
inconsistent with the Commerce Commission’s regulation of electricity distribution businesses
and inconsistent with the experience in multiple overseas jurisdictions where economic
regulators are capable of regulating many entities. Economic regulation is also likely to enable
benchmarking and comparisons.
Financing changes would make a significant impact on household water bills in Opt-Out and Reform
Scenario
The 2051 water bill levels claimed by WICS change significantly with changes in the
assumptions about the borrowing capacity of water service providers in the Opt-Out or Reform
Scenario. In some parts of New Zealand, council balance sheet strength, LGFA limits and
aversion to debt can limit efficient borrowing for long-lived infrastructure. Long-term debt
instruments that match the life of the assets they finance are generally an efficient way to
ensure that the beneficiaries of infrastructure bear its costs. The debt limit assumptions used
by WICS for the Reform Scenario have a material impact on the level of the 2051 household
bill. This is illustrated in Table 1.1below.
Table 1.1: Average bill per household (current dollars and projected 2051 dollars) under different
financing options for reform scenario (Entity C)
Average bill per Average bill per % Change (Increase in
household (current household ($ bills)
dollars) 2051)
645% debt to revenue limit 1,257.23 2,464.18
(Actual Modelled)
280 % debt to revenue Limit 2,464.85 4,831.10 96.05
250 % debt to revenue Limit 2,676.12 5,245.19 112.86
GDC should examine how it can provide a constructive counter-proposal to the government
Water services are critical to wellbeing, so it is very important that the full range of options are
considered that are locally appropriate. Other than opting out, the Reform Scenario is the only
option that has been presented to GDC and other local authorities by central government.
Water services should be safe, resilient, reliable, and customer-responsive, at least cost. Some
reform of the sector is necessary for some parts of New Zealand. However, the analysis needs
to be done to determine where water services fall short of this objective and for what reasons.
Castalia 9CONFIDENTIAL The government’s evidence base and analysis does not establish if the reforms provide a net benefit to GDC. We recommend that GDC carry out a proper net benefit analysis, potentially with other local authorities that have a similar viewpoint. This is likely to be many councils, since the WICS analysis has consistent faults that apply to all local authorities. There is plenty of analysis, evidence and now a rich data set in the RFI responses for GDC and like-minded local authorities to be able to identify alternative and better reform options. For example, the four local authorities in Hawke’s Bay have already undertaken work on a shared model supported by analysis that suggests some benefits are available. GDC could prepare a constructive counter-proposal that achieves desirable objectives, while avoiding the risks and costs of the Reform Scenario. Castalia 10
CONFIDENTIAL

1               Introduction
The New Zealand government is proposing to reform the drinking, waste and storm water
(three waters) sector. It proposes to amalgamate the three waters services of the 67 local
authorities into four regional public corporations.
The government is proposing to amalgamate GDC’s water services into a new statutory
corporation called “Entity C” together with the water services of Carterton, Central Hawke’s
Bay, Chatham Islands, Horowhenua, Hastings, Kāpiti Coast, Lower Hutt, Manawatu,
Marlborough, Masterton, Napier, Nelson, Palmerston North, Porirua, South Wairarapa,
Tararua, Tasman, Upper Hutt, Wairoa and Wellington (the Reform Scenario). The government
has presented the only alternative to the Reform Scenario as being a situation where GDC
remains as a standalone water service provider under council control (the Opt-Out Scenario).
This report analyses the evidence underpinning both the Reform Scenario and the Opt-Out
Scenario as follows:
    ▪ The Reform Scenario is analysed, and its underlying assumptions are tested to determine
      whether the stated level of household bills is robust (section 2). Specifically the analysis
      reviews:
           – The estimates of the required level of assets for the Reform Scenario (section 2.1)
           – The estimated efficiencies apparently available in the Reform Scenario (section 2.2)
           – Other aspects of the methodology that raise questions (section 2.3).
    ▪ The Opt-Out Scenario is analysed, and its underlying assumptions are tested to
      determine whether the stated level of household bills is robust (section 3)
    ▪ Finally, the risks and costs to the GDC community with the Reform Scenario are
      examined (section 4).

2               Government’s Reform Scenario
                produces implausible household bill
                estimates
The Reform Proposal predicts household bills for 2051. The WICS analysis rests on two key
assumptions: First, that the capital stock invested in New Zealand water services needs to
increase by a very large amount. Second, that the Reform Scenario will deliver large efficiency
gains compared to the Opt-Out Scenario. In our view, WICS’ assumed scale of the required
increase in capital stock, and of the achievable efficiency gains under the reforms, are both
implausible.

2.1             Required investment estimate is overstated
The government’s case for reform rests on a claim that New Zealand water services require a
significant capital investment over the next 30 years. The government relies on WICS advice
and analysis to set the level of investment for the Reform Scenario from 2021 to 2051.

Castalia                                                                                           11
CONFIDENTIAL
WICS’ modelling is entirely based on a top-down, New Zealand-wide assumption that a
massive nationwide investment programme is necessary for all council water services. This is
despite GDC and all other local authorities submitting detailed bottom-up information about
planned capital investment.
Capital investment is needed in some parts of New Zealand now and in the next 30 years to
meet the demands of growth and due to historical deferred and underinvestment. There have
been high-profile asset failures. However, it is not as clear that the investment is needed in all
places, at the scale WICS claim.
WICS is selective in estimating the nationwide required investment amount. WICS also used
inappropriate Scottish comparators to support its claim that New Zealand needs to invest at
equivalent levels. WICS’ estimate of required investment is significantly higher than the levels
of investment that asset-owner GDC has estimated will be required.
WICS used projected investment requirements across three investment types that include
replacement or renewal investment, enhancement investment, and growth investment
projections. These projections are based on assumptions relating to asset lives, replacement
costs, inflation, population density, and projected connections growth.
2.1.1 WICS approach to estimating required investment is unsound
In order to estimate the required investment, WICS used English and Scottish comparators.
WICS allocated New Zealand-wide investment requirements for councils based on statistical
relationships and observed experiences in England and Scotland. The total investment
required is made up of two key components that include ‘enhancement and growth’ and ‘asset
replacement and refurbishment’.
WICS modelled the required investment using three approaches (which we label A, B and C).
WICS then cross-checked the modelled investment against information gathered from
councils’ RFI responses. The modelled investment from the three approaches, plus investment
specified in councils’ RFI responses are summarised in Table 2.1.
WICS took three steps with each of its three modelling approaches:
▪ Step 1 is to apply econometric models to predict New Zealand’s investment needs
▪ Step 2 is to manually adjust the Step 1 estimate for differences in growth
▪ Step 3 is to apply a cap of $70,000 to reflect an assumption about the ability to pay for
the investment.
Castalia 12CONFIDENTIAL
Table 2.1: WICS modelling approaches for the required investment
Approach Enhancement and Growth Investment ($ billions) Asset Total
replacement and Investment 3 1F1F
refurbishment ($ ($, billions)
Step 1: Step 2: Manual Step 3: Apply
billions)
Unadjusted adjustment for cap of $70,000
model output “differences in per connected
(NZ $, billions) growth” citizen
A Great Britain 49 – 69 63-83 57-77 63-77 120-154
comparative
Models
B Scotland only 73- 99 87 -113 77-100 70-86 148-185
comparative
models (WICS
preferred)
C Asset value 52-57 81-85 77-81 70-79 148-160
comparisons
with UK 42F2F
Information 53 N/A N/A 61-69 115-122
included in
councils’ RFI
Source: WICS Final Report
WICS makes no adjustment for the overlapping nature of growth and replacement investment
We note that, in practice, when enhancement and growth investment takes place, the new
upgraded assets often replace at least some ageing assets, thus reducing the need for
replacement expenditure. WICS’ approach appears to have made no adjustment for this, since
the total investment is calculated as the simple sum of ‘enhancement and growth' and ‘asset
replacement and refurbishment’. The estimates for the two categories are derived separately,
with no consideration of the interaction between the two. This means that WICS’ total
investment estimate will be overstated.
WICS’ preferred model appears highly selective
WICS’ models in approaches ‘A’ (Great Britain comparative) and ‘C’ (comparing asset values)
produce a level of enhancement and growth investment in Step 1 that is broadly consistent
with councils’ RFI responses.
Yet despite the consistency with councils’ own estimates of investment, WICS’ preferred
model is approach ‘B’. Approach ‘B’ reports significantly higher required levels of investment.
3 Total investment is calculated adding enhancement and growth estimates taken from estimates after applying a cap of
NZ$70,000 per connected citizen and the asset replacement and refurbishment expenditures. The range represents the
modelled low and high values of investment requirements.
4 This approach is briefly explained by WICS to use projected investment that is required to match the levels of asset values per
connected citizen in the UK and Scotland for 2020 after adjusting for depreciation and connection differences.
Castalia 13CONFIDENTIAL
WICS Step 2 and Step 3 adjustments to its models are unsound
WICS’ ‘enhancement and growth investment’ models in approaches ‘A’ and ‘B’ are apparently
driven by population density. 5 That is to say, the models should automatically predict the
3F3F
required level of investment, given population density in New Zealand. However, WICS has
manually increased the required level of investment to “adjust for differences in growth”.
WICS then made a further manual adjustment and imposed an investment constraint cap of
$70,000 per connected citizen due to affordability concerns, because mechanistically applying
the Scotland comparator (Step 1) and manual adjustments (Step 2) leads to even higher and
even more implausible levels of investment.
A better approach would be to evaluate local authorities’ own estimates of required investment
All local authorities in New Zealand agreed to provide the government with comprehensive
information about water services during the Request for Information (RFI) phase in mid-2020.
The RFI responses included a full picture of all local authorities’ planned water sector
investment.
Local authorities, as asset owners with accountability to local communities, have a sound
understanding of the investment needs required in three waters’ services.
WICS could have used this detailed and rich data source to estimate the required investment
levels. WICS could have made adjustments to the RFI data to account for any conservatism, or
to account for differences in the sophistication of management in estimating investment needs
and for investment to comply with future regulations and resilience to climate change.
However, WICS preferred top-down modelling using overseas comparators.
2.1.2 Required investment level is based on inappropriate Scottish
comparators
WICS estimate of New Zealand's water investment needs is based on the assumption that it
must match investment levels in Scotland. This is justified on the grounds that NZ has a
relatively lower level of urbanisation. 6 However, WICS does not use urbanisation figures in its
4F4F
analysis. Instead, it uses population density, which is a different concept.
WICS concludes that Scotland is the most appropriate guide for the required level of
investment because of New Zealand’s low population density compared to other areas in the
United Kingdom.
WICS predicts New Zealand’s water investment needs based on correlation with population density
WICS identifies a correlation between English and Scottish drinking water and wastewater
asset value levels and population density. This is illustrated in Figure 2.1, which we reproduced
from WICS’ report. Based on the correlation between asset value levels and population
density, WICS suggests that NZ investment needs to rise significantly. According to this
correlation, New Zealand’s top-down, national-level required investment is $10,000 lower than
it should be.
5 WICS supporting material 1 – required investment (slide 33), https://www.dia.govt.nz/diawebsite.nsf/Files/Three-waters-
reform-programme/$file/wics-supporting-material-1-required-investment.pdf
6 WICS supporting material 1 – required investment (slide 19), https://www.dia.govt.nz/diawebsite.nsf/Files/Three-waters-
reform-programme/$file/wics-supporting-material-1-required-investment.pdf
Castalia 14CONFIDENTIAL Figure 2.1: New Zealand’s asset gap according to WICS Source: WICS final report Population density is not a good predictor of required asset value levels However, WICS does not show how the weak correlation in Scotland and England might predict water investment needed in New Zealand. No causal link is drawn. We were also unable to reconcile WICS’ asset value per connected citizen figures for Scottish Water and Yorkshire. These are much higher than what is implied by the asset values listed in those entities’ annual accounts. It is possible that WICS may be using undepreciated replacement values for the assets of those entities, which should not be compared to the optimised depreciated replacement values submitted by GDC. We analysed other regulated water utilities, including in Australia, to determine whether there was a clear relationship between asset level per connected citizen and population density. Australia has some similarities with New Zealand in that its population is highly urbanised, but overall population density is quite low, because towns are far from each other. Australia’s towns developed at a similar time to New Zealand’s and therefore follow the same typical geography (detached houses on suburban sections). Figure 2.2 shows a plot of asset value per connected citizen for water utilities in Australia, Scottish Water, Yorkshire Water and GDC. For our analysis, we used asset values from the relevant entities’ annual reports. As a result, the asset value per connected citizen in this figure for Scottish Water and Yorkshire Water does not match the WICS figures in Figure 2.1. There is a very weak relationship between population density and asset value per connected citizen as identified by WICS. Figure 2.2 shows that by adding or removing comparator water providers, the correlation line could change markedly. Castalia 15
CONFIDENTIAL

Figure 2.2: Asset value per connected citizen for selected water utilities
                            25000
                            20000
 Asset value per head ($)
                            15000

                                                                 Gisborne District Council
                                           Lower Murray
                            10000

                                                                  Coliban                Gippsland               Icon Water
                                                                                                Barwon
                                               Wannon                         Central Highlands
                                                           Goulburn Valley
                                                             Tas Water
                            5000

                                                                                                         Hunter Water
                                                              South Gippsland
                                                                                       Scottish water
                                                                                                                    Yorkshire water
                            0

                                    1.50      2.00        2.50     3.00      3.50       4.00     4.50     5.00     5.50       6.00    6.50
                                                                            Log of population density

Note: Castalia could not reconcile WICS’ estimated asset value per connected citizen for Scottish Water and Yorkshire Water based
on those entities’ annual reports. It is possible that WICS may be using undepreciated replacement values for the assets of those
entities. For our analysis, we used asset values from the relevant entities’ annual reports. As a result, the asset value per connected
citizen in this figure for Scottish Water and Yorkshire Water do not match the WICS figures illustrated in Figure 2.1. We included all
vertically integrated Australian water utilities where recent replacement values were available.

There are significant differences between Scotland and New Zealand geographies
Scotland is not a relevant comparator for New Zealand water services because of fundamental
differences between the two countries’ geography. In water services, geography is important
for the cost and quality of service. Denser urban areas tend to have lower average costs of
service. Water services with more dispersed customers have to distribute drinking water and
pump wastewater over longer distances with more pipes, dispersed treatment infrastructure
and higher costs. Aside from some high-level discussion of available water sources, and similar
populations, WICS has not investigated why Scotland’s geography is a good predictor of New
Zealand’s water investment needs.
The total land area and the geographical distribution of the populations are very different.
WICS incorrectly assumes that lower population density in New Zealand implies lower levels of
urbanisation. Table 2.2 illustrates how New Zealand’s population is more urbanised than
Scotland’s, but despite this, New Zealand still has a lower population density. A larger majority
of New Zealand’s population live in urban areas, and the urban population is more likely to
grow in New Zealand as compared to Scotland.

Castalia                                                                                                                                 16
CONFIDENTIAL
Table 2.2: Urban population statistics of New Zealand and Scotland
Population Urban population Population in the Urban population
Density(people per (% of population) largest city (% of growth (annual %)
sq. km of land are) urban population)
New Zealand 18.6 86.7 36.4 (Auckland) 2.2
Scotland 65 83.04 75F5F 11.6 (Glasgow) -0.06 86F6F
Source: World Bank Indicator Database, 2020
WICS’ use of population density to drive required investment produces an absurd result for sparsely
populated Tairāwhiti
When WICS’ population density approach is applied in modelling for Tairāwhiti, it produces the
implausible results. WICS models a massive capital expenditure amount for GDC under the Opt
Out Scenario of $2.7 billion for “required enhancement and growth” investment over the
modelling horizon. This explains why WICS’ predicted bill is $10,458 by 2051.
The massive investment assumption is driven by WICS’ assumptions about population density.
WICS’ assumes that Gisborne has a very low population density across the whole district, as if
water services will be provided by GDC in all localities. The main urban locality in GDC’s area is
Gisborne city (population 37,000). Reticulated water and wastewater services are provided in
Gisborne city. The next largest towns are Tolaga Bay (population 811) and Ruatōria (population
759). The remaining Gisborne District is sparsely populated farmland, forestry and forest park
and covers 8,355 square kilometres. Tolaga Bay and Ruatōria may require reticulated services
in future. It is unlikely that other towns and hamlets will require large-scale water
infrastructure investment that household or community-based water systems could not
service. Yet WICS’ population density approach appears to drive an assumption that significant
investment is needed across a wider area.
DIA’s Beca New Zealand report shows some similarities between Scottish and future New Zealand
regulations but does not address the fundamental flaws with WICS’ approach
DIA also obtained a report from water engineering experts Beca New Zealand 9 which F7F
compared the regulatory environment and industry practices in Scotland. Beca New Zealand
does not compare whether the level of investment modelled by WICS is appropriate, only that
the assumptions about the regulatory environment bear similarities. Beca New Zealand’s
report explicitly does not cover differences in financial or accounting practices (such as asset
depreciation and renewals, asset insurance, debt management and so on) between Scottish
Water utilities and New Zealand local authorities. Crucially, it is these matters that have
undermined WICS’ estimates of required investment.
7 https://www.gov.scot/publications/rural-scotland-key-facts-2018/pages/2/
8 Urban population as a percent of total population has decreased by 0.06 percent between 2018 and 2019.
https://www.nrscotland.gov.uk/statistics-and-data/statistics/statistics-by-theme/population/population-estimates/2011-
based-special-area-population-estimates/population-estimates-by-urban-rural-classification
9
Beca New Zealand (2021), DIA Three Waters Reform WICS Modelling Phase 2: Review of Assumptions between Scotland and
New Zealand Three Waters Systems, available at: https://www.dia.govt.nz/diawebsite.nsf/Files/Three-waters-reform-
programme/$file/beca-report-dia-three-waters-reform-wics-modelling-phase-2.pdf
Castalia 17CONFIDENTIAL
It is true that some additional investment is needed in some parts of New Zealand to comply
with future regulatory requirements, and to improve resilience of water services to climate
change. Beca New Zealand’s report is useful to compare the regulatory regimes and network
technical similarities. However, Beca New Zealand’s report cannot (and does not) provide a
view on whether WICS’ top-down analysis and crude modelling techniques give accurate
insights on the level of investment required.
2.1.3 WICS’ required investment estimate is implausibly high due to
accumulated depreciation
GDC’s investment plans in its 10-year plan and longer-term investment planning are
significantly lower than the WICS estimates for the Opt-Out Scenario. GDC’s RFI response
shows that its planned investment is significantly below the level that WICS’ model predicts.
GDC compares more favourably than Scottish Water in terms of asset values per connected
citizen, as illustrated in Figure 2.2
WICS estimates future investment using a highly irregular approach that overstates replacement capital
expenditure
WICS takes GDC asset values and asset lives (reported in the RFI) and estimates investment
based on cumulative economic depreciation. This approach essentially assumes that future
replacement capital expenditure will be exactly equal to estimated future depreciation. This is
a very crude assumption. The depreciation-derived estimates are far inferior to the bottom-up
capex forecasts developed by GDC and other local authorities for the purposes of their 10-year
long-term plans and longer-term capital investment plans, which could subsequently be
adjusted for assumptions about additional investment for regulatory compliance.
WICS use of cumulative economic depreciation is particularly problematic when applied to
modelling the replacement of “new assets”—the assets WICS models as “required
enhancement and growth capital expenditure”. Essentially, the WICS model assumes that one
year after a new asset is created, part of that asset must be replaced. WICS then models such
part replacements to occur every year until the end of the asset’s useful life. This approach
clearly does not reflect reality, where assets are generally replaced once and usually towards
the end of their useful life. WICS assumes that the long-life assets will have an asset life of at
least 84 years, while the short-medium-life assets will have an asset life of at least 24 years. It
is hard to see how large-scale asset replacement of new assets could possibly take place within
the modelling horizon, which only extends to 30 years.
As a result, just this aspect of WICS’ modelling for Gisborne overestimates replacement capital
expenditure by approximately $1.75 billion over the modelling horizon (expressed in projected
outturn prices)
Figure 2.3 illustrates the components of required investment for GDC, separating the asset
replacement and refurbishment into two components.
Castalia 18CONFIDENTIAL
Figure 2.3: Required investment after capital price inflation for GDC (WICS modelling)
400
350
300
NZ $ milions
250
200
150
100
50
0
Year
Capital Maintenance/ asset replacement (projected outturn prices)
Cumulative economic depreciation on new assets (projected outturn prices)
Required enhancement and growth capital expenditure (projected outturn prices)
Cumulative economic depreciation makes up a significant portion (28.15 percent) of the total
investment requirement for GDC. WICS has taken the GDC asset values and asset lives
reported in the RFI only for the asset replacement component of the total investment for GDC
(6.03 percent).
GDC’s own long-term capital investment plan has significantly lower levels of investment than WICS
model
Figure 2.4 illustrates the significant difference between WICS’ modelled net investment needs
for GDC, and GDC’s own planned capital investment. 10 We also calculated the capital
8F8F
investment attributable to GDC in Entity C using WICS’ model and find that it is lower that the
Opt Out scenario investment, but still somewhat higher than GDC’s own investment plans. 11 9F9F
10 Total investment for GDC unconstrained scenario is derived from its Long-Term Plan and internal capital investment planning
to 2051.
11 Amalgamated entity investment attributable to GDC has been calculated by attributing the net investment from the WICS
models for Entity C proportionate to the total number of connections for GDC.
Castalia 19CONFIDENTIAL
Figure 2.4: Net investment scenario for Gisborne under WICS models and GDC’s own plan
400
350
300
NZ $ millions
250
200
150
100
50
0
2024
2034
2022
2023
2025
2026
2027
2028
2029
2030
2031
2032
2033
2035
2036
2037
2038
2039
2040
2041
2042
2043
2044
2045
2046
2047
2048
2049
2050
2051
Year
GDC's net investment in Opt Out (WICS modelling)
Reform Scenario Entity C capex attributable to GDC (by connections)
GDC's long term plan forecast capex
2.2 Efficiency estimates for Reform Scenario are
implausible
WICS uses efficiency assumptions in its analysis of the amalgamated entity (Entity C). The
efficiency assumptions drive significant cost savings for the Reform Scenario. WICS assumes
that:
– Capital expenditure (capex) efficiency will reach 50 percent
– Operating expenditure (opex) efficiency will reach 61.9 percent
It also assumes a total factor productivity efficiency improvement of 0.4 percent per annum for
the Reform Scenario but not for GDC as an opt-out entity. These efficiency estimates are highly
implausible.
2.2.1 Capex efficiency estimates are implausible
WICS claims that the Reform Scenario will result in 50 percent lower capital costs. WICS claims
that Entity C will progressively improve its capex efficiency so that by 2041 it is saving 50
percent per annum. That is, by 2041, for each $0.50 invested, Entity C will get $1.00 of capex
value. This is an implausible assumption for the following reasons:
▪ The assumption is not sourced to any credible authority or from any observed experience
that is relevant to New Zealand
▪ WICS has not shown how Scottish Water capex has any bearing on New Zealand water
services and geography
Castalia 20CONFIDENTIAL
▪ Recent comments on Castalia’s analysis by DIA do not shed any new light on this
question
▪ Some entity C councils have already achieved available economies of scale
▪ Only relatively minor economies of scale are available in New Zealand water services
▪ The assumption has been criticised by government-appointed peer reviewers
▪ The assumption does not consider diseconomies of scale.
The Entity C model results are highly sensitive to this assumption, so if it is wrong, the benefits
of the Reform Scenario change drastically.
WICS capex efficiency is based on a single source of information
WICS capital expenditure assumption is based solely on a belief that it “seems reasonable to
expect a reformed three waters industry in New Zealand to match the efficiency improvement
of the industry in Scotland and by the water and sewerage companies in England and Wales.”
The only quantitative analysis WICS says it has undertaken to support this belief is an
observation that Scotland improved capital expenditure efficiency from 2002-2021. This
quantitative analysis has not been substantiated in any documents released to GDC. There are
many reasons why Scottish Water may have improved reported capital expenditure efficiency.
These reasons are likely to be specific to Scottish Water. Decision-makers need an explanation
of those reasons to understand whether the same improvements can be achieved in New
Zealand entities. WICS provides no such explanation.
The citation used in the Entity C model 12 is also misleading. WICS incorrectly cites the source
10F10F
for the capital efficiency improvement as “based on observed experience from GB”. However,
the actual source of WICS’ capital efficiency assumption is not Great Britain at all. Rather WICS
cites 13 the single observation of claimed efficiency improvements by Scottish Water from
11F11F
2002-2021.
WICS claims that the capex efficiency will come from:
▪ Economies of scale
▪ Clarity of policy priority
▪ Robust water quality and environmental regulation
▪ Economic regulation
▪ Excellence in management.
WICS does not disclose the relative contribution of these factors to the total 50 percent
efficiency gain. In section 3 below, we discuss how water service providers in the Opt-Out
Scenario are likely to improve as a result of the improved water quality regulatory regime, how
management may improve, and how it is possible that economic regulation could apply to
other water services (not just the amalgamated entities).
12 And in the models for Entity A, Entity B and Entity D.
13 WICS slidedeck “Entity C: the use and analysis of the RFI information and other benchmarks”, available at:
https://www.dia.govt.nz/Three-Waters-Reform-Individual-council-models-and-slidepacks
Castalia 21CONFIDENTIAL
Recent comments from DIA do not shed any new light on the economies of scale question
In response to Castalia’s work for other local authorities, DIA subsequently referred
stakeholders to a 2018 Frontier Economics report claiming to support a claim that the
efficiencies are justified. 14 However, that report relates to efficiency gains following
2F
privatisation of the English water and sewerage companies. The English (and Welsh) water
companies were the result of an amalgamation in 1972 that pre-dated the Thatcher-led
government privatisation by 17 years. Again, DIA makes the error of confusing the efficiency
gains that followed from the privatisation and regulation of the poorly performing regional
public water corporations in England and Wales in 1989 with benefits of amalgamation.
Castalia’s report to LGNZ in September 2020 on reform options, entitled “Comparative Analysis
of Institutional Forms in Water Services”, has a full discussion of this history. The report was
released to LGNZ’s members in August 2021.15
Scotland is an inappropriate model for Gisborne and Entity C
The population within the Entity C boundaries live across a wide geographic area, in a mixture
of mostly urban settings. There are significant distances between each urban area. In GDC’s
case, the neighbouring councils are Wairoa District, Napier City and Hastings District to the
South. Entity B councils are to the West. Sparsely populated, remote and inaccessible farmland
sits between the settlements. The distance from Gisborne to Wairoa (itself a town of only
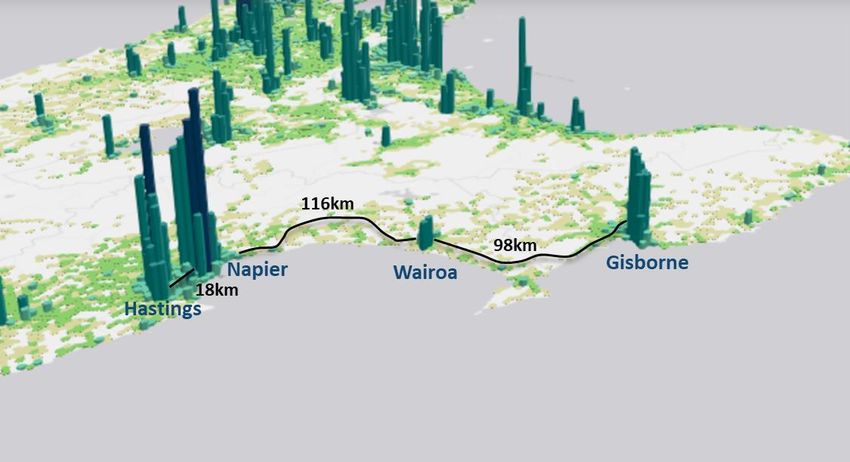
8,600 people) is 98 kilometres. It is a further 116 kilometres to Napier. Figure 2.5 illustrates
the population densities around Gisborne.
Figure 2.5: Population densities in Gisborne, Wairoa, Napier, Hastings and neighbouring localities
Statistics NZ, available at: https://statsnz.maps.arcgis.com/
14 https://www.water.org.uk/wp-content/uploads/2018/11/Water-UK-Frontier-Productivity.pdf.
15 LGNZ’s public release is available here: https://www.lgnz.co.nz/assets/LGNZ-release-of-Castalia-reports-context-and-response-
v2.pdf
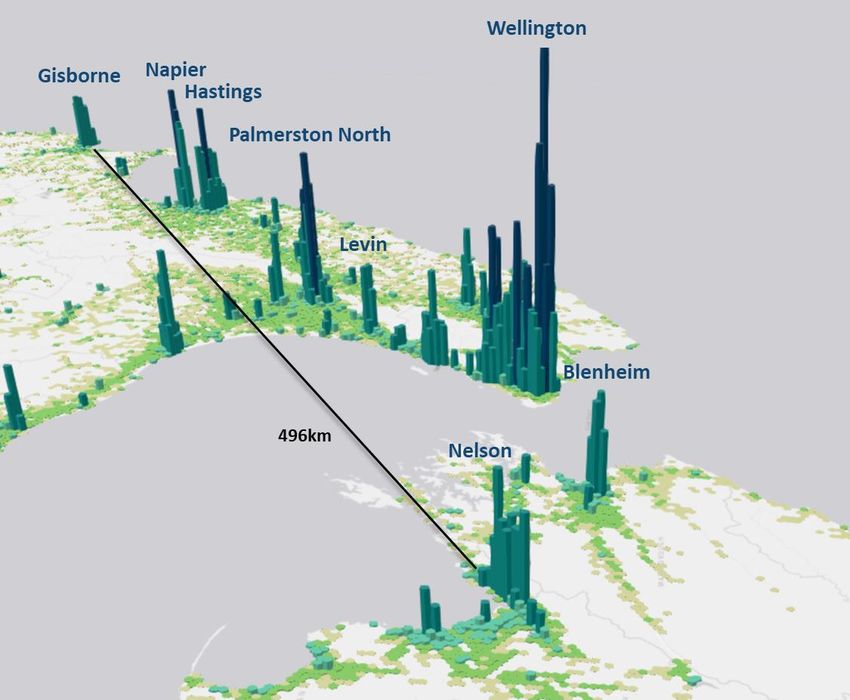
Castalia 22CONFIDENTIAL Within Entity C there are cities (Wellington, Lower Hutt, Porirua, Upper Hutt, Palmerston North, Napier) and urban townships, which almost all have significant distances between them. The Cook Strait separates Marlborough, Nelson and Tasman from the rest of the Entity C council areas (and the Chatham Islands). The distance from Tairāwhiti in the North to Takaka in the South is over 500 kilometres. Figure 2.6 illustrates these population densities and distances. Figure 2.6: Population densities in Entity C area Statistics NZ, available at: https://statsnz.maps.arcgis.com/ The geographic profile around Gisborne and in the Entity C area is different from Scotland, where 80 percent of the population lives in the larger central belt and around areas between Glasgow and Edinburgh (Figure 2.7). There is potential for agglomeration efficiencies and for networks to achieve some scale benefits based on proximity alone. Castalia 23
CONFIDENTIAL

Figure 2.7: Population density (persons per square kilometre) in Scotland

Data Source: https://www.worldpop.org/ (3D map generated by Castalia)

In contrast, the population of proposed Entity C lives in urban areas with significant distances
between them. This means that the “asset optimisation” (that is, the ability to consolidate
water networks between towns) is likely to be much lower than as claimed by WICS due to
significant distances between New Zealand towns.
Several Entity C local authorities have already achieved many available economies of scale
Where urban areas within Entity C adjoin, the local authorities already achieve some
efficiencies by sharing services. Nelson City Council and Tasman District Council share the costs
of the Bell Island wastewater treatment plant, which takes wastewater from the urban areas
of Stoke and Tahunanui in Nelson City and Richmond in Tasman District respectively. 16 Six                       13F13F

local authorities in the Wellington region own a shared management company—Wellington
Water—that achieves some management (opex) and procurement (capex) efficiencies. This
makes sense because of the proximity of the urban areas and for historical reasons; the
Wellington City water supply has mostly come from within the boundaries of Lower Hutt city
for over 100 years. Many local authorities within the Entity C area also procure services from
third party providers that compete with one another.Economies of scale are not available in
water services from amalgamations at the level WICS claims
Castalia has previously advised DIA, LGNZ and the Joint Steering Committee that the
economies of scale claimed in WICS’ 2020 slidedecks from administrative amalgamations were
implausible. In New Zealand, only minor economies of scale are achievable through
institutional reform, and these will be mostly in management and procurement (not
infrastructure capex). 17 Castalia showed that economies of scale are unlikely to be available in
                              14F14F

New Zealand on the basis of the evidence presented by WICS, Frontier Economics and in the
economic literature relied on by the government. The findings in Castalia’s 2020 Economies of
Scale report have not been rebutted.

16   Nelson City Council WWTP website: http://www.nelson.govt.nz/services/facilities/infrastructure/nwwtp/
17   Castalia (2020), Analysing Economies of Scale in New Zealand Water Services: Report to Local Government New Zealand

Castalia                                                                                                                   24
CONFIDENTIAL
WICS claims that the 50 percent capex efficiency gain emerges when water entities achieve a
population of 800,000 or more. It also claims that entities serving a minimum population of
59,000 increase capex efficiency as they approach the 800,000 population number. This claim
has no basis in the economic literature.
In fact, economic literature that has looked at the specific question of whether economies of
scale are available from administrative amalgamations provides a clear answer: there are none
available from amalgamation alone, except in highly specific circumstances which are not
present in New Zealand. 18 15F15F
Economies of scale estimate is not based on credible evidence
When preparing the 2020 Economies of Scale report, Castalia reviewed the WICS 2020
slidedecks. Access to the underlying models and assumptions was refused. In the 2020
Economies of Scale report, we were advised 19 that the economies of scale assumption was
16F16F
based on England, Wales and Scotland observations. However, we now know that the
supporting evidence for the 50 percent capex efficiency is a single Scottish observation from
2002-2021. 20 17F17F
WICS economies of scale claims are rejected by peer reviewers FarrierSwier
FarrierSwier peer-reviewed WICS’ approach, and we understand had access to the underlying
models. It found that “WICS analysis cannot be used to definitively conclude that
amalgamation in and of itself will lead to material efficiency gains in New Zealand”. 21 Its 18F18F
review did not assess whether the outputs from the WICS analysis are reasonable or free from
error. 2219F19F
FarrierSwier also state “significant care should be taken when relying on the capital efficiency
gaps estimated by WICS. This is particularly important, given the significant step up in
investment forecast for the 30-year period and the role that the capex efficiency assumption
plays when estimating benefits from amalgamation and associated reform.” Like Castalia,
FarrierSwier express concern with the sensitivity analysis approach.
Diseconomies of scale not considered
Diseconomies of scale can emerge from administrative amalgamations in water services. This
was not considered in WICS’ modelling.
WICS has overlooked a relevant case from Australia. In 1992, Melbourne and Metropolitan
Board of Works merged with several smaller urban water authorities to form Melbourne
Water. However, in 1995, the entity was disaggregated, and Melbourne Water reformed to
become a wholesale water company only. City West Water, South East Water and Yarra Valley
Water became separate retail water companies. 23 Several studies confirm that the three
20F20F
18
Castalia (2020), Analysing Economies of Scale in New Zealand Water Services: Report to Local Government New Zealand
19 Conference call between Castalia and WICS (Alan Sutherland) on 20 August 2020
20 WICS (2021), Slidedeck “Entity C: the use and analysis of the RFI information and other benchmarks”, available at:
https://www.dia.govt.nz/Three-Waters-Reform-Individual-council-models-and-slidepacks
21 FarrierSwier (2021), Three Waters Reform: Review of the methodology and assumptions underpinning economic analysis of
aggregation, p. 29
22 FarrierSwier (2021), Three Waters Reform: Review of the methodology and assumptions underpinning economic analysis of
aggregation, pp. iv-v
23 Melbourne Water website, accessed in August 2021, available at: https://www.melbournewater.com.au/water-data-and-
education/water-facts-and-history/history-and-heritage/timeline-our-history
Castalia 25CONFIDENTIAL
disaggregated retail water entities achieved significant cost efficiencies and service level
improvements compared to Australian and international water companies since the
disaggregation of Melbourne Water. 24 A benchmarking analysis using data from 2002-2003
21F21F
concluded that the three separate retailers performed “at or near the determined efficiency
frontier”. 25 It also made major improvements in customer services in comparison to major
22F22F
urban water authorities in Australia. Melbourne’s disaggregated water entities even
performed better than UK water companies, according to Ofwat. 26 23F23F
2.2.2 Opex efficiency estimates are implausible
Efficiency estimates derived from econometric studies in the UK are used in the Reform
Scenario to drive a claimed 61.9 percent saving in opex.
WICS use econometric models to claim that opex efficiencies of 61.9 percent are possible
WICS has used an Ofwat 2004 econometric model to estimate that, after reform, the larger
Entity C can achieve up to a 61.9 percent efficiency improvement to operating expenditure
(opex). Ofwat has ceased using this 2004 model and now prefers a very different approach.
To estimate the opex efficiencies, WICS combined 2003-2004 data from the UK with recent
data from New Zealand councils to estimate a performance baseline to measure New Zealand
water entities against. To ensure compatibility of the estimates with New Zealand’s operating
environment, the gaps in efficiency between New Zealand entities and the benchmark were
adjusted with ‘special factors’ related to regulatory, geographic and environmental factors that
were considered unique to New Zealand.
Based on observed efficiency gains from UK water reforms, WICS assumes that New Zealand
water reforms may achieve the same operating efficiency results – roughly a 50 percent
improvement plus additional improvements for ‘special factors’.
It is important to note that these estimates are an assumed benchmark that provides a guide
to what might be possible based on experiences in the UK water sector but, as peer reviewer
FarrierSwier notes, care needs to be taken as it is not possible to conclude that those
efficiencies can be realised. 27 24F24F
From observations of UK data, larger water entities (those serving populations greater than
800,000) realised larger efficiency improvements than smaller entities. As such, WICS assumes
that given the small size of individual councils in New Zealand, the councils will not be able to
fully realise the predicted efficiency improvements if they do not amalgamate.
Finally, DIA has claimed to stakeholders that relaxation of the debt constraints on local
authorities can contribute to operating efficiency gains. DIA cites the potential relaxation of
Auckland Council’s debt constraints as a contributor to operating efficiencies for Watercare in
24 Water Ways: Inquiry into Reform of the Metropolitan Retail Water Sector (2007).
https://www.dtf.vic.gov.au/sites/default/files/2018-02/reform-of-the-metropolitan-retail-water-sector-inquiry.pdf
25 Coelli and Walding (2006), "Performance measurement in the Australian water supply industry: A preliminary analysis."
Performance measurement and regulation of network utilities, 29-61.
26 Annual Report 2007-08 (Ofwat)
https://assets.publishing.service.gov.uk/government/uploads/system/uploads/attachment_data/file/250280/0589.pdf
27 FarrierSwier (2021), Three Waters Reform: Review of the methodology and assumptions underpinning economic analysis of
aggregation, page 60
Castalia 26You can also read