Age adjusted interpretation of biomarkers of renal function and homeostasis, inflammation, and circulation in Emergency Department patients
←
→
Page content transcription
If your browser does not render page correctly, please read the page content below

www.nature.com/scientificreports

                OPEN             Age‑adjusted interpretation
                                 of biomarkers of renal function
                                 and homeostasis, inflammation,
                                 and circulation in Emergency
                                 Department patients
                                 Bart G. J. Candel1,2*, Jamèl Khoudja1, Menno I. Gaakeer3, Ewoud ter Avest4, Özcan Sir5,
                                 Heleen Lameijer6, Roger A. P. A. Hessels7, Resi Reijnen8, Erik van Zwet9, Evert de Jonge10 &
                                 Bas de Groot1

                                 Appropriate interpretation of blood tests is important for risk stratification and guidelines used
                                 in the Emergency Department (ED) (such as SIRS or CURB-65). The impact of abnormal blood test
                                 values on mortality may change with increasing age due to (patho)-physiologic changes. The aim of
                                 this study was therefore to assess the effect of age on the case-mix adjusted association between
                                 biomarkers of renal function and homeostasis, inflammation and circulation and in-hospital mortality.
                                 This observational multi-center cohort study has used the Netherlands Emergency department
                                 Evaluation Database (NEED), including all consecutive ED patients ≥ 18 years of three hospitals.
                                 A generalized additive logistic regression model was used to visualize the association between
                                 in-hospital mortality, age and five blood tests (creatinine, sodium, leukocytes, C-reactive Protein,
                                 and hemoglobin). Multivariable logistic regression analyses were used to assess the association
                                 between the number of abnormal blood test values and mortality per age category (18–50; 51–65;
                                 66–80; > 80 years). Of the 94,974 included patients, 2550 (2.7%) patients died in-hospital. Mortality
                                 increased gradually for C-reactive Protein (CRP), and had a U-shaped association for creatinine,
                                 sodium, leukocytes, and hemoglobin. Age significantly affected the associations of all studied blood
                                 tests except in leukocytes. In addition, with increasing age categories, case-mix adjusted mortality
                                 increased with the number of abnormal blood tests. In summary, the association between blood
                                 tests and (adjusted) mortality depends on age. Mortality increases gradually or in a U-shaped manner
                                 with increasing blood test values. Age-adjusted numerical scores may improve risk stratification. Our
                                 results have implications for interpretation of blood tests and their use in risk stratification tools and
                                 acute care guidelines.

                                 Trial registration number Netherlands Trial Register (NTR) NL8422, 03/2020.

                                 1
                                  Department of Emergency Medicine, Leiden University Medical Center, Albinusdreef 2, 2300 RC Leiden, The
                                 Netherlands. 2Department of Emergency Medicine, Máxima Medical Center, De Run 4600, 5504 DB Veldhoven,
                                 The Netherlands. 3Department of Emergency Medicine, Admiraal de Ruyter Hospital, ‘s‑Gravenpolderseweg 114,
                                 4462 RA Goes, The Netherlands. 4Department of Emergency Medicine, University Medical Center Groningen,
                                 Hanzeplein1, 9713 GZ Groningen, The Netherlands. 5Department of Emergency Medicine, Radboud University
                                 Medical Center, Houtlaan 4, 6525 XZ Nijmegen, The Netherlands. 6Department of Emergency Medicine,
                                 Medical Center Leeuwarden, Henri Dunantweg 2, 8934 AD Leeuwarden, The Netherlands. 7Department
                                 of Emergency Medicine, Elisabeth-TweeSteden Hospital, Doctor Deelenlaan 5, 5042 AD Tilburg, The
                                 Netherlands. 8Department of Emergency Medicine, Haaglanden Medical Center, Lijnbaan 32, 2512 VA The Hague,
                                 The Netherlands. 9Department of Biostatistics, Leiden University Medical Center, Albinusdreef 2, 2300 RC Leiden,
                                 The Netherlands. 10Department of Intensive Care Medicine, Leiden University Medical Center, Albinusdreef 2,
                                 2300 RC Leiden, The Netherlands. *email: bart.candel@mmc.nl

Scientific Reports |   (2022) 12:1556               | https://doi.org/10.1038/s41598-022-05485-4                                               1

                                                                                                                                          Vol.:(0123456789)
www.nature.com/scientificreports/
In Emergency Department (ED) patients, correct risk stratification is important to early recognize clinical dete-
rioration and to appropriately assign patients to a definitive level of c are1. Many risk stratification tools, such
as SIRS, CURB-65, PIRO, GRACE, Ranson criteria, assign points for abnormal blood test v alues2–8. A previous
study showed, however, that risk stratification tools are ineffective at predicting mortality in older ED p atients9.
This may be caused by a different impact of abnormal blood test values on mortality with increasing age due
to (patho)-physiological changes10,11. For example, older patients normally have higher creatinine levels than
younger patients12. Thus, in younger patients an increase in plasma creatinine reflects a larger decrease in renal
function compared to older patients and may therefore also carry a larger risk.
In addition, due to less physiological reserve, or frailty, with increasing age, an increasing number of abnormal
blood test values may carry a larger risk in older patients.
As a result, using age-adjusted risk scores for blood tests may have the potential to improve risk stratification
and consequently facilitate early recognition of clinical deterioration. This early recognition may potentially
improve outcome of patients with medical conditions who need treatments that are time sensitive.
The aim of the present study is twofold: First, to assess the effect of age on the associations between biomark-
ers of renal function and homeostasis, inflammation and circulation and in-hospital mortality. Secondly, we
investigate the risk of an increasing number of abnormal blood tests per age category.
Methods
Study design and setting. This observational multi-center study was conducted in three EDs in the Neth-
erlands, with each approximately 20,000–30,000 ED visits per year. Consecutive ED visits were registered of one
tertiary care center (1 January 2017–8 June 2019), and two urban hospitals (1 January 2019–12 January 2020 and
1 January 2017–31 December 2019). This study was registered in the Netherlands Trial Register (ID NL8422)
and approved by the medical ethics committee of the Leiden University Medical Center, the Netherlands. All
methods were performed in accordance to the principles outlined in the Declaration of Helsinki.
Selection of participants. All consecutive ED visits of ≥ 18 years were included in this study, if at least one
of the blood tests described below had been registered.
Data collection. Data were collected from the Netherlands Emergency department Evaluation Database
(NEED), the national quality registry for EDs in the Netherlands (www.stichting.need.nl). Correspondent to
other quality registrations, and in accordance with the “General Data Protection Act”, an informed opt-out pro-
cedure was used in the participating hospitals for inclusion in the NEED. Detailed information about the NEED
and collected data are available in an earlier publication13. We selected biomarkers which represent organ (dys-)
function and inflammation because these biomarkers are known to have prognostic or diagnostic value in the
ED, are commonly used in risk scores developed for the ED and are routinely assessed in the ED. For example,
creatinine reflects renal function, which is the first organ to fail in early disease stages such as s epsis2–8. The fol-
lowing routinely measured biomarkers were investigated: creatinine, urea, and sodium (reflecting renal function
and homeostasis), C-reactive protein (CRP) and leukocytes (reflecting inflammation), lactate and hemoglobin
(reflecting circulation). In Supplemental digital content 1, details of the used laboratory assays and equipment
are described.
Outcome measures. In-hospital mortality (including death in the ED) was the primary outcome measure.
Sample size estimation. For objective 1, we aimed to adjust for six potential confounders in the multivari-
able logistic regression analysis. For objective 2, we aimed to adjust for 39 potential confounders as described in
the main statistical analyses section. Approximately five to ten events per variable are needed to prevent overfit-
ting in association studies14. The NEED contained 148,828 ED visits of patients ≥ 18 years of age. We estimated
that in ~ 60% of the ED visits blood tests were performed resulting in ~ 90,000 ED visits which could be used for
the analyses. Estimated in-hospital mortality would be ~ 3% of the overall population. Included patients were
stratified by age, yielding ~ 90,000/4 age categories = 22,500 patients per age category. On average we would have
0.03 × 22,500 = 675 events per group, sufficient to adjust for the 39 potential confounders.
Descriptive analysis. Patient characteristics were summarized per age-category (18–50, 51–65, 66–80, and
> 80 years)12, as mean (SD) for normally distributed data, and median (IQR) for skewed data. Per age category,
the percentage of blood test values outside of the reference range were reported.
Main statistical analyses. For objective 1, our goal was to study how creatinine, sodium, leukocytes, CRP,
and hemoglobin are associated with mortality in emergency care, and how these associations changes with age.
We used the R package m gcv15, to fit a generalized additive logistic regression model (GAM) to the binary out-
come in-hospital mortality. In this model, the log odds of the outcome depends in an arbitrary way on all six
predictors (five blood parameters and age) and all their interactions. Clearly, such a complex model is overpa-
rameterized which could lead to poor, unstable performance if left unaddressed. However, it can be handled as
part of the fitting procedure by using a quadratically penalized likelihood type approach. Effectively, this method
enforces a smooth dependence of the log odds mortality on the six predictors. To visualize the association
between mortality and the six predictors, we generated five graphs which present different views on the same
model. In each of the graphs, we vary one of the predictors together with age, while the other four predictors are
Scientific Reports | (2022) 12:1556 | https://doi.org/10.1038/s41598-022-05485-4 2
Vol:.(1234567890)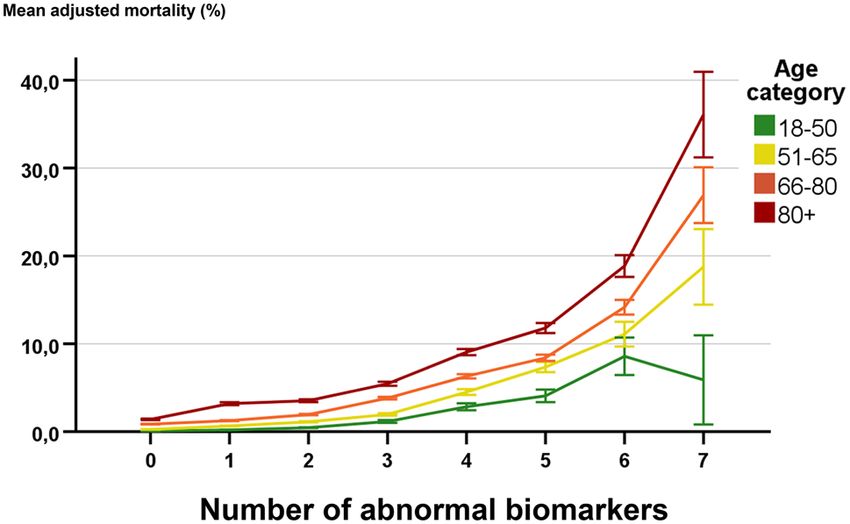
www.nature.com/scientificreports/
left constant at “typical” values. These were chosen as follows: creatinine = 80 µmol/L, leukocytes = 8.0 × 10⁹/L,
CRP = 10 mg/L, Sodium = 140 mmol/L, and hemoglobin = 9 mmol/L.
This analysis was intended to be descriptive and exploratory, and therefore we did not attempt formal statisti-
cal inference in terms of p-values and confidence intervals.
Due to the complexity of the model, we could not add other biomarkers or potential confounders. To assess
whether adjustment for other potential confounders affected our results, a second analysis was performed, in
which we also studied the biomarkers urea and lactate. Multivariable logistic regression analyses were used
with separate models for each biomarker for each age category. We simplified the model by categorizing blood
tests, based on expected distribution and reference intervals (see Supplemental digital content 1). The following
potential confounders were entered in the models through backward stepwise elimination: age, gender, triage
level (non-urgent, urgent, very urgent, most urgent), top ten presenting complaints (Supplemental digital con-
tent 2), systolic blood pressure, heart rate, peripheral oxygen saturation, hospital, high dependency care unit
admission (yes or no), number of consultations in the ED (0, 1, 2 or > 2) and performed radiological tests (0 or
≥ 1). The models for creatinine, urea, CRP, and leukocytes were adjusted for hemoglobin and sodium. The model
for sodium was adjusted for hemoglobin and urea, and the model for hemoglobin was adjusted for sodium and
urea. If variation inflation factors (VIF) were below three, multicollinearity was assumed not to be a problem.
Triage level, high dependency care unit admission and vital signs were used to adjust for disease severity9. Vital
signs were categorized in five or six categories to overcome non-linear associations, including a category ‘not
measured’ to prevent missing data. In the NEED comorbidities were not registered. The number of consultations
in the ED and the number of radiological tests were used as measure of comorbidities/complexity as described
previously16. If variables were missing, the patient was excluded from the analyses. However, the used potential
confounders had almost no missing data in the NEED. After the analyses for each biomarker was performed
in all age categories, the analyses were repeated for the pooled data. An interaction term of age*blood test was
added to study whether age affected the association between the studied biomarker and mortality. We considered
age as an effect modifier if the p-value of the interaction term was < 0.05. Adjusted odds ratio’s (AORs) with 95%
Confidence Intervals (95% CI) and predicted probabilities (mean case-mix adjusted mortality) were reported to
compare relative risk increases with absolute mortality with changing blood test values.
For objective 2, the number of abnormal blood test values, outside of their reference intervals, was calculated
for each age category. The used reference intervals are mentioned in Supplemental digital content 1. We studied
the association between the number of abnormal blood tests and mortality with multivariable logistic regression
using similar potential confounders as described above.
Data were analyzed using SPSS (Version 25.0) and R version 4.0 (packages foreign, dplyr, mgcv).
Results
Patient inclusion and characteristics. Out of the 147,728 ED visits of patients ≥ 18 years, 94,974 patients
were included in whom blood tests were performed (flow diagram in Supplemental digital content 3). Mean
age of included patients was 60.7 (19.0) years. In-hospital mortality per age category was: 153 (0.6%) patients
in age category 18–50 years, 421 (1.8%) patients 51–65 years, 1086 (3.6%) 66–80 years, and 890 (6.3%) patients
> 80 years. Biomarkers were more often abnormal in older patients. For example, sodium was in 9.2% abnormal
in age-category 18–50 years, and in 25.5% in age-category > 80 years (difference 16.3%; 15.5–17.1%). See Table 1
for all patient characteristics and Supplemental digital content 4 for patient disposition and outcomes.
Main results. For objective 1, the associations between biomarkers and mortality are represented in Figs. 1
and 2. Creatinine, sodium, leukocytes, and hemoglobin had U-shaped associations with mortality, while mortal-
ity increased gradually with increasing CRP. In these figures it is also shown that the absolute risk for mortality
increased more in older compared to younger patients with abnormal plasma values.
In the additional analyses, in which we also studied urea and lactate, relative risks (AORs) were presented
(see Table 2). Both biomarkers of renal function (creatinine and urea) had a more marked increase in AORs in
patients 18–50 years with higher plasma concentrations. AORs started to increase below 136–145 mmol/L in
18–50 years and below 126–130 mmol/L in > 80 years. Mortality increased gradually for CRP, with more marked
increase in patients 18–50 years for plasma levels of 51–100 mg/L. Hemoglobin had a U-shaped association
with mortality especially in older patients. A low hemoglobin was associated with higher mortality in younger
compared to older patients. For lactate, mortality increased gradually in all age categories.
Alternatively, we tested whether age affected the association between biomarkers and mortality using an
interaction term. As shown by the significant interaction terms, age significantly affected the associations between
urea (p = 0.03), creatinine (p < 0.01), sodium (p < 0.01), hemoglobin (p < 0.01), CRP (p < 0.01) and lactate (p < 0.01)
and mortality, but not between leukocytes and mortality (p = 0.47). Table 2 shows in which blood test categories
the risk on mortality was affected by age.
Supplemental digital content 5 shows the associations between biomarker categories and mortality in all
four age categories, corrected for potential confounders like disease severity and complexity. The results are
comparable with the main analyses shown in Figs. 1 and 2, with larger absolute increases of mortality in older
patients with abnormal biomarker values.
For objective 2, Fig. 3 shows that the risk for absolute case-mix adjusted mortality had larger increases in
older patients with an increasing number of abnormal blood test values. Older patients more often had abnormal
blood test values (see Supplemental digital content 6).
Scientific Reports | (2022) 12:1556 | https://doi.org/10.1038/s41598-022-05485-4 3
Vol.:(0123456789)www.nature.com/scientificreports/
Total cohort 18–50 years 51–65 years 66–80 years > 80 years
N = 94,974 N = 26,697 N = 23,840 N = 30,257 N = 14,180
(100.0%) (28.1%) (25.1%) (31.9%) (14.9%)
Demographics N, (%)
Age, mean (SD) 60.7 (19.0) 35.5 (9.7) 58.5 (4.3) 72.9 (4.2) 85.7 (3.9)
Sex, female 47,082 (49.6) 14,979 (56.1) 11,013 (46.2) 13,297 (43.9) 7793 (55.0)
Hospital setting N, (%)
Tertiary care centre 28,665 (30.2) 9396 (35.2) 7762 (32.6) 8448 (27.9) 3059 (21.6)
Top-10 presenting complaints N, (%)
Collapse 4001 (4.2) 800 (3.0) 930 (3.9) 1510 (5.0) 761 (5.4)
Extremity problems 5803 (6.1) 1151 (4.3) 1278 (5.4) 1876 (6.2) 1498 (10.6)
Headache 2000 (2.1) 817 (3.1) 511 (2.1) 475 (1.6) 197 (1.4)
Palpitations 3150 (3.3) 554 (2.1) 960 (4.0) 1301 (4.3) 335 (2.4)
Chest pain 11,372 (12.0) 2864 (10.7) 3611 (15.1) 3645 (12.0) 1252 (8.8)
Wounds 1390 (1.5) 430 (1.6) 365 (1.5) 432 (1.4) 163 (1.1)
Feeling unwell 21,268 (22.4) 4095 (15.3) 5417 (22.7) 7801 (25.8) 3955 (27.9)
Abdominal pain 14,745 (15.5) 6875 (25.8) 3643 (15.3) 3197 (10.6) 1030 (7.3)
Dyspnea 12,126 (12.8) 2055 (7.7) 2882 (12.1) 4831 (16.0) 2358 (16.6)
Trauma 2449 (2.6) 859 (3.2) 507 (2.1) 639 (2.1) 444 (3.1)
Miscellaneous 16,670 (17.6) 6197 (23.2) 3736 (15.7) 4550 (15.0) 2187 (15.4)
Proxies for disease Severity N, (%)
Triage level
Blue/green 18,157 (19.1) 5626 (21.4) 4286 (18.3) 5438 (18.2) 2807 (20.1)
Yellow 41,499 (43.7) 12,236 (46.6) 10.354 (44.1) 12,909 (43.3) 6000 (42.9)
Orange 28,436 (29.9) 7291 (27.7) 7367 (31.4) 9504 (31.9) 4274 (30.6)
Red 5449 (5.7) 1128 (4.3) 1472 (6.3) 1971 (6.6) 878 (6.3)
Biomarkers of renal function and homeostasis, Median (IQR), [N]
Creatinine (μmol/L) 77 (63–97) 69 (59–82) 75 (62–91) 83 (67–106) 91 (72–122)
Urea (mmol/L) 5.8 (4.3–7.9) 4.3 (3.4–5.4) 5.5 (4.4–7.0) 6.7 (5.2–9.0) 8.1 (6.2–11.3)
Sodium (mmol/L) 140 (137–142) 140 (138–142) 140 (137–142) 139 (136–141) 139 (136–141)
Biomarkers of inflammation, Median (IQR), [N]
CRP (mg/L) 10.4 (4.2–47) 7.3 (3.8–32) 10.3 (4.0–49) 12.0 (5.2–50) 12.0 (5.2–50)
Leucocytes (× 10 9/L) 9.1 (7.0–12.0) 9.3 (7.2–12.1) 8.9 {6.9–11.9) 9.0 (6.9–12.) 9.2 (7.1–12.2)
Biomarkers of Circulation Median (IQR), [N]
Hemoglobin (mmol/L) 8.4(7.6–9.2) 8.7 (7.9–9.3) 8.6 (7.8–9.3) 8.3 (7.4–9.1) 7.9 (7.1–8.7)
Lactate (mmol/L) 1.6 (1.1–2.3) 1.5 (1.0–2.2) 1.5 (1.1–2.3) 1.6 (1.1–2.4) 1.6 (1.1–2.4)
Proxies for comorbidity and complexity N, (%)
Radiological testa 58,780 (61.9) 13,713 (51.4) 14,503 (60.8) 19,922 (65.8) 10,642 (75.0)
Number of consultations
None 32.791 (34.5) 10,600 (39.8) 8355 (35.0) 9649 (31.9) 4187 (29.5)
1 54.814 (57.7) 14,233 (53.4) 13,723 (57.6) 18,215 (60.2) 8643 (61.0)
2 6293 (6.6) 1596 (6.0) 1491 (6.3) 2046 (6.8) 1160 (8.2)
>2 929 (1.0) 223 (0.8) 221 (0.9) 306 (1.0) 179 (1.3)
Table 1. Patient characteristics in the total cohort and per age category. Blood tests used in risk stratification
and acute care guidelines were selected, reflecting biomarkers of renal function and homeostasis,
inflammation, and circulation. Number of patients in the total cohort was for creatinine (N = 89,784), urea
(N = 88,816), sodium (N = 91,617) and lactate (N = 13,717), leukocytes (N = 91,136), CRP (N = 78,085) and
haemoglobin (N = 92,304). N number, SD standard deviation, GP General Practitioner, IQR interquartile range,
CRP C-Reactive Protein, μmol/L micromole per litre, mmol/L millimole per litre, mg/L milligram per litre.
a
If one or more of the following radiological tests were performed: ultrasound, radiography, and computer-
tomography.
Discussion
The present study has two main findings. First, mortality risk for ED patients deteriorates gradually or in a
U-shaped fashion with most blood tests. Secondly, the association between blood tests and (adjusted) mortality
depends on age, whereas mortality risk is affected most by deviating biomarker levels in younger patients. Age
should therefore be considered as an effect modifier rather than a covariate in future prediction models.
In ED-patients, case-mix adjusted mortality increased gradually with increasing urea, CRP, and lactate values,
and with the number of abnormal blood tests. For creatinine, sodium, leukocytes, and hemoglobin we found
Scientific Reports | (2022) 12:1556 | https://doi.org/10.1038/s41598-022-05485-4 4
Vol:.(1234567890)www.nature.com/scientificreports/
Figure 1. The associations between creatinine (A), sodium (B) and mortality and age are shown using
a generalized additive logistic regression model. This model included five biomarkers and age. The four
biomarkers that are not shown in the panel were left constant at ‘normal’ values. These were chosen as
follows: creatinine = 80 µmol/L, leukocytes = 80 × 10^9/L, CRP = 10 mg/L, Sodium = 140 mmol/L, and
hemoglobin = 9 mmol/L. Mortality is shown as mean predicted mortality risk (between 0 and 1).
U-shaped associations. These findings correspond to previous studies in which blood tests had similar unadjusted
associations with relevant clinical outcomes17,18. Several studies used biomarkers in prediction models for the
ED19–27, with similar associations for mortality. However, to the best of our knowledge, none of these studies
investigated the effect of age on the association between biomarkers and outcome. As we showed, the associations
between blood tests and case-mix adjusted outcomes changed with age, suggesting that age should be considered
as an effect modifier rather than a covariate, possibly because reference intervals of biomarkers change with age.
For example, sodium and hemoglobin levels decline with increasing age in a healthy population28,29, which may
explain our findings that low hemoglobin and low sodium have higher odds on mortality in younger compared
to older patients. For urea and creatinine, the AORs for mortality were highest in younger patients, which is in
accordance with higher reference values for creatinine and urea in older people12. Although younger patients,
compared with older patients, had more marked increases in AORs for mortality with deviating urea, creati-
nine, sodium, CRP, hemoglobin, and lactate, the absolute mortality increase was highest in older patients. This
can be explained by the higher overall risk for mortality in older patients, irrespective of the value of plasma
biomarker levels.
Abnormal biomarkers are more often present in older patients. In addition, case-mix adjusted mortality
had larger absolute increases in older compared to younger patients with an increasing number of abnormal
biomarker values, which has not been studied before. The number of abnormal biomarkers had a gradually
increasing association with mortality as described before30.
Our results imply that risk stratification tools and acute care guidelines for the ED could be improved by
incorporating the absolute risk per age category. For example, in current practice, using a biomarker score based
on abnormal blood test values, both younger and older patients may be considered as low risk with two abnormal
blood tests. However, a mortality risk increase of 100% compared to baseline risk, may result in for example 10%
mortality in older patients (baseline risk 5%) and only 2% mortality in younger patients (baseline risk 1%). As a
result, older patients may be considered as high risk with similar biomarker values while younger patients are at
Scientific Reports | (2022) 12:1556 | https://doi.org/10.1038/s41598-022-05485-4 5
Vol.:(0123456789)www.nature.com/scientificreports/
Figure 2. The associations between leukocytes (A), C-reactive Protein (B), hemoglobin (C) and mortality
and age are shown using a generalized additive logistic regression model. This model included five biomarkers
and age. The four biomarkers that are not shown in the panel were left constant at ‘normal’ values. These were
chosen as follows: creatinine = 80 µmol/L, leukocytes = 8.0 × 10^9/L, CRP = 10 mg/L, Sodium = 140 mmol/L, and
hemoglobin = 9 mmol/L. Mortality is shown as mean predicted mortality risk (between 0 and 1).
low or intermediate risk. By using different risk scores for age categories based on absolute measures of mortality,
risk stratification may be improved which may lead to better recognition of disease severity, better disposition
decisions and consequently lower mortality.
Another finding from our study is that the association between biomarker levels and mortality is gradual
with a linear or U-shaped relation. Consequently, risk stratification can be improved by using numerical scores
rather than a single cut-off for every biomarker2,4–8, as is currently done in the ICU with the Acute Physiology
Scientific Reports | (2022) 12:1556 | https://doi.org/10.1038/s41598-022-05485-4 6
Vol:.(1234567890)www.nature.com/scientificreports/
Total cohort AOR (95% 18–50 years AOR (95% 51–65 years AOR (95% 66–80 years AOR (95%
CI) CI) CI) CI) > 80 years AOR (95% CI) p-value
Biomarkers of renal function and homeostasis
Urea (mmol/L) 0.03
0–5.0a 1.0 1.0 1.0 1.0 1.0
5.1–10.0 1.7 (1.5–2.0) 2.5 (1.5–4.0) 1.7 (1.3–2.3) 1.5 (1.2–1.9) 1.8 (1.2–2.6) 0.18
10.1–15.0 3.1 (2.6–3.7) 5.7 (2.6–12.2) 3.3 (2.2–5.0) 3.0 (2.3–4.0) 2.9 (1.9–4.3) < 0.01
> 15.0 5.3 (4.4–6.3) 15.5 (8.3–29.1) 3.4 (2.3–5.0) 5.0 (3.8–6.5) 5.9 (4.0–8.7) 0.10
Creatinine (µmol/L) 0.01
0–50 1.5 (1.2–1.8) 1.5 (0.7–2.9) 1.5 (1.0–2.1) 1.4 (1.1–1.9) 1.5 (1.0–2.1) 0.35
51–100a 1.0 1.0 1.0 1.0 1.0
101–150 1.5 (1.3–1.6) 2.9 (1.7–4.8) 1.9 (1.4–2.6) 1.4 (1.2–1.6) 1.3 (1.1–1.6) < 0.01
> 150 2.6 (2.3–2.9) 5.2 (3.1–8.9) 2.3 (1.7–3.2) 2.4 (2.0–2.8) 2.7 (2.2–3.3) 0.02
Sodium (mmol/L) < 0.01
> 145 2.2 (1.8–2.8) 2.0 (0.9–4.4) 2.1 (1.2–3.7) 1.9 (1.3–2.8) 2.6 (1.8–3.8) 0.96
136–145a 1.00 1.0 1.0 1.0 1.0
131–135 1.4 (1.3–1.6) 2.7 (1.6–4.5) 1.9 (1.5–2.6) 1.5 (1.2–1.8) 1.0 (0.8–1.2) < 0.01
125–130 1.7 (1.4–2.1) 2.5 (1.1–6.0) 2.1 (1.4–3.3) 2.0 (1.5–2.6) 1.2 (0.8–1.7) 0.02
< 125 2.8 (2.2–3.7) 6.7 (2.6–17.2) 4.4 (2.5–7.6) 2.6 (1.7–4.0) 2.0 (1.2–3.3) 0.01
Biomarkers of inflammation
Leucocytes (× 109/L) 0.47
0–4.0 2.4 (2.0–3.0) 3.8 (2.7–8.6) 1.7 (1.1–2.8) 2.3 (1.7–3.1) 2.8 (1.8–4.4)
4.1–8.0a 1.0 1.0 1.0 1.0 1.0
8.1–12.0 1.3 (1.2–1.5) 1.3 (0.8–2.4) 1.2 (0.9–1.7) 1.3 (1.1–1.6) 1.4 (1.1–1.8)
12.1–16.0 1.7 (1.5–2.0) 2.2 (1.2–4.1) 1.7 (1.2–2.4) 1.7 (1.4–2.1) 1.8 (1.4–2.2)
16.1–20.0 2.2 (1.8–2.6) 2.1 (1.0–4.4) 2.6 (1.7–3.8) 2.0 (1.5–2.6) 2.2 (1.6–2.9)
> 20.0 2.7 (2.3–3.2) 4.9 (2.5–9.8) 2.1 (1.4–3.2) 2.5 (2.0–3.2) 3.0 (2.2–4.1)
CRP (mg/L) < 0.01
0–50a 1.0 1.0 1.0 1.0 1.0
51–100 1.5 (1.3–1.7) 2.4 (1.3–4.3) 2.0 (1.4–2.8) 1.7 (1.4–2.1) 0.9 (0.7–1.2) < 0.01
101–150 1.9 (1.6–2.3) 1.8 (0.8–4.0) 1.8 (1.2–2.7) 2.2 (1.7–2.8) 1.7 (1.3–2.3) 0.77
> 150 2.4 (2.1–2.7) 2.4 (1.3–4.4) 2.9 (2.2–4.0) 2.4 (2.0–2.9) 2.1 (1.7–2.7) 0.21
Biomarkers of circulation
Hemoglobin (mmol/L) < 0.01
> 9.0a 1.0 1.0 1.0 1.0 1.0
7.1–9.0 1.1 (1.0–1.2) 1.0 (0.6–1.5) 1.4 (1.0–1.9) 1.2 (1.0–1.4) 0.8 (0.7–1.0) 0.18
6.1–7.0 1.5 (1.3–1.7) 2.2 (1.1–4.1) 2.1 (1.4–3.0) 1.4 (1.1–1.8) 1.2 (0.9–1.5) < 0.01
< 6.0 1.7 (1.4–2.0) 2.8 (1.5–5.4) 2.2 (1.5–3.3) 1.8 (1.4–2.4) 1.1 (0.8–1.5) < 0.01
Lactate (mmol/L)
0–2.0a 1.0 1.0 1.0 1.0 1.0 < 0.01
2.1–4.0 1.7 (1.4–2.1) 3.4 (1.2–9.6) 2.3 (1.3–4.1) 1.5 (1.1–2.2) 1.7 (1.2–2.5) 0.31
4.1–6.0 3.3 (2.4–4.5) 8.0 (2.0–32.3) 4.2 (1.8–9.7) 2.4 (1.4–3.9) 4.1 (2.4–7.1) 0.44
> 6.0 10.2 (7.6–13.4) 30.7 (11.0–85.6) 14.7 (7.4–28.9) 8.5 (5.4–13.5) 8.7 (4.7–15.9) < 0.01
Table 2. Adjusted odds ratios with 95% confidence intervals for the association of categorized urea, creatinine,
sodium, leukocytes, C-Reactive Protein, hemoglobin and lactate and in-hospital mortality in age-categories.
The following potential confounders were entered in the model through backward stepwise regression: age,
gender, triage category (green/blue, yellow, orange, red), top ten presenting complaints, hospital, systolic
blood pressure, heart rate, peripheral oxygen saturation, high dependency care unit admission, number of
consultations in the ED (0, 1, 2 or > 2), performed radiological tests and blood tests. Number of patients in the
total cohort was for creatinine (N = 89,784), urea (N = 88,816), sodium (N = 91,617) and lactate (N = 13,717),
leukocytes (N = 91,136), CRP (N = 78,085) and hemoglobin (N = 92,304). AOR Adjusted Odds Ratio, 95
CI 95% confidence interval, CRP C-reactive Protein. The p-value is presented from the interaction term of
age*biomarker which was added in the analyses. Values in bold are statistically significant. a Used as reference
category in the multivariable logistic regression analyses.
And Chronic Health Evaluation (APACHE) models, in which more points are assigned if blood tests deviate
more from the reference range31. Although a single cut-off for each biomarker is commonly used in current risk
Scientific Reports | (2022) 12:1556 | https://doi.org/10.1038/s41598-022-05485-4 7
Vol.:(0123456789)www.nature.com/scientificreports/
Figure 3. The association between the number of abnormal biomarkers (outside of the commonly used
reference ranges) and mortality in different age categories. Mortality is shown as mean predicted mortality risk
in percent (between 0 and 100%).
stratification tools, such as the CURB-65 or the S IRS2,4–8, our findings suggest not to use a single cut-off for any
blood test.
Although this study has its strengths, like the large sample size in multiple EDs, there are also limitations.
First, the NEED lacks information about comorbidities. Instead, we had to use proxies known to be associated
with comorbidities and complexity to overcome this16. Second, inherent to retrospective studies, our study could
have been subjected to documentation errors, although this was largely minimized by automatization. Finally, we
had no follow-up data, so we had to assume that discharged patients did not experience the composite outcome.
In summary, the prognostic value of blood tests changes with age and mortality risk deteriorates gradually
or in a U-shaped fashion with most blood tests for ED patients. Mortality risk is affected mostly by deviating
biomarker levels in younger patients. However, due to higher baseline risk in older patients, small changes in bio-
marker values lead to high mortality. Furthermore, age affected the association between the number of abnormal
blood test values and mortality. Our results have implications for interpretation of biomarkers and their use in
existing risk stratification tools and guidelines in the ED. Future studies should develop risk stratification tools
for ED patients using age-adjusted numerical scores based on absolute risks.
Received: 22 September 2021; Accepted: 12 January 2022
References
1. de Groot, B., de Deckere, E. R., Flameling, R., Sandel, M. H. & Vis, A. Performance of illness severity scores to guide disposition
of emergency department patients with severe sepsis or septic shock. Eur. J. Emerg. Med. 19(5), 316–322 (2012).
2. Lemeshow, S. et al. Mortality Probability Models (MPM II) based on an international cohort of intensive care unit patients. JAMA
270(20), 2478–2486 (1993).
3. Howell, M. D. et al. Proof of principle: The predisposition, infection, response, organ failure sepsis staging system. Crit. Care Med.
39(2), 322–327 (2011).
4. Bone, R. C. Immunologic dissonance: A continuing evolution in our understanding of the systemic inflammatory response syn-
drome (SIRS) and the multiple organ dysfunction syndrome (MODS). Ann. Intern. Med. 125(8), 680–687 (1996).
5. Metlay, J. P. et al. Diagnosis and treatment of adults with community-acquired pneumonia. An official clinical practice guideline of
the American Thoracic Society and Infectious Diseases Society of America. Am. J. Respir. Crit. Care Med. 200(7), e45–e67 (2019).
6. Hall, M. et al. Guideline-indicated treatments and diagnostics, GRACE risk score, and survival for non-ST elevation myocardial
infarction. Eur. Heart J. 39(42), 3798–3806 (2018).
7. Leppäniemi, A. et al. 2019 WSES guidelines for the management of severe acute pancreatitis. World J. Emerg. Surg. 14(1), 27 (2019).
8. Rhodes, A. et al. Surviving sepsis campaign: International guidelines for management of sepsis and septic shock: 2016. Intensive
Care Med. 43(3), 304–377 (2017).
9. de Groot, B. et al. The most commonly used disease severity scores are inappropriate for risk stratification of older emergency
department sepsis patients: An observational multi-centre study. Scand. J. Trauma Resusc. Emerg. Med. 25(1), 91 (2017).
10. van Bemmel, T. et al. Prospective study of the effect of blood pressure on renal function in old age: the Leiden 85-Plus Study. J.
Am. Soc. Nephrol. 17(9), 2561–2566 (2006).
11. Epstein, M. Aging and the kidney. J. Am. Soc. Nephrol. 7(8), 1106 (1996).
12. den Elzen, W. P. et al. NUMBER: standardized reference intervals in the Netherlands using a ‘big data’approach. Clin. Chem. Lab.
Med. (CCLM). 57(1), 42–56 (2018).
13. Candel, B. G. et al. The association between vital signs and clinical outcomes in emergency department patients of different age
categories. Emerg. Med. J.. https://doi.org/10.1136/emermed-2020-210628 (2022).
14. Vittinghoff, E. & McCulloch, C. E. Relaxing the rule of ten events per variable in logistic and Cox regression. Am. J. Epidemiol.
165(6), 710–718 (2007).
15. Wood, S. N. Generalized Additive Models: An Introduction with R (CRC Press, 2017).
16. van der Veen, D., Heringhaus, C. & de Groot, B. Appropriateness, reasons and independent predictors of consultations in the
Emergency Department (ED) of a Dutch Tertiary Care Center: A prospective cohort study. PLoS ONE 11(2), e0149079 (2016).
17. Mohammed, M. A. et al. Which is more useful in predicting hospital mortality-dichotomised blood test results or actual test values?
A retrospective study in two hospitals. PLoS ONE 7(10), e46860 (2012).
Scientific Reports | (2022) 12:1556 | https://doi.org/10.1038/s41598-022-05485-4 8
Vol:.(1234567890)www.nature.com/scientificreports/
18. Pedersen, P. B., Henriksen, D. P., Brabrand, M. & Lassen, A. T. Level of vital and laboratory values on arrival, and increased risk of
7-day mortality among adult patients in the emergency department: A population-based cohort study. BMJ Open 10(11), e038516
(2020).
19. Asadollahi, K., Hastings, I. M., Gill, G. V. & Beeching, N. J. Prediction of hospital mortality from admission laboratory data and
patient age: A simple model. Emerg. Med. Aust. 23(3), 354–363 (2011).
20. Froom, P. & Shimoni, Z. Prediction of hospital mortality rates by admission laboratory tests. Clin. Chem. 52(2), 325–328 (2006).
21. Tabak, Y. P., Sun, X., Nunez, C. M. & Johannes, R. S. Using electronic health record data to develop inpatient mortality predictive
model: Acute Laboratory Risk of Mortality Score (ALaRMS). J. Am. Med. Inform. Assoc. 21(3), 455–463 (2014).
22. Kristensen, M. et al. Routine blood tests are associated with short term mortality and can improve emergency department triage:
A cohort study of > 12,000 patients. Scand. J. Trauma Resusc. Emerg. Med. 25(1), 115 (2017).
23. Prytherch, D. et al. The use of routine laboratory data to predict in-hospital death in medical admissions. Resuscitation 66(2),
203–207 (2005).
24. Redfern, O. C. et al. Predicting in-hospital mortality and unanticipated admissions to the intensive care unit using routinely col-
lected blood tests and vital signs: Development and validation of a multivariable model. Resuscitation 133, 75–81 (2018).
25. Jarvis, S. W. et al. Development and validation of a decision tree early warning score based on routine laboratory test results for
the discrimination of hospital mortality in emergency medical admissions. Resuscitation 84(11), 1494–1499 (2013).
26. Brabrand, M., Knudsen, T., Hallas, J. Identifying admitted patients at risk of dying: A prospective observational validation of four
biochemical scoring systems. BMJ Open. 3(6) (2013).
27. Silke, B., Kellett, J., Rooney, T., Bennett, K. & O’riordan, D. An improved medical admissions risk system using multivariable
fractional polynomial logistic regression modelling. QJM Int. J. Med. 103(1), 23–32 (2010).
28. Lindner, G., Pfortmüller, C. A., Leichtle, A. B., Fiedler, G. M. & Exadaktylos, A. K. Age-related variety in electrolyte levels and
prevalence of dysnatremias and dyskalemias in patients presenting to the emergency department. Gerontology 60(5), 420–423
(2014).
29. Nilsson-Ehle, H., Jagenburg, R., Landahl, S. & Svanborg, A. Blood haemoglobin declines in the elderly: Implications for reference
intervals fromage 70 to 88. Eur. J. Haematol. 65(5), 297–305 (2000).
30. Roenhoej, R. et al. Abnormal routine blood tests as predictors of mortality in acutely admitted patients. Clin. Biochem. 77, 14–19
(2020).
31. Knaus, W. A., Draper, E. A., Wagner, D. P. & Zimmerman, J. E. APACHE II: A severity of disease classification system. Crit. Care
Med. 13(10), 818–829 (1985).
Acknowledgements
We thank Jeanne Dieleman, epidemiologist at Máxima MC, and Marta Regis, statistician at Máxima MC, for
their help with the analyses.
Author contributions
B.D.G. devised and designed the study, collected data, contributed to the analyses, and edited the manuscript.
B.C., J.K. analyzed data and wrote the manuscript. M.G., E.T.A., O.S., H.L., R.H. and R.R. are co-founders of the
NEED, collected data and edited the manuscript. E.V.Z. contributed to the statistical analyses, wrote the method,
and edited the manuscript. E.D.J. edited the manuscript. B.D.G. takes full responsibility for the study. All authors
have read and approved the manuscript.
Funding
BC, BdG received financial funding from the Dutch Emergency Medicine Research Fund (SGO-fonds, award
number NA). The other authors declared no external funding was received for this study.
Competing interests
The authors declare no competing interests.
Additional information
Supplementary Information The online version contains supplementary material available at https://doi.org/
10.1038/s41598-022-05485-4.
Correspondence and requests for materials should be addressed to B.G.J.C.
Reprints and permissions information is available at www.nature.com/reprints.
Publisher’s note Springer Nature remains neutral with regard to jurisdictional claims in published maps and
institutional affiliations.
Open Access This article is licensed under a Creative Commons Attribution 4.0 International
License, which permits use, sharing, adaptation, distribution and reproduction in any medium or
format, as long as you give appropriate credit to the original author(s) and the source, provide a link to the
Creative Commons licence, and indicate if changes were made. The images or other third party material in this
article are included in the article’s Creative Commons licence, unless indicated otherwise in a credit line to the
material. If material is not included in the article’s Creative Commons licence and your intended use is not
permitted by statutory regulation or exceeds the permitted use, you will need to obtain permission directly from
the copyright holder. To view a copy of this licence, visit http://creativecommons.org/licenses/by/4.0/.
© The Author(s) 2022
Scientific Reports | (2022) 12:1556 | https://doi.org/10.1038/s41598-022-05485-4 9
Vol.:(0123456789)You can also read