AGRICULTURE MONTHLY OVERVIEW JUNE 2021
←
→
Page content transcription
If your browser does not render page correctly, please read the page content below
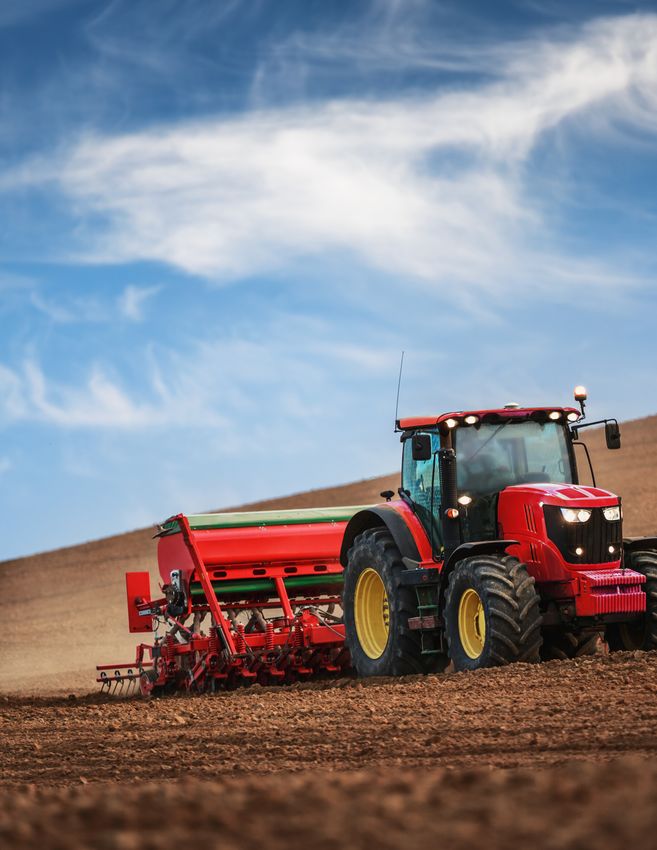
AGRICULTURE
MONTHLY
OVERVIEW
JUNE 2021
Welcome to the Agriculture Monthly
Overview, your comprehensive monthly
resource to depict how weather forecast
patterns and risk data will impact the
growth, production, supply, and
transportation within the food supply
chain.

Get in Front of What’s Ahead.
For more information,
visit Everstream.ai.

2 / JUNE 2021 /
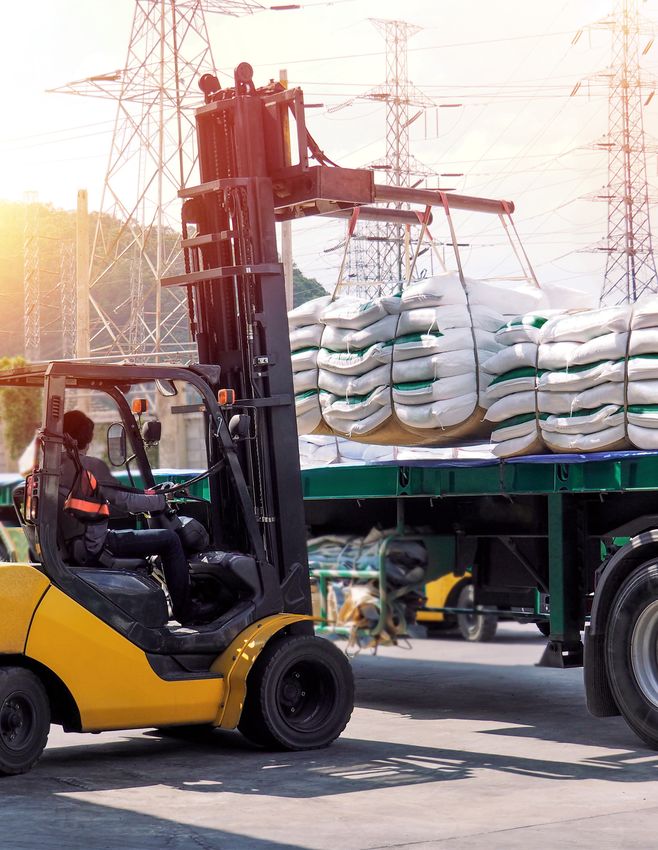
TABLE OF CONTENTS

               HE AGRICULTURE MONTHLY OVERVIEW (AMO)04
           1. T

           2. SPECIAL GUEST COMMENTARY                              08

           3. TOP 5 WATCH LIST                                       10

           4. THE MONTHLY DIVE                                       15

           5. THE AMO GOAL                                           18

   EDITORIAL BOARD            PROJECT LEAD   MARKETING & DESIGN
   Jon Davis                  Jon Davis      Dana Sadiq
   Mark Russo                 Mark Russo     Paul Olson
   Eli Turasky
   Eric Adamchick
   Logan Bundy
   Kenneth Scott Zuckerberg

                                             / AGRICULTURE MONTHLY OVERVIEW / 3
THE AGRICULTURE MONTHLY
OVERVIEW (AMO)
The summer solstice (first day of summer in the           The top of the problem list is the central U.S. and
Northern Hemisphere) occurs on, or near, June 21,         south-central Canada which is one of the most
and this begins the critical development period           concentrated growing areas on a global basis
for summer crops in the key agriculture growing           for corn, soybeans, spring wheat, oats, and small
areas in North America (U.S., Canada, and Mexico),        grains. Other areas that are less than ideal include
Europe, the Black Sea Region, China, and India.           southeast Europe and India. As many of these
July and August will be the months that determine         areas are on the brink of major drought and heat
the level of production (yields) in the world’s largest   stress issues, the months ahead will be critical for
row crop producing areas. The bulk of the globe’s         farmers, the nations that produce the crops, and
food supply is grown in these zones and the               the global population.
weather during the next few months will determine         With agricultural prices at historically elevated
the amount of product (food) that is available to         levels, the next few months will arguably be the
the world.                                                most sensitive period in decades on a global basis.
The situation going into this critical summer period      The graph in Figure 1 tells the story. The Goldman
is unique to say the least. Global food prices            Sachs Agricultural Commodity Index continues to
are elevated due to tight stocks and prodigious           be at exceptionally elevated levels when compared
buying of agricultural products (as well as most          to the past 5 years. The last time food prices have
commodities) by China during the past 6-9 months.         had such a dramatic increase and been this elevated
As a result, “big crops” are needed in the core           was 2012. The dramatic increase in agricultural
growing areas to keep up with global demand.              commodities, along with a similar trend of nearly
As we head toward the yield-sensitive periods             all other commodities (metals, energy, etc.), has
in July and August, there are increasing weather          increased discussions and concern around inflation.
problems in key growing areas that are threatening        This index, which is a benchmark of performance
crop growth and yield-potential. This is threatening      of the agricultural commodity markets, will likely
the “big crop” scenario which is needed to maintain       continue to be extremely volatile and react to
comfortable food supplies with some areas on the          supply (weather issues for example) and demand
verge of serious problems.                                issues during the next few months.

4 / JUNE 2021 /
/ AGRICULTURE MONTHLY OVERVIEW / 5

6 / JUNE 2021 /

This month’s special guest is Kenneth Scott              or at highest risk of becoming the next big issue.
Zuckerberg, Lead Analyst and Sector Strategist           Finally, the Monthly Dive will take an in-depth look
                                                         at the history and prospects for the fire season in
responsible for grains, farm supply, and ethanol
                                                         the western portion of the U.S.
sectors at CoBank. Ken is based in metro New
                                                         The purpose of this report is to give a general
York. His breadth and depth of knowledge in the          synopsis of agriculture at a high level. Unlike our daily
agriculture business is unmatched. We are honored        Agriculture Digest, this report is meant to provide a
to have Ken as our guest commentator. Our Top 5          broad overview of important and interesting things
Watch List will provide a quick guide to the items       going on around the world in agriculture, food, and
that we believe are most interesting, important and/     all the sectors that are interwoven within the “food
                                                         supply chain web.”

                    Figure 1: Goldman Sachs Commodity Index from June 2016 - June 2021;
                    Source: GSCI
                                                                     / AGRICULTURE MONTHLY OVERVIEW / 7
SPECIAL GUEST COMMENTARY

It’s Raining Volatility & Inflation                         amidst positive U.S. crop progress reports (in early
Last month we signaled the possibility that higher          June), coupled with the possibility of rain and
volatility in grain prices was likely as U.S. agriculture   higher planted corn acres.
entered the “weather really matters” period of the          Interestingly, the charts we follow were signalling
crop-growing season. Well, the market got that              this risk ahead of time. As shown below, corn prices
and even more, and summer has only just begun!              during the current grain run—illustrated by the
We expect additional price volatility ahead as              yellow line—had been closely tracking the 2007-
current weather and grain traders are debating              2008 grain run, but had begun to signal a peak in
precipitation forecasts (incorporating short-term           prices.
rain but long-term-drought). And by the way,
inflation expectations and debates about whether
the rise in food, home, energy, used car and other
prices are “real” or simply “transitory.”
To review events over the past month, several
factors had been driving corn, soybean and wheat
prices to reach record levels during May. These
factors included: a) massive corn purchases by
China (10.7 million metric tons of new crop);
b) significant drought conditions and elevated
temperatures in several key production regions in
the USA, Canada, Mexico, Brazil and elsewhere;
and c) continued “long” bets on agriculture and
other commodities as a hedge against inflation.
                                                                 Kenneth Scott Zuckerberg, Lead Analyst and
Prices began pulling back after Memorial Day                             Sector Strategist at CoBank

8 / JUNE 2021 /
Grain Price Run Comparison
Figure 2: Comparison of corn prices between Jan 2007-2009 and Jan 2020-May
2021; Source: Barchart.com
Then June 17, 2021 happened. Grain prices fell Looking forward, grain price movements will be
sharply—to the tune of -5.9% for Corn, -8.2% under the influence of weather, exports to China,
for Soybeans and -3.6% for Wheat—as hawkish logistical bottlenecks, and inflation expectations.
comments by the Federal Reserve to stem inflation Expect choppiness ahead.
in 2023 (rather than in 2024) drove a significant
unwinding of inflation hedge bets ahead of options
expiration day.
/ AGRICULTURE MONTHLY OVERVIEW / 9TOP 5 WATCH LIST
Our Top 5 Watch List includes the latest items that 1. Northern Plains/Midwest/Canadian
are pertinent to monitor or have the highest risk Prairies Drought
to impact agriculture and inevitably, the agriculture
2. Western U.S. Drought
global supply chain. Hence, these are the top items
or areas that need to be monitored which could 3. Indian Monsoon
lead to impacts in the agriculture supply chain (crop 4. Europe/Russia Dryness
losses via heat/drought/wetness, logistic issues,
5. Pacific SSTs
and miscellaneous issues).
1 Northern Plains/Midwest/Canadian normal temperatures, spring wheat and small grain
Prairies Drought conditions will stay the same or even decline.
Other than spring wheat, concern is beginning to
The newfound and expanding dryness across much
grow for corn and soybeans. As discussed above,
of the Northern Plains/Midwest/Canadian Prairies
the northern/western portion of the Midwest has
has taken the top spot as our number 1 item of
seen a large expansion of drought in the last month
concern worldwide. Specifically, drought has
or so. We expect this to remain an issue for the
expanded/worsened across states like Montana,
aforementioned areas, but the southern/eastern
North/South Dakota, Minnesota, and Iowa, as well
Midwest should remain relatively drought free. As
as the Canadian provinces of Alberta, Saskatchewan,
we quickly approach the critical corn pollination
and Manitoba. The drought and springtime heat
window in July, heat and rainfall prospects across
has produced the worst crop conditions in spring
these areas will be even more scrutinized.
wheat in the last 20 years, with the percentage
of USDA rated “Excellent and Good” conditions
at a paltry 27% (50% below normal). Other small 2 Western U.S. Drought
grains and crops grown within the zone are also in
poor condition. With little in the way of drought The western U.S. drought remains near the top of
improvement expected, as well as well above our Watch List. There have been no major changes
10 / JUNE 2021 /in the drought during the last month, with the worst to their proximity to the equator; monsoon rains not
conditions still focused across the Desert Southwest only bring moisture but also cool the atmosphere
and Intermountain West. This drought has helped to non-stressful levels. With that said, there are
in breeding extreme heat across the West during indications for better rain opportunities during the
June and will continue to aid in heat development mid-to-latter portion of July as conditions once
going into July. Water resources across much of again become more favorable. However, close
the West are being severely stressed which has watching is warranted as any delay or backing
ramifications for agriculture, industry, livestock away from these projections would quickly escalate
and the people that live there. Furthermore, the bigger agriculture concerns in India.
extreme drought and heat is setting the table for
another active wildfire season. We take a closer
look at the western U.S. wildfire risk in this month’s
4 Europe/Russia Dryness
Monthly Dive section. Similar to last month’s Watch List, we continue to
monitor the dryness across Europe/Russia. The
3 Indian Monsoon core of the dryness has shifted more into southeast
Europe, with the Black Sea Region and western
Our prediction of an erratic start to the Indian Europe on the wetter side. Across Russia, conditions
monsoon has certainly panned out. After producing have been more variable, but the spring wheat
near normal rains during the first half of June, the acreage in Siberia continues to be one of the drier
monsoon has turned more inconsistent and will spots. On top of the dryness, central and eastern
stay that way through at least early July. During Europe, as well as Russia have been the continued
this down period, precipitation deficits will quickly focus of heat. These areas are expected to remain
build and could become a major concern for newly warmer than normal through the first half of July, at
seeded and emerged crops if the monsoon does least. As such, the heat and dryness combination
not reinvigorate by mid-July. The other factor is will need to be monitored as soil moisture depletes
temperatures. When it is not raining during the and crop stress is introduced.
summer months in India, it turns extremely hot due
/ AGRICULTURE MONTHLY OVERVIEW / 1112 / JUNE 2021 /
5     Pacific SSTs
Trends in sea surface temperature (SST) across the equatorial and north Pacific remain on our Watch List.
A lingering cool bias of waters in the equatorial regions (neutral to weak La Niña conditions) along with
the cooler than normal SSTs off the West Coast of the U.S. and Canada (a negative PDO – Pacific Decadal
Oscillation – signature) remain in place. These specific SST patterns will combine with the historic dryness
to elevate the odds of increased crop stress across the western and north central U.S. along with western
Canada as we head into July.

Figure 3: Top 5 Watch List Areas Highlighted on Map from Nextgen: Source: Everstream Analytics

                                                                        / AGRICULTURE MONTHLY OVERVIEW / 13
14 / JUNE 2021 /
THE MONTHLY DIVE
We are heating up this month’s Monthly Dive with             significant threat to these livestock areas.
a discussion on the heightened wildfire risk this            While the West is climatologically a vulnerable
season across the western U.S. This discussion,              location for wildfires, the more noteworthy fact
the variables that are driving it, and the potential         is that the number of acres burned has trended
outcomes this season are daunting. From an                   higher over time. What made last year’s (2020)
agricultural standpoint, specialty crops including           U.S. wildfire season so severe was the number of
fruits, nuts, and produce account for the bulk of            acres burned per fire, which was over 160 acres per
food production in the West while traditional row            fire and the highest of any year since 2000. The
crops make up a minority of production but include           charts in the below figures illustrate these trends
key crops such as cotton (CA/AZ) and wheat (WA/              in increased wildfire disaster costs and number of
ID). Additionally, livestock ranching and dairy are          acres burned per fire.
key agriculture practices, thus, making wildfires a

Figure 4: Annual wildfire disaster cost (CPI-Adjusted) and   Figure 5: Annual average of number of acres burned per
trend line for the Lower 48; Source: NOAA/NCEI               wildfire for the Lower 48; Source: NOAA/NCEI

                                                                       / AGRICULTURE MONTHLY OVERVIEW / 15
Figure 6: Trend of damage costs by wildfires from 1980-2020 (increasing trend value in millions USD per
year); Source: NOAA/NCEI
Spatially, wildfire disaster costs have trended higher over time with the steepest trends in California,
Oregon, and Colorado. This can be seen in the figure above of wildfire damage cost trends by state
from 1980-2020. Not surprisingly, California is not only the state with the strongest increasing trend but
is nearly 14 times higher than Oregon’s trend (second highest) due to California having the largest GDP
of any state in the U.S.. The bottom line is the risk of being impacted by wildfires and experiencing loss is
higher now compared to 10 or 20 years ago.
This year, with the highest percent of drought across the lower 48 of any year since 2000 and severe drought
conditions plaguing much of California, the Desert Southwest, Rockies, and Northern Plains, vegetation
is extremely dry and vulnerable for wildfire ignition. Additionally, temperature anomalies over the last
16 / JUNE 2021 /couple of months have been well above normal in the Western U.S., with many states experiencing their
top-10 warmest April-May period on record. Furthermore, June has seen many all-time high temperature
records tied or broken in the West. Couple together dry and hot conditions and this is setting the table
for a serious threat for wildfires going forward into the peak months of July, August, and September. As
a result, close monitoring of wildfire ignition and spread in relation to key agriculture/livestock belts and
supply chain nodes will be needed on a day-to-day and week-to-week basis as we progress through the
heart of the season.
Figure 7: Everstream Analytics NextGen Platform - Global Agriculture
/ AGRICULTURE MONTHLY OVERVIEW / 17THE AMO GOAL The AMO is designed to provide an overview of important items in global agriculture. The core of agriculture (what we produce, what we do with what we produce, how we transport it, and how we and animals consume it) is always important. The current dynamics are unique (commodity price spike, recent extreme weather events and elevated risk in the future) and make the remainder of this year even more critically important to individuals and companies that have an interest in crops, food and the steps in getting food from farm to table. This report will be issued monthly and highlight items that are driving the agricultural global supply chain in this dynamic year. For more information, visit our website at www.everstream.ai. 18 / JUNE 2021 /
/ AGRICULTURE MONTHLY OVERVIEW / 19
THINK BIGGER | SEE FURTHER | ACT SOONER
WITH PREDICTIVE SUPPLY CHAIN RISK ANALYTICS
Actionable insights to enable greater resilience and agility

About Everstream Analytics
Everstream Analytics is a supply chain risk analytics company that delivers actionable insights to
increase the resilience and agility of our clients’ supply chains, protecting revenue and reputation.
Our solution integrates with our clients’ Procurement, Logistics and Business Continuity platforms
to deliver global, end-to-end visibility to supply chain risk to enable our clients to Think Bigger.
We employ a unique combination of human expertise, artificial intelligence and proprietary data to
deliver predictive insights to enable our clients to See Further. We combine data science, proprietary
intelligence and multilingual specialists to monitor global risk and events in real-time to enable our
clients to Act Sooner. We embed risk analytics into decision making during planning and execution
across all functions and phases of our clients’ supply chains to help them Get in Front of What’s
Ahead and turn risk into a competitive advantage.

GET IN TOUCH

Website                             Email                                  Phone
www.everstream.ai                   info@everstream.ai                     +1 (800) 261 7947

Get in Front of What’s Ahead. For more information, visit Everstream.ai.
You can also read