DXB Entertainments PJSC - Q2 2017 Earnings Release Presentation 9August| 2017
←
→
Page content transcription
If your browser does not render page correctly, please read the page content below

DXB Entertainments PJSC
Q2 2017 Earnings Release Presentation
9 August | 2017

Disclaimer
PRESENTATION AND ITS CONTENTS ARE NOT FOR RELEASE, PUBLICATION OR DISTRIBUTION, IN WHOLE OR IN PART, DIRECTLY OR INDIRECTLY IN OR INTO ANY JURISDICTION
WHERE SUCH DISTRIBUTION IS UNLAWFUL.

This presentation has been prepared and issued by DXB Entertainments PJSC (the “Company”). For the purposes of this notice, “presentation” means this document, its
contents or any part of it, any oral presentation, any question or answer session and any written or oral material discussed or distributed during the presentation meeting.

The information set out in this presentation may be subject to updating, revision, verification and amendment and such information may change materially. Neither the
Company, any of its parent or subsidiary undertakings, the subsidiary undertakings of such parent undertakings, nor any of such person’s respective directors, officers,
employees, agents, affiliates or advisers is under an obligation to update or keep current the information contained in this presentation to which it relates or to provide the
recipient of with access to any additional information that may arise in connection with it and any opinions expressed in this presentation are subject to change without
notice. None of the Company or any of its parent or subsidiary undertakings, or the subsidiary undertakings of such parent undertakings, and any of such person’s respective
directors, officers, employees, agents, affiliates or advisers shall have any liability whatsoever (in negligence or otherwise) for any loss whatsoever arising from any use of
this presentation, or otherwise arising in connection with this presentation.

This presentation is an advertisement for the purposes of the United Kingdom Prospectus Rules and the information contained herein are not an offer of securities for sale in
the United States nor any other jurisdiction. This presentation does not constitute or form part of, and should not be construed as, any offer, invitation, solicitation or
recommendation to purchase, sell or subscribe for any securities in any jurisdiction nor should it or any part of it form the basis of, or be relied on in connection with, any
contract or commitment whatsoever.

This presentation is for information purposes and convenient reference. It is not definitive advice, nor should it be relied upon as such. This presentation does not purport to
contain all of the information that may be required to evaluate any potential transaction and should not be relied on in connection with any such potential transaction. Any
projection, estimate, forecast or other ‘forward-looking’ statement in this presentation only illustrates hypothetical performance under specified assumptions of events or
conditions, and is not a reliable indicator of future performance.

To the extent available, the industry and market data contained in this presentation may have come from official or third party sources. Such third party industry
publications, studies and surveys generally state that the data contained therein have been obtained from sources believed to be reliable, but that there is no guarantee of
the accuracy or completeness of such data. While the Company believes that each of these publications, studies and surveys has been prepared by a reputable source, the
Company has not independently verified the data contained therein. In addition, certain of the industry and market data contained in this presentation come from the
Company's own internal research and estimates based on the knowledge and experience of the Company's management in the market in which the Company operates.
While the Company generally believes that such research and estimates are reasonable and reliable, they, and their underlying methodology and assumptions, have not
been verified by any independent source for accuracy or completeness and are subject to change without notice. Accordingly, undue reliance should not be placed on any of
the industry or market data contained in this presentation.
 You agree to be bound by the foregoing limitations and conditions and, in particular, will be deemed to have represented, warranted and undertaken that you have read
and agree to comply with the contents of this notice.

LEGO ®, the LEGO logo and LEGOLAND ® are trademarks of the LEGO Group. ©2016 The LEGO Group. LEGOLAND IS A PART OF MERLIN ENTERTAINMENTS plc.

                                                                                                                                                                               2
Highlights of Q1 2017
Contents
                                             Financial Results
Organisational Restructure
                             Corporate and Operational Update
Highlights of Q2 2017
                                           Financial Summary
Corporate and Operational Update

Conclusion

                                                                 3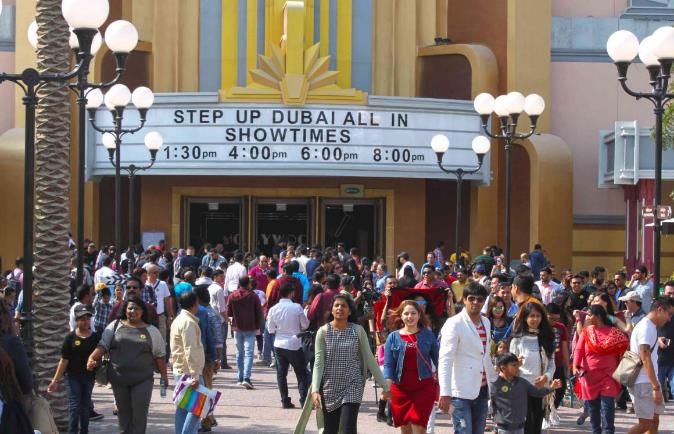
Organisational Restructure

                         4
Senior management changes
Mohamed Almulla appointed CEO
• Mohamed joined DXBE from Arab Media Group,
  where since 2008 he held the position of CEO
  overseeing all aspects of the Group whose operations
  comprise Arabian Radio Network, Done Events and
  Global Village.

• Between 2001 an 2008 Mohamed held several
  leadership positions within TECOM Investments,
  including Executive Director of Dubai Media City, a
  role in which he led the development of Media City as
  an international media hub, playing a key role in
  attracting leading global media brands to the region.

John Ireland appointed CFO
• John joined DXBE from Arab Media Group and
  previously Rotana Media Group where he held CFO
  positions, overseeing the financial, strategic and legal
  aspects of the Group’s operations.

• Prior to arriving in the Middle East John held finance
  and strategy roles at 21st Century Fox focusing across
  the group’s operations in Europe, Asia, and the Middle
  East.
                                                             5
Restructure DXB Entertainments
Structure DXBE for success

           Align organization structure with    Drive efficiencies and leverage        Utilise best-in-class
           strategic corporate goals            synergies                              management capabilities
           Alignment of management and          Similar assets to be clustered         Leverage management and
           organizational structure with P&L    together to create operating,          operational capabilities of
           responsibility                       revenue and cost efficiencies          operators and operational teams
                                                                                       in new decentralized structure

Position DXBE as the leading regional operator of leisure and entertainment assets

                         Owner of DPR                           Manage Meraas L&E assets
                         Leverage the ownership of DPR,         Undertake the management of key
                         utilizing its IP rights, and create    Meraas L&E assets with the
                         cross promotional sales, marketing     possibility of adding future flagship
                         packages and synergies                 pipeline assets

                                                                                                                         6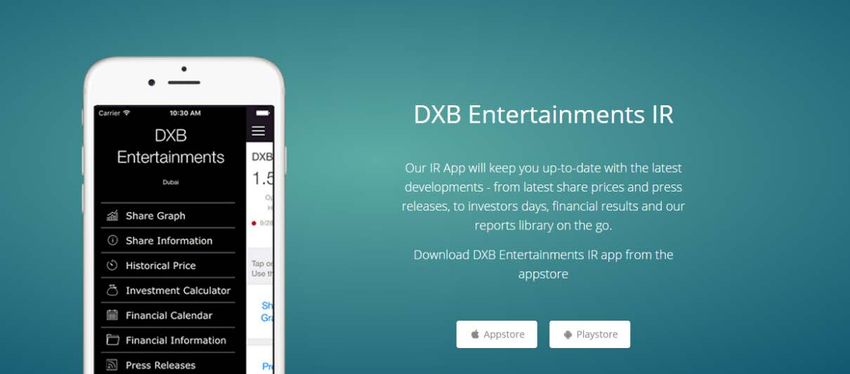
Creating the largest leisure and entertainment company in the region

                                                            Family
                                                         Entertainment                                              Retail and
  Theme Parks
                                                            Centers                                                 Hospitality

                                                                Coming Soon

   LEGO, the LEGO ® logo and LEGOLAND ® are trademarks of the LEGO Group. ©2017 The LEGO Group. LEGOLAND IS A PART OF MERLIN ENTERTAINMENTS plc.   7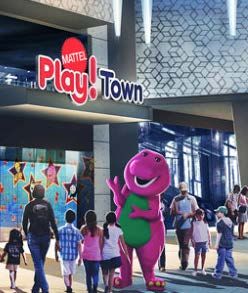
Operational Model

           Owner                  Manager

                                  Family
        Theme Parks            Entertainment
                                  Centers
      MOTIONGATE™ Dubai        HUB Zero
      Bollywood Parks™ Dubai   Splash Pad
      LEGOLAND® Dubai          The Green Planet
      LEGOLAND® Water Park     Play! Town
      Six Flags Dubai          The Void

        Retail and               Retail and
        Hospitality              Hospitality
      Lapita™ Hotel            ROXY Cinemas
      Riverland™ Dubai
      LEGOLAND® Hotel

                                                  8
Updated organisational structure
                                             CHIEF EXECUTIVE OFFICER
                                                 Mohamed Almulla

                                                                                Support Functions
                         FAMILY
                                            RETAIL &             FINANCE/         CORPORATE
   THEME PARKS       ENTERTAINMENT                                                                  MARKETING
                        CENTERS
                                           HOSPITALITY         STRATEGY & BD       SUPPORT
        GM                 GM                  GM                   CFO               VP                 VP
    Ahmad Hussain          TBD             Ahmed AlRayyes        John Ireland         TBD            Hani Soubra

Ahmad Hussain, GM of Theme Parks

Ahmad Hussain Bin Essa joins DXB Entertainments as GM of Theme Parks and will be responsible for overseeing the
Dubai Parks and Resorts theme parks. Previously he was the CEO of Global Village, the region’s premier cultural and
family entertainment destination.

Ahmed AlRayyes, GM of Retail and Hospitality

Ahmed AlRayyes initially joined DXB Entertainments in June 2017 as the Chief Corporate Support Officer. Ahmed
has now been appointed the GM of Retail and Hospitality managing the Lapita Hotel, Riverland Dubai, Roxy Cinemas
and the future LEGOLAND Hotel which is under construction. Prior to joining DXB Entertainments, AlRayyes held
the position of Chief Commercial Officer at Global Village, the region’s premier cultural and family entertainment
destination.

Hani Soubra, VP of Marketing

Hani Soubra joins DXB Entertainments as VP of Marketing. Hani is a media and communication specialist and the
former BBC World's Regional Director MENA & Pakistan.

                                                                                                                   9
Q2 2017 Update

             10
Key Q2 2017 performance highlights
1 April 2017 – 30 June 2017
Total Revenue Theme Park Revenue
AED 119.6 million AED 86.5 million
Visits Revenue per cap
414,454 AED 209
(theme parks)
Drawn down
Total assets
AED 12.5 billion AED 4.2 billion
of AED 4.2b Phase 1 facility
Due to rounding, numbers presented may not add up precisely to the totals provided and percentages may not precisely reflect the absolute figures. 30 June 2017 figures are
unaudited.
11Revenue breakdown (1 April – 30 June 2017)
Totalrevenue Theme parkrevenue Retail revenue Hospitality revenue
AED 119.6m AED 86.5m AED 8m AED 11.4m
Theme park 72% Admissions 63% Leasing 51% Accommodation 64%
Retail 7% In-park spend 32% Non-leasing 49% Others 36%
Hospitality 10% Others 5%
Others 11%
YTD total revenue Q2 Visits Q2 GLA leased Q2 Average occupancy
AED 279m 414,454 84% 27%
Q2 Revenue per capita Q2 Average daily rate
AED 209 AED 590
Theme parks
YTD total visits YTD average hotel occupancy
1,000,817 24%
Due to rounding, numbers presented may not add up precisely to the totals provided and percentages may not precisely reflect the absolute figures. 3O June 2017 figures are unaudited. The Group currently determines and presents
financial information as a single operating segment based on the information that is provided internally to corporate management for decision making. 12Summary financial results
Revenue
Q1 2017 Q2 2017 YTD 2017
AED millions AED279m
Revenue 160 120 279
Cost of sales (13) (20) (34)
Operating EBITDA
Gross profit 147 99 246
General, administrative and operating expenses (334) (284) (618)
AED(247)m
Marketing and selling expenses (41) (38) (78)
Interest (expense) / income (43) (52) (95)
Other expenses (21) (11) (32) Operating EBITDA (adjusted)
Loss for the period
Other comprehensive loss
(292) (286) (578)
AED(186)m
Excluding AED 61 million in pre-operating
Cash flow hedge – gain / (loss) on fair value 4 (22) (18)
expenses
Total comprehensive loss for the period (287) (308) (596)
General, administrative and operating expenses
For the six month period ended 30 June 2017
Salaries and other employee benefits 32%
Depreciation 38%
Utility 9%
Supplies, communication and IT 6%
Repairs and maintenance 4%
Rent 4%
Others 7%
Due to rounding, numbers presented may not add up precisely to the totals provided and percentages may not precisely reflect the absolute figures. 30 June 2017 figures are
unaudited.
13Corporate and Operational Update
14Tourism growth trends
Visitors from top 10 source markets Jan-May 2017 2016 % change
Total visitors Jan-May 2017 Jan-May 2017 (’000 visitors) India 944 776 23%
Saudi Arabia 670 721 -7%
7.26m UK
China
574
366
550
232
4%
58%
Up 10.16% YOY Oman 364 528 -31%
Pakistan 278 247 12%
USA 277 261 6%
Iran 257 198 30%
Germany 248 241 3%
Russia 221 110 101%
Total 4,199 3,864 10.16%
7% – Russia, CIS, EE
(Eastern Europe)
21% – Western Europe
6% – Americas 11% – North Asia and
South-East Asia
19% – GCC
18% – South Asia
12% – MENA
4% – Africa
2% – Australasia
Source of visitors by region (% in Jan-May 2017)
Source: Department of Tourism and Commerce Marketing (DTCM) 15Visits breakdown
Total Visits
414,454
April-June 2017
Visits breakdown (bycategory)
Walk-in 38%
Online & call center 31%
Tour operator 14%
Others 17%
Note: Others include Schools, Corporates, Annual passes, VIPs and
Complimentary passes
Key visitation factors:
Holy month of Ramadan: 26 May – 24 June
AED 95 all parks between 8pm-12am during Ramadan.
Summer pricing offer:
AED 195 per park inclusive of all you can eat offer
AED 265 two parks inclusive of all you can eat offer
16Sales and Marketing
01
Drive footfall and visitation by targeting the resident
market
Resident market will be the key driver of admissions and
visitation in Q42017 and FY2018
02
Develop and implement strategy for targeting the GCC
and the wider MENA region, define GCC as a core
resident market
03
Simplify and maintain consistent pricing to create clear
consumer messaging and avoid confusion
DXBE will introduce a simplified pricing mechanism
focused on driving the residential market, encouraging
multiple visitations and driving footfall.
04
Activate core markets through B2B channels
Trade in process of being fully activated.
17Human Resources
Employee breakdown
2,710
As at 30 June 2017
Theme parks 67%
Shared services and corporate 16%
Retail and hospitality 17%
66% 34%
Male Female
Close to 2,700 multi-cultural employees
from 86 nationalities.
18Conclusion
192017 expectations
Alignment of organizational and management structure to leverage core strengths and realise
synergies
Goal to identify further savings through organizational synergies
Management of Meraas leisure assets will create shareholder value and increase sales touch points
Formulate a consistent brand message, identify core target market for each park and ensure
messaging is appropriately tailored for each experience
Sales and Marketing focused on Q4 2017 with key drivers from resident and GCC visitors
New family entertainment center division will realise cross-promotion, sales and marketing synergies
across all key vertical assets
20Contact Us
Investor Relations Contacts DXB Entertainments PJSC
Marwa Gouda Sheikh Zayed Road, opposite
Head of Investor Relations the Palm Jebel Ali, Exit 5, Saih
Shuaib
Abdulrahman Al-Suwaidi PO Box 33772, Dubai
Investor Relations Officer United Arab Emirates
Tel: +971 4 820 0820
IR@dxbentertainments.com
contact@dxbentertainments.com
www.dxbentertainments.com/investor-relations
www.dxbentertainments.com
21DXB Entertainments IR App
Our new Investor Relations App is available for download on the
iTunes App store and the Google Play store!
22Appendix I
Overview of Meraas owned assets managed by DXBE
23Overview of Meraas owned assets managed by DXBE
Hub Zero The Green Planet
Indoor video gaming zone which includes Bio-dome housing a giant indoor
virtual reality shooting, virtual reality racing, ecosystem and 3,000 plants and animals
time-warped arcade and network games
Location: City Walk Location: City Walk
ROXY Cinemas Splash Pad
Cinema featuring variety of blockbuster Outdoor water recreational venue offering
movies various activities for toddlers and kids
Location: City Walk / The Beach / Box Park Location: The Beach
Play Town The Void
Indoor interactive games and play area for Gaming experience beyond virtual reality
kids between the age of 2 to 10 years old combining physical set with real-time
interactive effects
Location: City Walk Location: To be confirmed
24Appendix II
Summary Financials for the period ended 30 June 2017
25Summary financials
Condensed consolidated statement of Condensed consolidated statement of profit
financial position or loss and other comprehensive income
As at 30 June 2017 For the six month period ended 30 June 2017
30 Jun 17 31 Dec 16 Six months period
ended 30 June
Unaudited Audited
(AED m) (AED m) AED million 2017 2016
ASSETS Unaudited Unaudited
Property and equipment 9,451 9,465 Revenue 279 -
Investment properties 623 634 Cost of Sales (34) -
Investment in a Joint Venture 18 -
Gross profit 245 -
Inventories 50 42
Due from a related parties 25 21 General,administration and operating expenses (618) (89)
Trade and other receivable 155 90
Marketing and selling expenses (78) (22)
Derivative financial instruments 19 37
Other financial assets 618 990 Interest (expense) / income (95) 31
Cash and bank balances 1,502 1,535 Other expenses (32) -
Total assets 12,461 12,814
Loss for the period (578) (80)
EQUITY AND LIABILITIES Cash flow hedge – loss on fair value (18) (55)
EQUITY
Share capital 8,000 8,000 Total comprehensive loss for the period (596) (135)
Cash flow hedge reserve 19 37
Accumulated losses (1,217) (639)
Total equity 6,802 7,398
LIABILITIES
Bank facilities 4,003 3,204
Trade and other payables 1,656 2,212
Total liabilities 5,659 5,416
Total equity and liabilities 12,461 12,814
Due to rounding, numbers presented may not add up precisely to the totals provided and percentages may not precisely reflect the absolute figures. 30 June 2017 figures
are unaudited. 26Condensed consolidated statement of cash flows
For the six month period ended 30 June 2017
AED million Period ended 30 June
2017 2016
Unaudited Unaudited
Cash flows from operating activities
Loss for the period (578) (80)
Adjustments for:
Depreciation of property and equipment and investment properties 236 4
Interest (income) / expense 82 (36)
Amortization of borrowing cost 13 5
Provision for employees’ end of service indemnity 2 2
Operating cash flows before changes in working capital (245) (105)
Increase in trade and other receivables (57) (57)
Increase in inventories (8) -
(Decrease) / Increase in trade and other payables (554) 199
Increase in due from related parties (3) (13)
Cash (used in) / generated by operations (867) 24
Employees' end-of-service indemnity paid (2) -
Net cash (used in) / generated by operating activities (869) 24
Cash flows from investing activities
Decrease / (increase) in other financial assets and short term deposits 371 (532)
Additions to property and equipment (209) (2,086)
Additions to investment properties - (104)
Interest received 20 36
Investment in joint venture (18) -
Net cash generated by / (used in) investing activities 164 (2,686)
Cash flows from financing activities
Proceeds from additional shares issued - 1,678
Share issue costs - (9)
Proceeds from bank facilities 795 1,232
Payments for finance cost (108) (74)
Payments for finance lease (15) -
Increase in restricted cash - (14)
Net cash generated by financing activities 672 2,813
Net (decrease) / increase in cash and cash equivalents (33) 151
Cash and cash equivalents at the beginning of the period 1,344 364
Cash and cash equivalents at the end of the period 1,311 515
Due to rounding, numbers presented may not add up precisely to the totals provided and percentages may not precisely reflect the absolute figures. 30 June 2017 figures 27
are unaudited.You can also read