Alcohol SIP (Shelter-In-Place) Survey - Los Angeles County 2020 Alcohol SIP Survey, LA County
←
→
Page content transcription
If your browser does not render page correctly, please read the page content below

2020 Alcohol SIP Survey, LA County

Alcohol SIP (Shelter-In-Place) Survey
            Los Angeles County
                July 15, 2020

                                                                     0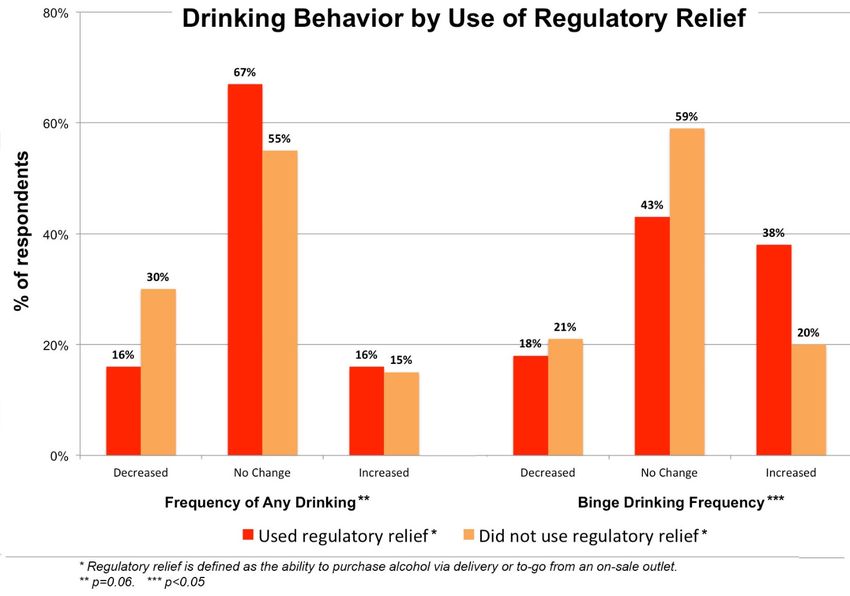
2020 Alcohol SIP Survey, LA County

Contents

           1. Executive Summary…………………………………………………….                             2
              Overview…………………………………………………………………..                                2
              Findings……………………………………………………………………                                 2
              Conclusion…………………………………………………………………                                3

   2. Introduction………………………………………………………………………                                    3

   3. Methods…………………………………………………………………………..                                      4

   4. Results…………………………………………………………………………….                                      5
            Demographics……………………………………………………………. 5
                   Table 1 - LAC-SIPS Demographic Characteristics…………... 5
            Drinking Behavior………………………………………………………… 7
                   Table 2 - Pre-SIP vs. Past 30 Days Alcohol Use Behaviors… 7
                   Figure 1 – Drinking Behavior by Use of Regulatory Relief….. 9
            Purchasing Behaviors…………………………………………………… 10
   5. Discussion……………………………………………………………………….                                    10
   6. Limitation………………………………………………………………………… 12
   7. Conclusion………………………………………………………………………. 12
 References………………………………………………………………………………. 13

                                                                                        1
2020 Alcohol SIP Survey, LA County
Executive Summary
OVERVIEW
Under the COVID-19 shelter-in-place (SIP) order, California authorities have treated alcohol
sales as a priority, enacting a number of “regulatory reliefs” – deregulatory measures intended
to facilitate alcohol purchasing. Although the state has justified this as an economic measure,
alcohol use has demonstrable effects on public health and safety. Overconsumption of alcohol
is implicated in several hazardous outcomes, including accidental injury, violent crime, suicide
attempts, and intimate partner violence. Moreover, research suggests that alcohol’s effects on
the immune system may predispose individuals to contracting the coronavirus and worsen the
outcomes once exposed. To begin to assess these risks, Alcohol Justice and the Institute for
Public Strategies (IPS) conducted the Los Angeles County Alcohol Shelter-In-Place (SIP)
Survey, an online pilot survey of 218 alcohol-using residents of Los Angeles County to see how
these regulations may have impacted drinking behaviors.
Respondents were asked to compare their alcohol use in the year up to the mid-March 2020
SIP order with their alcohol use in “the past 30 days” during the SIP order, in May or June 2020.
Findings
23.4% of respondents reported binge drinking (defined as a session of 5+ drinks for
males, 4+ for females) weekly, multiple times a week, or daily. 28% of respondents
reported the frequency of their binge drinking had increased since SIP; males were more
likely to report this increase.
Race and ethnicity were associated with increased frequency of binge drinking. During
SIP, 28% of Caucasian respondents engaged in binge drinking weekly or more,
compared to 23.6% of Hispanic respondents and 20% of African-American respondents.
However, African-American and Hispanic respondents were more likely to have
increased their binge drinking after SIP (37% and 38%, respectively). Hispanic or Latinx
identity was also strongly associated with increased binging (38%).
42% of respondents made use of regulatory relief measures (buying alcohol through
delivery or to-go from an on-sale licensee). Respondents who made use of regulatory
relief measures (buying alcohol through delivery or to-go from on-sale licensees) were
significantly more likely to report an increase in binge drinking (38%, vs. 20% of those
not making use of regulatory relief).
Compared to pre-SIP, reports of drinking alone increased nominally, and drinking while
socializing via an internet-connected device increased 52%.
22020 Alcohol SIP Survey, LA County
Individuals who changed their alcohol product of preference during the past 30
days were substantially more likely to change to a high-alcohol-content
product (wine, liquor, or flavored malt beverages) than to a lower alcohol
content product (beer, hard seltzer, or hard cider; 59% versus 41%).
Conclusion
Although the current survey did not find an overall increase in amount of alcohol
consumed, high-risk behaviors— binge drinking—increased, particularly among
economically distressed residents, as well as residents of African and Hispanic/Latinx
descent. These increases were associated with accessing alcohol through means
facilitated by deregulation. In addition, possibly to seek “more bang for the buck”
under economic duress, many respondents were switching to stronger alcohol
products.
This combination calls into question the wisdom of regulatory relief, and demands
ongoing monitoring or rollback of such relief, which, in essence, vastly increases the
density of off-sale alcohol outlets via alcohol delivery and ‘to-go’ services. While there
has always been a need for aggressive outreach to individuals engaged in harmful
drinking behaviors, the urgency is compounded by the stressors and risks of the
COVID-19 pandemic, particularly among vulnerable populations, since alcohol use
itself seems to be a risk factor for both contracting the novel coronavirus and the
severity of the ensuing disease. (8)
Introducti on
In January 2020, the first cases of the novel coronavirus disease dubbed “COVID-19”
were diagnosed in the United States. The virus proved easily transmissible through
salivary droplets and spread readily in situations of close interpersonal contact. Due
to its virulence and ability to cause long-term debilitating illness in some patients,
California officials began urging that local governments intervene and reduce the
opportunities for social gathering. (1)
As a public health response, on March 16, 2020, the City of Los Angeles issued an
emergency order for all residents to shelter-in-place. As part of this order, all bars
and restaurants were closed to on premise customers, and other restrictions that
altered shopping behaviors were placed upon grocery and liquor stores.
For alcohol researchers as well as everyone else this created an uncertain situation.
Initial reporting suggested that alcohol consumption was spiking or at least that
stockpiling was taking place, with many households purchasing in bulk from off-sale
outlets in the beginning month of the order. (2) However, the SIP order was extended
repeatedly. Although the data are incomplete, the National Institute on Alcohol Abuse
and Alcoholism suggests that in many states, beer purchasing began declining as
32020 Alcohol SIP Survey, LA County
early as April. (3) In an April 2020 Morning Consult poll, 16% of adults said their
drinking had increased, while 19% said it had decreased. (4) Similar results were
found in an Australian countrywide survey, where 20.2% of respondents said their
alcohol use increased versus 27% saying their use decreased. Women were more
likely than men to see their use rise. (5)
Meanwhile, in an effort to protect businesses and jobs within the alcohol industry, the
California Department of Alcoholic Beverage Control (ABC) announced it would
cease enforcing certain laws that restrict how alcohol can be sold. (6) Restaurants,
and later some bars, were allowed to engage in home delivery of prepackaged
alcoholic beverages, as well as provide mixed drinks from takeout windows.
It was unclear how widely customers took advantage of these “regulatory relief”
notices. However, the essential effect of these relief measures is to vastly increase
the density of off-sale alcohol outlets. This density is associated with excessive
consumption and a number of concomitant adverse outcomes, including traumatic
injury, interpersonal violence, intimate partner violence, and suicide. (7) Moreover,
alcohol use itself seems to be a risk factor for both contracting the novel coronavirus
and the severity of the ensuing disease. (8)
In a May 2020 letter to Drug and Alcohol Review, an international group of
researchers led by renowned Jürgen Rehm mapped out two trajectories for alcohol
use as a result of lockdown, economic harm, and changes in the alcohol sales
environment. The first trajectory predicted that individuals would react to distress,
both from economic shock and from emotional trauma surrounding uncertainty and
isolation, by increasing their alcohol consumption. The second was that individuals
would decrease their use as economic hardship reduced their ability to purchase
alcohol. The authors emphasize that these trajectories are not mutually exclusive. (9)
As of the June 29, 2020 completion of this survey, 211,000 cases of COVID-19 had
been confirmed in California. This included nearly 6,000 deaths, 54% of which
occurred in Los Angeles County. (10) This suggests that shelter-in-place orders
should continue, and makes it imperative that public health professionals and
policymakers understand the effects of these SIP policies on behavioral health,
including consumption of alcohol. The Los Angeles County Alcohol Shelter-In-Place
(SIP) survey seeks to inform these groups by performing a pilot assessment of
changes in drinking patterns during SIP.
Methods
The questionnaire for SIPS was designed by Alcohol Justice in collaboration with the
Institute for Public Strategies (IPS), and under contract to IPS. Alcohol use questions
were sourced from the Alcohol Use Disorders Identification Test (AUDIT). Further
questions on economic burden were based on those used in Eurocare’s rapid
response survey. In addition, the researchers added a battery of questions intended
42020 Alcohol SIP Survey, LA County
to evaluate the effects of ABC’s regulatory relief measures. All questions were
reviewed by IPS staff. “Typical” alcohol use was framed as being within the past 12
months, but before the SIP order in March 2020. Alcohol-related behaviors during
SIP were assessed by asking about the past 30 days.
Inclusion criteria were age ≥ 21 years, primary residence within Los Angeles County
(including the City of Los Angeles), and at least one drink of alcohol in the past 12
months.
Respondents were recruited between June 1, 2020, and June 25, 2020. Initial
recruitment was performed via advertisements on Facebook. However, it proved
difficult to validate responses using this method, so the majority of recruitment was
conducted via Mechanical Turk (MTurk; http://www.mturk.com), a service operated
by Amazon. Mechanical Turk distributes surveys to individuals who complete
assigned online “tasks,” in this case to complete a survey about alcohol use during
SIP. The request was limited only to residents of Los Angeles County, with ZIP code
and IP checks used for validation. Unlike traditional online survey distribution via
social media advertising, MTurk personnel are incentivized to receive good reviews
for their work, minimizing fraud. Respondents recruited via Facebook received a $5
Amazon e-gift card and the opportunity to enter a drawing for a $100 card. Because
Amazon does not allow requesters to gather email addresses, respondents from
MTurk only received a $5 payment via the service.
The final sample comprised 11 responses gathered through social media and 207
gathered via MTurk.
Results
Demographics
The mean age of the sample was 36 years (95% CI 34.7 – 37.3 years). Demographic
details are presented in Table 1. Of the Hispanic or Latinx-identified respondents, 29
(53%) were Mexican or Mexican-American. The respondents were largely married or
in long-term partnerships, with only 38% (n=83) reporting being single, separated or
divorced. Note that the researchers assessed transgender identity separately from
sexual orientation.
Table 1. LAC-SIPS Demographic Characteristics
N %
Gender
Male 130 59.6
52020 Alcohol SIP Survey, LA County
Female 86 39.4
Non-binary 2 0.9
Lesbian, Gay, or Bisexual 28 12.8
Transgender 21 9.6
Race
African or African-American 30 13.8
Asian 45 20.6
Caucasian 115 52.8
Native American* 9 4.1
Pacific Islander 1 0.5
More than one race 8 3.7
Other 10 4.6
Ethnicity
Hispanic or Latinx 55 25.2
Income
Less than $ 30,000 per year 46 21.1
$30,000 - $70,000 per year 106 48.6
$71,000- $100,000 per year 32 14.7
$101,000 - 200,000 per year 32 14.7
$201,000 - 999,000 per year 2 0.9
Education
62020 Alcohol SIP Survey, LA County Finished High School 23 10.6 Associate's 21 9.6 Bachelor's 125 57.3 Master's 43 19.7 Doctorate 5 2.3 Other 1 0.5 Recent economic instability was a frequent event within the sample. Over half (51%, n=111) of respondents reported losing income since SIP. Loss of work, through layoff or furlough, affected 26% (n=58). Drinking Behaviors Drinking behaviors in the previous year but prior to SIP and in the past 30 days are shown in Table 2. Compared to pre-SIP, 24% of respondents (n=52) reported drinking alcohol less frequently in the past 30 days, compared to 16% (n=34) who reported that they drank more frequently. Over 10% (n=22) reported not drinking at all in the past 30 days. Males were equally likely to have seen a rise (16%, n=21) or decline (16%, n=21) in frequency of drinking. Females, on the other hand, were more likely to decline in drinking frequency, with 36% (n=31) drinking less often vs. 15% (n=13) drinking more often in the past 30 days (p
2020 Alcohol SIP Survey, LA County

Once a month or less                         37         17.0         38           17.4

2-4 times per month                          89         40.8         70           32.1

2-3 times a week                             57         26.1         53           24.3

4 times a week or more                       28         12.8         35           16.1

          Binge drinking frequency         Before SIP              Past 30 days

Did not drink                                 7          3.2         22           10.1

Never                                        65         29.8         69           31.7

Once a month or less                         80         36.7         41           18.8

Several times per month                      24         11.0         36           16.5

Weekly or several times per week             34         15.6         38           17.4

Daily or almost daily                         8          3.7         13            6.0

                              Total         218         100         218           100

There was no significant change in frequency of drinking by racial identity. Africans or
African-Americans (37%, n=11) and Caucasians (33%, n=38) were more likely to see
increases in binge drinking after SIP. Asians, Native Americans, and Pacific Islanders
were more likely to see decreases in binge drinking (p
2020 Alcohol SIP Survey, LA County
Figure 1).
Socialization changed substantially between pre-SIP and the last 30 days.
Respondents reported significant decreases in drinking with friends, drinking at bars,
and drinking at professional events. Reports of drinking alone rose slightly in the last
30 days (from 41% to 45% of respondents), and reports of drinking while socializing
via the computer, phone, tablet, or video game device increased 52% (from 11% to
17% of respondents).
More than 1 in 3 (n=76) respondents drank alcohol outside of their own home in the
past 30 days. Most drinking outside the home was at someone else’s house or a bar
or restaurant, although a substantial number reported drinking at parks or beaches,
and 15% (n=11) of those who drank outside the home did so on the street.
Figure 1
92020 Alcohol SIP Survey, LA County Purchasing behaviors The SIP order may be associated with a move in consumer preference towards slightly stronger alcohol products. Of the 30% of respondents (n=59) who switched their product of choice between pre-SIP and the past 30 days, 59% of them (n=35) switched to hard liquor, wine, or flavored malt beverages, all relatively higher- alcohol products than the beer, cider, or hard seltzer that the other 41% switched to (p
2020 Alcohol SIP Survey, LA County

On the other hand, the increase in risky drinking may be a reflection of a greater
societal trend. Overall, United States residents who drink are drinking in more
dangerous ways. (12) Aside from the concerning finding that over a quarter of
respondents reported binge drinking more frequently, there was a notable though
statistically insignificant trend for individuals who had been more frequent drinkers
over the course of the year also being the most likely to binge more, while occasional
drinkers were likely to cut down even further. This “great sort” describes a prevention
challenge, since the people who were already drinking frequently are likely ones who
were harder to reach with behavioral health messaging.

This high-risk cohort may be placed at further risk by ABC’s decisions regarding
regulatory relief. Nearly as many individuals getting alcohol to-go or via delivery
reported an increase in binge drinking as reported no change (38% vs. 43%),
whereas individuals not using relief were slightly more likely to see a decrease in
binge drinking. While it is important to note that these findings are not causal,
previous research demonstrates a clear link between alcohol availability policies and
binge drinking. (13)

The increase in binge drinking among individuals already vulnerable to dangerous
drinking patterns is compounded by a noted shift towards stronger alcohol products.
This may be an attempt to get “more bang for your buck” as individuals lose income,
but raises the concern that these products may encourage more servings of alcohol
per drinking session. Since hazardous alcohol use patterns are implicated in both
behavioral inhibition and susceptibility to infection, (8) the current pandemic makes it
even more important that health promotion efforts reach that population.
Nonetheless, it should be emphasized that there were a considerable number of
respondents who reduced their drinking. Nearly 1 in 4 respondents reported drinking
less after SIP, and 1 in 5 binge drank less. Continued monitoring and research may
be necessary to determine what predicts a drop in drinking, and how these
individuals can be supported to maintain healthier habits.
As for efforts to economically shore up alcohol sellers through regulatory relief,
although there has been some uptake, it has been surprisingly slim and could
perhaps be better validated through sales data or surveys. This could be an artifact of
the sample, of whom the majority had lost income. In those situations, the upcharge
(i.e. price increases) associated with nearly all of the ABC’s regulatory relief concepts
may be a substantial disincentive.
Of particular note, respondents’ general avoidance of delivery apps may be a
particular blessing, since ABC itself has admitted that drivers for those apps are
frequent violators of laws surrounding alcohol sales, and has moved towards tougher
oversight. Despite the limited uptake, the alcohol industry will almost certainly use the
economic distress faced by small business owners to appeal for the continued
liberalization of alcohol laws, as they are already doing in other states. It is important

                                                                                               11
2020 Alcohol SIP Survey, LA County
to push back against these efforts by noting that deregulation is not an economic
panacea, and that even with decreased sales, we are seeing individuals drinking in
ways more likely to cause them harm.
It should be emphasized that bars and restaurants had a limited reopening while this
survey was still underway. Because the situation is so changeable, continued
monitoring is warranted to see if alcohol trends are following one or both of the
trajectories described by Rehm and colleagues. (9) What is certain is that the current
sample suggests concerning trends around binge drinking in particular, suggesting a
human cost to efforts to buoy the economy through alcohol deregulation.
Limitations
The heavy use of Mechanical Turk creates idiosyncratic samples. (13) Although the
sample was large and diverse enough to find meaningful effects, Hispanic/Latinx
respondents were severely underrepresented compared to the demographics of Los
Angeles County. Because Mechanical Turk allows respondents to make money as
independent contractors, it is frequently a revenue source of last resort. This may
have skewed the sample towards lower-income or more economically impacted
individuals. The sample also skewed male, an effect that is seen frequently in
surveys that are collected entirely online.
The fact that data were collected during June 2020 also created an irreplicable
environment. It is not clear how quickly drinking behavior is evolving under SIP, but
public health orders are constantly evolving and a June sample may have major
differences from one taken in April or July. This is compounded by the fact that June
marked a major wave of social unrest in many urban areas, including Los Angeles. It
is impossible to say what effect this may have had on alcohol use.
Lastly, the number of responses identifying as transgender was remarkably high.
This could also be an effect from Mechanical Turk. The service may be of particular
value to individuals who do not feel safe in the workforce or who have otherwise
suffered economic or social discrimination.
Conclusion
SIP has created a retail and social environment the likes of which no U.S. public
health official has seen before. Within Los Angeles County, this environment has
resulted in increased binge drinking among economically distressed residents, as
well as residents of African and Hispanic/Latinx descent. More broadly, individuals
who were inclined to drink before now seem inclined to drink in more dangerous
ways. As this is accompanied by ostensibly temporary alcohol law liberalization, the
public health community should be proactive in reaching affected members of the
community before dangerous drinking patterns manifest as personal harm. Shelter-
in-Place combined with untested or haphazard regulatory relief has numerous public
health effects on drinking behavior that deserve further study. Nevertheless, this
study raises cautions against permanent relief policies, and indicates numerous
avenues of harm to demographic sectors.
122020 Alcohol SIP Survey, LA County
REFERENCES
1) Executive Department, State of California. (2020). “Executive order N-33-20.” Available
at: https://www.gov.ca.gov/wp-content/uploads/2020/03/3.19.20-attested-EO-N-33-20-
COVID-19-HEALTH-ORDER.pdf. Sacramento, CA: State of California Executive
Department. Accessed July 10, 2020.
2) Associated Press. (2020). “Booze buying surges; senators push airlines for cash
refunds.” Available at: https://apnews.com/c407ecb931c6c528b4cceb0ecc216f0c.
Associated Press. Accessed July 10, 2020.
3) National Institute on Alcohol Abuse and Alcoholism. (2020). “Surveillance report
COVID-19: Alcohol sales during the COVID-19 pandemic.” Available at:
https://pubs.niaaa.nih.gov/publications/surveillance-covid-19/COVSALES.htm.
Bethesda, MD: National Institutes of Health. Accessed Jule 10, 2020.
4) Morning Consult. (2020). “Cooped up at home, Millennials most likely among all adults
to turn to food, alcohol.” Available at:
https://morningconsult.com/2020/04/06/coronavirus-social-distancing-millennials-
eating-drinking/. Washington, DC: Morning Consult. Accessed July 12, 2020.
5) Australian National University Centre for Social Research and Methods. (2020).
“Alcohol consumption during the COVID-19 period: May 2020.” Available at:
https://csrm.cass.anu.edu.au/sites/default/files/docs/2020/6/Alcohol_consumption_duri
ng_the_COVID-19_period.pdf. Canberra, Australia: Australian National University.
Accessed July 12, 2020.
6) California Department of Alcoholic Beverage Control. (2020). “Coronavirus (COVID-19)
updates.” Available at: https://www.abc.ca.gov/law-and-policy/coronavirus19/.
Sacramento, CA: California Department of Alcoholic Beverage Control. Accessed June
29, 2020.
7) The Guide to Community Preventive Service. (2007). “Alcohol—excessive
consumption: Regulation of alcohol outlet density.” Available at:
https://www.thecommunityguide.org/findings/alcohol-excessive-consumption-
regulation-alcohol-outlet-density. Atlanta, GA: The Community Guide. Accessed July
12, 2020.
8) Testino G. (2020). Are patients with alcohol use disorders at increased risk for Covid-
19 infection? Alcohol and alcoholism, 55(4), 344–346. DOI: 10.1093/alcalc/agaa037
9) Rehm J, Kilian C, Ferreira-Borges C, Jernigan D, Monteiro M, Parry C, Sanchez Z &
Mathey J. (2020). Alcohol use in times of the Covid 19: Implications for monitoring and
policy. Drug and alcohol review, 39, 301-304. DOI: 10.1111/dar.13074
10) New York Times. (2020). “California coronavirus map and case count.” Available at:
https://www.nytimes.com/interactive/2020/us/california-coronavirus-cases.html. New
York Times. Accessed June 29, 2020.
11) United States Centers for Disease Control and Prevention. (2018). Behavioral Risk
Factor Surveillance System. Atlanta, GA: United States Centers for Disease Control
and Prevention.
12) Kanny D, Naimi TS, Liu Y, Brewer RD. (2020). Trends in total binge drinks per adult
who reported binge drinking—United States, 2011–2017. MMWR Morb Mortal Wkly
Rep 69:30–34. DOI: http://dx.doi.org/10.15585/mmwr.mm6902a2
132020 Alcohol SIP Survey, LA County
13) Silver, D., Macinko, J., Giorgio, M. & Bae, J.Y. (2019) Evaluating the
relationship between binge drinking rates and a replicable measure of U.S.
state alcohol policy. PLoS ONE, 14(6), p.e0218718.
https://doi.org/10.1371/journal.pone.0218718
14) Walters, K., Christakis, D. A., & Wright, D. R. (2018). Are Mechanical Turk
worker samples representative of health status and health behaviors in the
U.S.? PloS ONE, 13(6), e0198835.
https://doi.org/10.1371/journal.pone.0198835
14You can also read