NIGERIA MEDIA CONSUMER SURVEY REPORT - HOW NIGERIANS ARE INTERACTING WITH MEDIA, INTERNET AND TECHNOLOGY - BusinessDayOnline.com
←
→
Page content transcription
If your browser does not render page correctly, please read the page content below
NIGERIA MEDIA
CONSUMER
SURVEY REPORT
HOW NIGERIANS ARE INTERACTING WITH
MEDIA, INTERNET AND TECHNOLOGY

 FIRST EDITION
Media Consumer Survey 2018

                    This publication contains general information only. This     © BRIU, 2018
                    publication is not a substitute for such professional ad-    6, Point Road, G.R.A.,
                    vice or services.                                            Apapa, Lagos
                                                                                 www.businessdayonline.com
                    Before making any decision or taking any action that         email: research@businessdayonline.com
                    may affect your finances or your business, you should
                    consult a qualified professional adviser.

                    BusinessDay Media Limited shall not be responsible for
                    any loss whatsoever sustained by any person who relies
                    on this publication.

                    This report is prepared by:                                 Designed by:

                    Omosomi Omomia                                              Aderemi Ayeni
                    Tel: +234 809 482 1958                                      Tel: +234 703 435 2828
                    Email: omosomi.omomia@businessdayonline.com                 Email: aderemi.ayeni@businessdayonline.com

2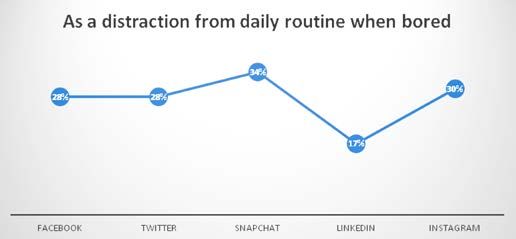
Media Consumer Survey 2018

Contents
Foreword								5

Executive Summary						6

Global Digital Media Trends					8

The Survey								10

Survey Insights							13

Video								16

Television								19

Social Media							27

Conclusion								42

                                                                 3
Media Consumer Survey 2018

                           BusinessDay Research & Intelligence Unit (BRIU) is a Strategic Business Unit (SBU) within the
                           BusinessDay Group, publishers of Nigeria’s leading business & financial newspaper. BRIU
                           operates as an independent department within the organisation. The Unit’s products and
                           services comprise:

                           •     Cutting-edge business intelligence and market research studies
                           •     Industry analysis & reports
                           •     Feasibility studies & business plans
                           •     Client-specific research projects and strategic planning
                           •     Polling and surveys covering industries and business segments

                           Our areas of focus include market and industry research, data mining, and eco¬nomic and
                           financial analysis. BRIU seeks to provide you with rare insights from our robust economic
                           forecasting models and analytics.

                           We serve clients from such diverse corporate sectors as banking, insurance, financial ser-
                           vices, manufacturing, healthcare, ICT. BRIU also consults for state and federal government
                           ministries, agencies and departments.

                           Our team of research analysts is committed to providing you with the latest insights and
                           perceptions on current trends and developments in your sector, and providing you with
                           intelligence on the Nigerian and global economies.

4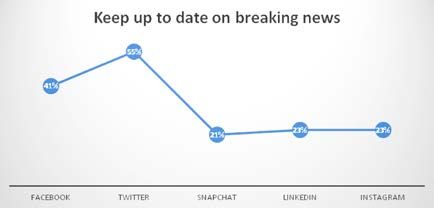
Media Consumer Survey 2018

Foreword
Omosomi Omomia

BusinessDay Research & Intelli-        at 103.2 percent. Internet sub-          band access and Gross Domestic
gence Unit (BRIU) is delighted to      scription as at the same period          Product. It is said that every 10
present the results of our quarterly   accounts for 68 percent of the           percent increase in broadband
Digital Media Consumer Survey          total mobile data with 98.4 mil-         penetration in developing coun-
which reflects the views of 925        lion subscribers. Q2 2017 data by        tries results in a commensurate
consumers on their usage and           the NCC shows that the telecoms          increase of 1.3 percent in GDP.
preferences of the digital media       industry contributed 9.5 percent
space in Nigeria.                      to the national GDP.                     Irrespective of what stage of the
                                                                                digital age, countries of the world
The world is in the digital age. As    Nigeria’s internet penetration is        are at, the bottom-line is that
a result, information is disseminat-   hinged entirely on mobile tele-          the internet and technology are
ed and distributed more rapidly        phony services. Hence, excluding         transforming the way businesses,
than ever before, particularly via     mobile telephony, internet pene-         civil societies, governments and
social media platforms and search      tration in Nigeria is still relatively   humans operate.
engines. Nigeria’s venture into the    low at 21 percent.
digital age is driven by deepened                                               It has therefore become neces-
mobile penetration and the c0un-       In today’s world as digital transfor-    sary for stakeholders in Nigeria to
try’s growing and digitally savvy      mation fully takes hold, access to       understand the current consumer
youth demography.                      the internet and broadband have          trends and preferences in terms
                                       become the foundation for trans-         of how consumers are interacting
According to the Nigerian Com-         formation to a knowledge-based           with media, entertainment and
munications Commission (NCC),          economy.                                 technology. This survey attempts
total number of mobile subscrib-                                                to provide a lens to this under-
ers in Nigeria as at December 2017     Research by the World Bank has           standing.
is 145. 1 million with teledensity     established a link between broad-
                                                                                                                                  5
Media Consumer Survey 2018
Executive Summary
BusinessDay Research & Intelligence Unit (BRIU) con- (on any device) and listening to music on any device.
ducted a nationwide survey to assess consumers’ dig-
ital media activities, social media preferences, as well The most watched videos in order of preference are
as level of usage. Focusing on six distinct age groups, TV show episodes/clips, Entire movies (download-
the survey provides a snapshot of how consumers are ed versions), Funny clips and videos constituted 46
interacting with media, entertainment and technolo- percent and music videos. There has been a surge in
gy and considers their preferences in the future. The appeal for foreign TV shows in Nigeria, especially Latin
survey was concluded in January 2018. 925 consum- America and US exports. Funny videos and clips is
ers completed the online survey. Respondents within also fast becoming a popular trend among Nigerians
the age group of 21 to 25 years old accounted for half with new media comedians emerging in the media &
of the total sample size. entertainment space and successfully challenging the
traditional stand-up comedy scene in the country.
Consumers who responded to the survey were most-
ly males constituting 78 percent of the participants. Popular new media comedians such as Emanuel-
la (Mark Angel), Frank Donga, Lasisi Elenu, among
The survey shows that the top three preferred enter- others, already attract significant followership on their
tainment activities by consumers are using the inter- respective social media handles including Instagram
net for social or personal interests; watching television and YouTube. Their videos are also more likely to be
6Media Consumer Survey 2018
shared multiple times on WhatsApp and other online work and surfing the web are the things they typically
platforms. do while watching television at home. Other infor-
mation contained in the Report include the high-
Subsequently, companies have begun to exploit their est number of media entertainment devices in the
brand equity through product and event endorse- household; the average amount of time spent watch-
ments. For instance, in December 2017, Emmanuella ing TV shows on various entertainment and media
Samuel, was officially signed as the Brand Ambas- devices; the top reasons for using various social me-
sador of FreshYo yoghurt manufactured by Olam dia platforms; the most frequently used mechanism
Nigeria, while Lasisi Elenu promoted the Access Bank to get news, among others.
Lagos City Marathon.
Watching downloaded programming content was
the most popular activity of respondents, while
watching live programming was the second most
popular method of viewing television content.
The third most popular programming method was
On-demand programming or pay-per-view.
Consumers revealed that using a social media net-
7Media Consumer Survey 2018
Global Digital Media Trends
Globally, media usage is progressively being con- Media development in the United States has wit-
sumed via digital formats. The growing adoption of nessed tremendous transformational growth from
this format can be attributed to the growing number traditional media to new (digital) media. The rise of
of devices embedded with digital capability in addi- digital media players such as Netflix, Hulu, Amazon,
tion to increasing access to the internet, which has Apple TV, among others are challenging the incum-
granted the average individual a plethora of choices bent dominance of the television as the main enter-
in accessing media content in any form: information, tainment hub.
entertainment or social activity any place of the world
at all times. YouTube is the largest video-sharing website in the
world. As at February 2017, there were more than
According to Statista, revenue in the world’s digital 400 hours of content uploaded to YouTube each
media market is estimated to be about US$119.2 minute with one billion hours of content watched on
billion in 2018. The market’s largest segment is the YouTube every day. As of August 2017, the website is
video games with a market value projected to reach ranked as the second-most popular site in the world
US$67.4 million in 2018. Most of the revenue is ex- by Alexa Internet, a web traffic analysis company.
pected to be generated in the United States (US$41.9 It is also the second-most used search engine after
billion in 2018) accounting for 35 percent of global Google.
proceeds.
In Nigeria, there has been tremendous investments
by the banks in the digital media sector with the
8 emergence of Ndani TV (GTBank), Red TV (UBA) andMedia Consumer Survey 2018
Accelerate TV (Access Bank) on the YouTube platform. cent of total smart phones in Sub-Saharan Africa as
The most notable player on the digital media scene a whole, driven almost wholly by Nigeria with smart
is iROKOtv, a web platform that provides paid-for phone penetration estimated at 30 percent. Accord-
Nigerian films on-demand. It is one of Africa’s first ingly, smart phone adoption in ECOWAS will exceed
mainstream online movie steaming websites, giving 50 percent of total connections by 2020, according
instant access to over 5,000 Nollywood film titles. to a report on the mobile economy in Sub-Saharan
Dubbed the ‘Netflix’ of Africa, iROKOtv is the world’s Africa by GSMA Intelligence.
largest legal digital distributor of African movies. Iflix,
a subscription video-on-demand service focused on According to PwC’s global entertainment and media
emerging markets and headquartered in Kuala Lum- outlook report (2017 – 2021), Nigeria with will be
pur, Malaysia, is the latest kid on the block. the world’s fastest-growing Entertainment & Media
market over the next five years strongly influenced by
Online media consumption has shown tremendous surging spending on mobile Internet access.
growth over the past few years. Among the digital de-
vices, mobile devices have taken over as the preferred
medium of consuming online media. The smart-
phone market has seen an unprecedented growth in
the last 5 years. Smartphone devices across the globe
grew at a CAGR of 17 percent as compared to 9.5
percent growth in all mobile devices. Smartphones
crossed the 2 billion mark in 2014 and are expected
to reach 4.6 billion by 2019. This increase in the num-
ber of mobile devices is making it easier for consum-
ers to access music and video content on the go.
The West African region accounts for nearly 50 per-
9Media Consumer Survey 2018
The Survey
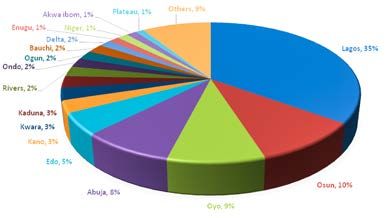
BusinessDay Research & Intelligence Unit (BRIU) conducted a nationwide survey to assess consumers’ digital
media activities, social media preferences, as well as level of usage. The chart below shows the States from which
respondents were drawn. Lagos State with 35 percent accounted for the bulk of responses, which is unsurprising
considering the level of broadband coverage, mobile penetration and internet activities within the State. Ac-
cording to data released by the National Bureau of Statistics (NBS) in Q3 2016 on the telecommunications sector,
Lagos ranked the highest with 12,957,617 internet users.
10Media Consumer Survey 2018
Focusing on six distinct age groups, the survey provides a snapshot of how consumers are interacting with
media, entertainment and technology and considers their preferences in the future. The report was concluded in
January 2018. 925 consumers completed the online survey. Respondents within the age group of 21 to 25 years
old accounted for half of the total sample size.
2% 5%
21%
9% 16-20
21-25
26-30
21% 31-35
36-40
50%
56-60
The survey sought to gauge respondents’ consumption and preferences for the various channels and medium of
entertainment including television, computers and laptops, mobile devices, as well as the content they mostly
view through these distribution channels.
11Media Consumer Survey 2018
Consumers who responded to the survey were mostly males constituting 78 percent of the total sample size.
12Media Consumer Survey 2018
Survey Insights
Entertainment Activities
Respondents were asked to rank their top three (3) preferred entertainment activities: Using the internet for social
or personal interests accounted for the top activity with 78 percent; the second was watching television (on any
device) with 58 percent, closely followed by listening to music on any device (57 percent).
13Media Consumer Survey 2018
Other ranked activities included: newspapers (either print or online) accounted for the least preferred
Reading books (any format) – 42 – 32 percent. entertainment activities among
percent; Playing video games on respondents.
any device (34 percent); Listening Going to the movies; Reading
to the radio (any format and/or magazines (either print or online)
device) – 33 percent and Reading and attending live performances
14Video
Media Consumer Survey 2018

                 Video

                 When queried on the kind of videos respondents watched on their laptops, tablets and mobile phones, TV show
                 episodes/clips accounted for 58 percent of videos viewed on any of the abovementioned devices. Entire movies
                 (downloaded versions) accounted for 51 percent of video consumption. Funny clips and videos constituted 46
                 percent closely followed by music videos with 43 percent of coverage.

16
Media Consumer Survey 2018
Documentaries and Movie previews/promos accounted for 33 percent of videos consumed respectively, while
news clips, entire movies (streamed version) and spiritual videos brought up the rear.
17Television
Media Consumer Survey 2018

Television

Methods of                          including television shows and       in the use of downloaded pro-
Programming Content                 movie, coupled with the increas-     gramming content. Another plau-
                                    ing adoption of media consump-       sible reason is the onset of Smart
RRespondents were gauged on         tion via smartphones and laptops,    TVs, as some Smart TVs come with
how they watched television con-    could account for the adoption       inbuilt USB ports that allow users
tent. Downloaded programming        of downloaded programming.           to connect USB or flash drives to
was the most popular method of      Another plausible reason is the      view content. This could explain
watching content with 39 per-       onset of Smart TVs, as some Smart    the growing trend in the use of
cent respondents admitting to       TVs come with inbuilt USB ports      downloaded programming con-
the use of this method. Internet    that allow users to connect USB or   tent.
access granting users the ability   flash drives to view content. This
to download and watch content       could explain the growing trend

                                                                                                                          19
Media Consumer Survey 2018
Live programming viewership appears to drive viewing content owns the rights to most Europe-
accounted for the second most among the male demographic in an league broadcast agreements
popular method of viewing tele- Nigeria. It appears to drive con- in sub-Saharan Africa, including
vision content with 28 percent of sumption and demand for DStv Nigeria.
respondents. Live programming and GoTV in the country. One
of sporting events particularly of the biggest assets of DStv in DStv is a tested brand in pay TV
football and perhaps boxing, Africa is sports because the brand and commands the lion share
20Media Consumer Survey 2018
of the market, controlling close its entertainment and sports tele- Programming recorded on digital
to 50 per cent of the 23 million vision network Kwese TV in Lagos, video recorder (DVR) brought up
subscribers in the sector. DSTV’s Nigeria on October 19, 2017. The the rear with 7 percent of survey
subscriber base grew by 8 per network offers ‘pay-as-you-watch’ responses. An instance of this is
cent year-on-year from 10.2 subscription packages for premi- the DSTV Explora decoder, which
million to 11 million as at 2017. um programming, which enables offers full Personal Video Recorder
Nigeria accounts for an estimated consumers to purchase from any (PVR) functionality. PVR enables
40 percent of DStv’s market share of three-day, seven-day, and 30- you to record TV shows for later
in Africa. day subscription options. viewing. Multichoice asserts that
their DSTV Explora can record up
The third most popular method Streamed programming was the to 220 hours of content.
was On-demand programming or programming method adopted
pay-per-view (with 16 percent of by 10 percent of respondents. Paid Television Purchase Prefer-
respondents). Pay-per-view (PPV) Again, the internet, in addition ence
is a type of pay television service to the use of mobile phones and
by which a subscriber of a tele- laptops could be accountable for When consumers were engaged
vision service provider can pur- this followed by Smart TVs. on their preferred choice for
chase events to view via private purchasing paid television, 47
telecast. With the emergence of Smart TV is a lot like a computer. percent of respondents wished
the internet, the term internet It enables you to browse the web, to subscribe only to channels
pay-per-view (iPPV) has been used watch YouTube videos, and catch they regularly watched as against
to describe pay-per-view services up on social networking. Some of a prepaid bouquet of channels
accessed online. PPV is most com- the TVs currently support Flash as offered. On the other hand, 43
monly used to distribute combat well, which means a better web percent preferred to subscribe to a
sports events, such as boxing, browsing experience. The price package of channels. The remain-
mixed martial arts, and sports en- of Smart TVs range from as low as ing 10 percent expressed the wish
tertainment such as professional N60,000 to as high as N8 Million to purchase only individual shows
wrestling. depending on the features and and events.
functionality.
Kwesé announced the launch of
21Media Consumer Survey 2018
Paid Television Purchase Preference
When consumers were engaged on their preferred choice for purchasing paid television, 47 percent of respon-
dents wished to subscribe only to channels they regularly watched as against a prepaid bouquet of channels of-
fered. On the other hand, 43 percent preferred to subscribe to a package of channels. The remaining 10 percent
expressed the wish to purchase only individual shows and events.
22Media Consumer Survey 2018
Associated activities while watching TV
Respondents were asked what things they typically did while watching their TV at home. 34 percent of consum-
ers revealed using a social media network and 33 percent said they browsed and surfed the web.
23Media Consumer Survey 2018
Household Ownership of Media or Home Entertainment Equipment
Smartphones, used by 84 percent of the respondents, accounted for the highest number of media entertainment
devices in the household. This was followed by laptops with 76 percent of respondents revealing their house-
holds possessed this device. Flat panel televisions in the household were identified by 65 percent of consumers.
Tablets and desktop computers brought up the rear as a household media or home entertainment equipment
by 38 percent and 26 percent of respondents respectively.
24Media Consumer Survey 2018
Percentage Of Time Spent Watching Tv Shows On The Following Devices
From the chart above, it is evident that the average respondent spends between 0 to 6 hours a day watching TV
shows on any device. 46 percent spend 0 to 3 hours a day watching television shows; 29 percent spend 4 to 6
hours; 13 percent spend 7 to 9 hours; while 8 percent spend 10 to 12 hours a day.
Overall, respondents spent the most hours watching TV shows via the television.
25Social media
Media Consumer Survey 2018

Social Media

Facebook

When asked about the top 3 reasons for using Facebook, respondents cited keeping up with friends and family
as the top reason for using the social media account. Keeping up-to-date on breaking news and entertainment
activities together accounted for the second reason for social media account usage. Connecting with colleagues
was the third reason.

                                                                                                                              27
Media Consumer Survey 2018
Twitter
Keeping up to date on breaking news is the number one reason consumers use Twitter with 55 percent of the re-
sponses. Entertainment value accounts for the second reason why the social media account is used followed by
keeping up with friends and faily.
Connecting with colleagues and building professional networks account for the fourth and fifth reasons respectively.
28Media Consumer Survey 2018
Snapchat
The foremost reasons for Snapchat users of the social media service is for entertainment value followed by keep-
ing up with friends and family and sharing photos and videos as the second and third reasons consecutively
29Media Consumer Survey 2018
LinkedIn
LinkedIn users made use of the social account for building professional networks followed by connecting with col-
leagues while posting resumes and looking for jobs accounted for the third reason.
30Media Consumer Survey 2018
Instagram
Top three reasons for consumers of Instagram include: Entertainment value (65 percent); Sharing photos and
videos (57 percent) and keeping up with friends and family (55 percent).
31Media Consumer Survey 2018 32
Media Consumer Survey 2018

Overall, when taking into con-     followed by entertainment value      work (30 percent); as a distraction
sideration the average usage       (49 percent); connecting with col-   from daily routine when bored (27
of consumers on social media,      leagues (35 percent); share photos   percent) and to post resumes and
respondents access their social    and videos (34 percent); keep        look for jobs (17 percent).
media accounts to keep up with     up to date on breaking news (32
family and friends (53 percent);   percent); build professional net-

                                                                                                                          33
Media Consumer Survey 2018 34
Media Consumer Survey 2018

                             35
Media Consumer Survey 2018 36
Media Consumer Survey 2018

                             37
Media Consumer Survey 2018
Most frequently used mechanism to get news
Most frequently used mechanism to get news for respondents is via social media sites (36 percent) followed by
online newspapers (26 percent) and television news stations (15 percent) as a distant third.
38Media Consumer Survey 2018
Most likely reason to pay confided that they would do so with the brand, 27 percent of
for online news content if the content is unique and they respondents disclosed that they
couldn’t find it from free news would financially subscribe to its
Respondents were also asked sources. Another 31 percent of content. Those who would do so
to supply the most likely reason consumers revealed that where if the point of view of the news
they would pay for online news they could find in-depth news source aligned closely with their
content in cases where they were analysis then they would pay for values brought up the rear with 11
willing to pay and 31 percent it. If they trusted and associated percent of consumers surveyed.
39Media Consumer Survey 2018
Most influential channel for making buying decisions
When asked which of the following channels mostly influences their buying decisions, 38 percent of respondents
revealed that recommendations from a friend/family/known acquaintance was the highest factor for making pur-
chases of products or services. Online review or recommendations from someone within their social media circle
was the second most influential reason for buying decisions with 30 percent of respondents.
40Media Consumer Survey 2018
For online adverts, respondents were asked which of the following mediums had the greatest influence on their
buying decision and more than half of consumers (53 percent) stated clearly that advertising delivered through
social media platforms was the most effective. Sponsored search engine result advertising was a distant second
by 15 percent of respondents.
41Media Consumer Survey 2018
CONCLUSION
Omosomi Omomia
Results of the survey show that consumer tastes and line channels in making purchasing decisions, more
preferences are shifting, especially when it comes to than half of our survey participants stated clearly that
Country’s teeming youth population. More and more advertising delivered through social media platforms
Nigerians are browsing the internet and also viewing was the most effective followed by sponsored search
media and entertainment content through devices engine result advertising.
such as smartphones and laptops, as well as Smart
televisions, which enables consumers to connect to Social media engagement is key for organisations
the internet to view programming content, especially who wish to successfully market their products and
in downloaded formats. services to the millennial generation. The survey
shows that respondents are using various social
Mobile broadband penetration in Nigeria, in addition media accounts for distinct reasons; and Companies
to subscription via internet service providers (ISPs) by or individuals who wish to market strategically should
the working population in major cities such as Lagos, target the social media platform that aligns with their
has revolutionised the way people consume media brand values and objectives. Overall, when taking into
and entertainment services utilising devices other consideration the average usage of consumers on
than the traditional television sets. social media, respondents are using their social media
accounts to keep up with family and friends; followed
Furthermore, when it comes to the influence of on- by for entertainment activities.
42Media Consumer Survey 2018
Results of the survey also show that more and more ever before, particularly via social media platforms
people are viewing news content via social media and search engines. Nigeria’s venture into the dig-
sites and online. Plus, television shows are the most ital age is driven by deepened mobile penetration
watched video content followed by Movies (down- and the country’s growing and digitally savvy youth
loaded) and funny videos. demography.
The world is in the digital age. As a result, information
is disseminated and distributed more rapidly than
43Media Consumer Survey 2018
Author:
Omosomi Omomia
Assistant Research Editor
BRIU
08094821958
omosomi.omomia@businessdayonline.com
www.businessdayonline.com
45You can also read