Perceived Immune Fitness, Individual Strength and Hangover Severity - MDPI
←
→
Page content transcription
If your browser does not render page correctly, please read the page content below
International Journal of
           Environmental Research
           and Public Health

Article
Perceived Immune Fitness, Individual Strength and
Hangover Severity
Aurora J. A. E. van de Loo 1,2 , Nikki Kerssemakers 2 , Andrew Scholey 3 , Johan Garssen 2,4 ,
Aletta D. Kraneveld 2 and Joris C. Verster 1,2,3, *
 1    Institute for Risk Assessment Sciences (IRAS), Utrecht University, 3584CM Utrecht, The Netherlands;
      a.j.a.e.vandeloo@uu.nl
 2    Division of Pharmacology, Utrecht Institute for Pharmaceutical Sciences (UIPS), Utrecht University,
      3584CG Utrecht, The Netherlands; n.kerssemakers@students.uu.nl (N.K.); j.garssen@uu.nl (J.G.);
      a.d.kraneveld@uu.nl (A.D.K.)
 3    Centre for Human Psychopharmacology, Swinburne University, Melbourne, VIC 3122, Australia;
      andrew@scholeylab.com
 4    Nutricia Research, 3584CT Utrecht, The Netherlands
 *    Correspondence: j.c.verster@uu.nl; Tel.: +31-30-253-6909

 Received: 20 April 2020; Accepted: 3 June 2020; Published: 5 June 2020

 Abstract: Various factors may contribute to alcohol hangover severity. The purpose of the current
 investigation was to evaluate the possible impact of alcohol consumption patterns, perceived immune
 status, and baseline fatigue on hangover severity. A survey was completed by a convenience sample
 of N = 199 Dutch students who reported on their latest past month’s heavy drinking occasion,
 including subjective intoxication (perceived drunkenness) and next-day hangover severity, which
 were rated on single-item scales ranging from 0 (absent) to 10 (extreme). In addition, perceived
 (momentary) immune fitness was assessed, and the Checklist Individual Strength (CIS) was completed
 to assess baseline fatigue. The analysis revealed that instead of the amount of alcohol consumed
 or estimated blood alcohol concentration, it appeared that subjective intoxication (i.e., level of
 drunkenness) was the most important determinant of alcohol hangover severity. Especially in men,
 albeit modest, it was perceived that immune fitness also significantly contributed to the level of
 hangover severity experienced.

 Keywords: alcohol; hangover; immune fitness; fatigue; predictors

1. Introduction
     The alcohol hangover is the most commonly reported negative consequence of increased alcohol
consumption [1] and has been defined as ‘the combination of negative mental and physical symptoms
which may be experienced the day after a single episode of alcohol consumption, starting when
blood alcohol concentration (BAC) approaches zero’ [2,3]. The hangover is often accompanied by
impairments of cognitive and psychomotor performance [4–6] and mood changes [7], which may
negatively impact daily activities such as driving [8,9] or work performance [10].
     Previous research focused on various factors that may predict hangover severity. For example,
both state and trait mood appeared to have a limited impact on hangover severity [11]. Other studies
found that consuming alcoholic beverages with high levels of congeners (i.e., substances other than
ethanol, produced during fermentation)—may aggravate hangover severity [12]. More commonly,
research investigated the possible impact of alcohol consumption variables (i.e., quantity, frequency
measures) in relation to hangover severity. Such studies revealed that the amount of alcohol consumed
or estimated BAC was not the most important predictors of hangover severity. Rather, subjective

Int. J. Environ. Res. Public Health 2020, 17, 4039; doi:10.3390/ijerph17114039     www.mdpi.com/journal/ijerph
Int. J. Environ. Res. Public Health 2020, 17, 4039 2 of 8
intoxication, i.e., the level of reported drunkenness, was showns to be a more important predictor of
hangover severity [11–14].
Several review papers have suggested various physiological and subjective factors that contribute
to the pathology of alcohol hangovers [15–18]. Over the past 10 years, there has been a growing
consensus that the alcohol hangover may be provoked by an inflammatory response elicited by alcohol
intake [19,20].
Immune fitness can be defined as the capacity of the body to respond to health challenges (such
as infections and/or fever) by activating an appropriate immune response in order to promote health
and prevent and resolve disease, which is essential for improving quality of life. Perceived immune
fitness is the individual subjective judgment of this capability. It has been shown that the past year’s
immune status is related to the susceptibility to hangovers [21]. Van de Loo et al. reported that across
all estimated BAC levels, subjects who reported having hangovers regularly had a significantly poorer
past year’s immune status compared to drinkers that claimed to be hangover resistant. However,
in a subsequent study, van de Loo et al. [22] observed that momentary (real-time) perceived immune
fitness did not correlate significantly with overall hangover severity, after controlling for estimated
BAC. Another recent study also revealed that mental and physical fitness were not significantly
contributing to the regression analysis that aimed to predict hangover severity [14,23]. Instead,
subjective intoxication was again the strongest determinant factor of hangover severity.
Physical fitness and exercise may strengthen immune fitness [24]. However, the number of studies
investigating whether baseline levels of mental resilience or physical activity levels are predictive
of hangover severity is limited. Physical activity levels have been shown to be reduced during the
hangover state [25]. However, the limited number of studies that have examined physical performance
revealed no significant differences between assessments made on hangover days and alcohol-free
control days [24–28].
The current survey was conducted among a sample of Dutch students to further investigate the
relationship between hangover severity and perceived immune fitness (state), alcohol consumption,
and physical strength.
2. Materials and Methods
In September 2019, a survey was conducted among a convenience sample of N = 199 Dutch
students (n = 54 men and n = 145 women). They were recruited at Utrecht Science Park by the
investigator. Subjects were included if they were between 18 and 25 years old. There were no exclusion
criteria, but subjects had to consume alcohol to participate in the survey. When inviting subjects to
participate, they were first asked whether or not they consume alcohol. If they answered yes, they were
asked to complete the survey. Although a minority, no formal recordings were kept of subjects who
did not consume alcohol or who refused to participate. Subjects completed the paper-pencil survey
in the presence of the investigator (N.K.), at the place of recruitment (university canteens or student
study facilities). Participation was anonymous, and they received no financial reward for participation.
The Ethics Committee of the Faculty of Social and Behavioral Sciences of Utrecht University granted
ethical approval (approval code FETC17-061), and informed consent was obtained.
As part of the survey, demographics were recorded, including age, sex, height, and weight.
Body mass index (BMI, kg/m2 ) was calculated using this information. Alcohol consumption was
recorded using questions taken from the Quick Drinking Screen [29,30], including information on their
usual alcohol intake on a drinking occasion and consumption variables concerning their past month’s
heaviest drinking occasion. These included questions about the amount of alcohol consumed and the
drinking time. The survey contained guidance about standard drinking sizes and how to convert,
for example, bottles of wine into standardized alcohol units, containing 10 g of ethanol each in The
Netherlands. Together, with information on sex and body weight and using an updated Widmark
equation [31], this allowed to calculate estimated BAC. Subjective intoxication was rated on a single
item scale, ranging from 0 (sober) to 10 (very drunk) [32,33]. Hangover severity was rated on a singleInt. J. Environ. Res. Public Health 2020, 17, 4039 3 of 8
item scale, ranging from 0 (absent) to 10 (extreme) [34]. A single item scale that provides an overall
rating for hangover severity was chosen as it better reflects the overall hangover experience than scores
of scales that aggregate a limited number of hangover symptoms [34].
Current perceived immune fitness was assessed using a 1-item scale ranging from 0 (very poor)
to 10 (excellent) [35,36]. The Dutch version of the Checklist Individual Strength (CIS) [37,38] was
completed to evaluate past month’s subjective fatigue and related constructs. The scale consists of
20-item that can be scored on 7-point Likert scales with the anchors ‘yes, true’ (1) and ‘no, not true’ (7).
A sum score can be computed (with some items having reversed scoring) and four subscales, assessing
‘fatigue,’ ‘concentration,’ ‘motivation,’ and ‘physical activity.’ Higher scores suggest more subjective
fatigue and more concentration problems, and less motivation and less physical activity. A fatigue
score > 27 suggests abnormal fatigue and a score > 37 indicates severe fatigue [39].
Statistical analyses were conducted with SPSS (IBM Corp. Released 2013. IBM SPSS Statistics
for Windows, Version 25.0. IBM Corp: Armonk, NY, USA). Mean and standard deviation (SD) were
computed for each variable. Depending on whether the data had a normal distribution, paired t-tests
or Independent Samples Mann–Whitney U tests were used to compare men and women.
Partial correlations, corrected for estimated BAC, were computed to evaluate associations between
study outcomes and hangover severity. The results of the analyses were considered statistically
significant if p < 0.05. A linear stepwise regression analysis was conducted to determine which of
the variables assessed in this survey was a significant predictor of hangover severity. The regression
analysis was conducted for the sample as a whole, and for men and women separately.
3. Results
N = 199 participants completed the survey. Their demographics, drinking variables, and other
study outcomes are summarized in Tables 1 and 2.
Table 1. Demographics and study outcomes.
Overall Men Women p-Value
Perceived immune fitness 7.2 (1.7) 7.7 (1.7) 7.0 (1.6) 0.005 *
Demographics
N 199 54 145
Age 19.6 (1.7) 20.7 (1.9) 19.2 (1.5) 0.000 *
BMI (kg/m2 ) 21.9 (3.4) 23.0 (5.0) 21.5 (2.4) 0.021 *
Alcohol per week (units) 10.6 (14.4) 18.5 (19.7) 7.7 (10.6) 0.000 *
Checklist Individual Strength
Overall 69.2 (16.7) 67.9 (16.2) 69.2 (16.7) 0.561
Fatigue 29.6 (8.6) 27.8 (8.7) 30.2 (8.5) 0.105
Concentration 18.3 (5.7) 18.4 (5.6) 18.3 (5.7) 0.821
Motivation 11.4 (3.8) 11.4 (3.9) 11.4 (3.8) 0.955
Physical activity 9.6 (3.5) 10.0 (3.3) 9.5 (3.5) 0.217
Mean and SD (between brackets) are shown. Significant differences between men and women (p < 0.05) are indicated
by *. Abbreviations: BMI = body mass index.
Table 2. Past month heaviest drinking occasion.
Overall Men Women p-Value
Number of alcoholic drinks (units) 12.3 (9.4) 18.5 (10.6) 10.1 (7.9) 0.000 *
Drinking time (h) 5.2 (3.5) 6.5 (3.5) 4.7 (3.3) 0.001 *
Estimated BAC (%) 0.22 (0.18) 0.25 (0.17) 0.20 (0.18) 0.023 *
Subjective intoxication 6.0 (3.6) 7.4 (3.2) 5.5 (3.6) 0.000 *
Overall hangover severity 4.0 (3.5) 5.5 (3.5) 3.5 (3.4) 0.000 *
Mean and SD (between brackets) are shown. Significant differences between men and women (p < 0.05) are indicated
by *. Abbreviations: BAC = blood alcohol concentration.Int.J.J.Environ.
Int. Environ. Res.
Res. Public
Public Health
Health 2020,
2020, 17,
17, 4039
x 44of
of88
Table 2. Past month heaviest drinking occasion.
Significant sex differences were observed in drinking behavior. As expected, men consumed more
Overall Men Women p-Value
alcohol than women and reached a higher estimated BAC. From the average estimated BAC (0.22%),
Number of alcoholic drinks (units) 12.3 (9.4) 18.5 (10.6) 10.1 (7.9) 0.000 *
it is evident that this was a relatively heavy drinking sample. No sex differences were found on the
Drinking time (h) 5.2 (3.5) 6.5 (3.5) 4.7 (3.3) 0.001 *
CIS assessments of individual strength.
Estimated BAC (%) 0.22 (0.18) 0.25 (0.17) 0.20 (0.18) 0.023 *
Partial correlations, correcting for estimated
Subjective intoxication 6.0BAC,
(3.6) revealed no significant
7.4 (3.2) 5.5 (3.6) associations
0.000 * between
hangover severityOverall
and perceived
hangoverimmune
severity fitness,4.0
nor(3.5)
with any
5.5outcome
(3.5) of
3.5the CIS. In
(3.4) contrast,
0.000 * a strong
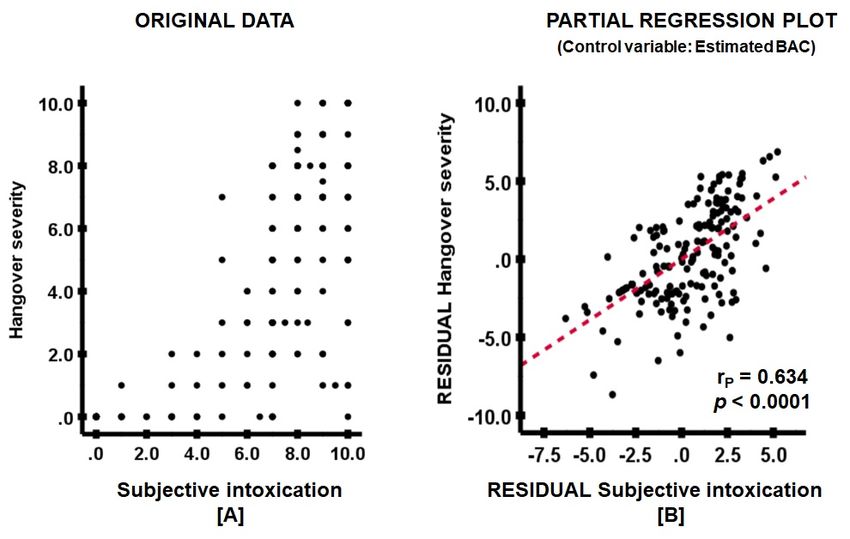
positive partial correlation was observed between hangover severity and subjective
Mean and SD (between brackets) are shown. Significant differences between men and women (p < intoxication
(Figure 1).are indicated by *. Abbreviations: BAC = blood alcohol concentration.
0.05)
Figure 1. The association between subjective intoxication and overall hangover severity. A partial
Figure 1. The
correlation (rp ) association
was computed between subjective
between hangoverintoxication
severity andand overall
ethanol hangoverrate.
elimination severity. A partial
(A) shows the
correlation (rp) was computed between hangover severity and ethanol elimination rate. (A) shows the
original data, (B) the partial regression plot. The red line represents the partial correlation. Abbreviation:
original
BAC data,alcohol
= blood (B) the partial regression plot. The red line represents the partial correlation.
concentration.
Abbreviation: BAC = blood alcohol concentration.
A stepwise regression analysis revealed that the amount of alcohol consumed and estimated
A stepwise
BAC were regression
no relevant analysis
predictors revealed
of overall that the
hangover amountInstead,
severity. of alcohol consumed
a model and estimated
that explained 54.3%
BAC
of were no
variance relevant
was predictors
obtained, of overall hangover
with subjective intoxicationseverity.
as theInstead, a model that
most important explainedfactor
contributing 54.3%
of variance was obtained, with subjective intoxication as the most important contributing
to hangover severity (50.9%), followed by significant but less strong contributions of the variables, factor to
hangover
age (1.6%),severity
perceived (50.9%),
immune followed
fitness by significant
(1.0%), but less
and fatigue strong contributions of the variables, age
(0.8%).
(1.6%), perceived immune fitness (1.0%), and fatigue (0.8%).
When conducting the regression analysis for men only, a model was obtained explaining 45.1% of
When
variance conducting
in overall the regression
hangover analysis
severity, with for men
subjective only, a model
intoxication was
as the obtained
most explaining
important 45.1%
contributing
of variance
variable in overall
(40.0%), followed hangover severity,
by perceived immunewith fitness
subjective
(5.1%).intoxication as the most
When conducting important
the regression
contributing variable (40.0%), followed by perceived immune fitness (5.1%).
analysis for women only, a model was obtained explaining 51.5% of variance in overall hangover When conducting the
regression
severity, withanalysis for women
subjective only,asa the
intoxication model was
single obtained explaining
contributing variable. 51.5% of variance in overall
hangover severity, with subjective intoxication as the single contributing variable.
4. Discussion
4. Discussion
In line with previous research, the amount of alcohol consumed and estimated BAC did not
In line
contribute with
to the previous
models research,
predicting the amount
hangover severity.ofHowever,
alcohol consumed
the analyses and estimated
confirmed BAC did
previous not
studies
contribute to the models predicting hangover severity. However, the analyses confirmed previous
that showed that subjective intoxication is a very strong predictor of hangover severity [11–14,40,41].
studies
At thatlevel,
a group showed
therethat
is asubjective intoxication
high correlation betweenis athe
very strongofpredictor
amount of hangover
alcohol consumed andseverity [11–
subjective
14,40,41]. At a group level, there is a high correlation between the amount of alcohol consumed andInt. J. Environ. Res. Public Health 2020, 17, 4039 5 of 8
intoxication [32]. However, individual drinkers vary considerably in the level of subjective intoxication
when consuming the same amount of alcohol. This may explain why the amount of alcohol consumed
predicts subjective intoxication, but not hangover severity. The effect of alcohol consumption, i.e.,
the levels of subjective intoxication, is significantly related to hangover severity.
Perceived immune fitness had a modest contribution to overall hangover severity, which was
most pronounced in men (5.1%). In contrast, women’s perceived immune fitness did not significantly
contribute to the model explaining hangover severity. The relationship between susceptibility to
hangovers and immune fitness was reported previously [20]. However, in contrast to previous
findings [21], the current data also suggest a significant relationship between perceived immune fitness
and hangover severity. We have no clear explanation for the observed sex difference. Sex differences in
hangover symptom severity, albeit modest after correcting for drinking volume, have been reported
previously [42]. However, immune function and susceptibility to immune-related diseases differ
between men and women [43,44], which may have been reflected in a differential perception of the
immune fitness of men and women in the current study. More research into sex differences in perceived
immune fitness is warranted to further elucidate possible sex differences.
In contrast to our hypothesis, baseline fatigue levels did not relevantly contribute to hangover
severity (0.8%). Interestingly, the sample scored relatively high on the CIS fatigue scale. The group
average of 29.6 was higher than the cut-off score 27, indicating abnormal fatigue in the general
population [39]. The lifestyle of students, including irregular sleep and sleep deprivation, may account
for this. Indeed, research revealed that about 70% of students attain insufficient sleep [45]. Previous
research has shown that sleep duration and quality after consuming alcohol could significantly impact
next-day hangover severity [26,46–49]. Sleep was, however, not assessed in the current study. Future
studies should also investigate the specific relationship between subjective intoxication and subsequent
sleep duration and quality, and infer whether fatigue while drinking has a relevant impact on next-day
hangover severity.
Strengths of the study include that previous observation was confirmed in a high-level drinking
sample, and that potential sex differences were evaluated. However, the survey collected data
retrospectively, and as such, recall bias may have affected the data. Another limitation was the fact that
only a relatively small convenience sample consisting of young students was investigated. Further
research in larger samples should investigate how these observations translate to other age groups with
differential alcohol consumption levels. Moreover, the state immune status was not assessed. Future
studies should investigate this, for example, by implementing the Immune Status Questionnaire [35]
in addition to the momentary assessments of immune fitness. Finally, the current observations rely
entirely on self-report. In future studies, the assessments of perceived immune fitness should be
compared to the presence of objective biomarkers of immune functioning (e.g., cytokines) to evaluate
to what extent perceived immune fitness adequately reflects objectively assessed immune functioning.
5. Conclusions
This study confirms that instead of the amount of alcohol consumed, subjective intoxication is the
most important determinant of alcohol hangover severity. The data suggest that immune fitness, albeit
modest, also contributes to the experienced level of hangover severity. Future studies in larger samples
should further investigate the role of the immune system in the pathology of the alcohol hangover.
Author Contributions: Conceptualization, A.J.A.E.v.d.L., A.S., A.D.K., J.G. and J.C.V.; methodology, N.K. and
J.C.V.; formal analysis, J.C.V.; investigation, N.K.; writing—original draft preparation, J.C.V.; writing—review
and editing, A.J.A.E.v.d.L., A.S., A.D.K., J.G., N.K., and J.C.V. All authors have read and agreed to the published
version of the manuscript.
Funding: This research received no external funding.
Conflicts of Interest: Over the past 36 months, A.D.K. has held research grants from H2020, Nutricia-Danone,
Netherlands Center of Translational Research, Lungfund, SGF/Health Holland and NWO. J.G. is part-time
employee of Nutricia Research. Over the past 36 months, J.G. has held research grants from several profit and
non-profit organizastions, including EU, NWO, Health Holland, TIFN, and acted as a consultant/expert advisorInt. J. Environ. Res. Public Health 2020, 17, 4039 6 of 8
to Nutricia research Foundation, Friesland Campina, Carbohydrate Competitive Center, International Olympic
Committee, Bill Gates Foundation, ID-DLO (WUR). Over the past 36 months, A.S. has held research grants
from Abbott Nutrition, Arla Foods, Bayer, BioRevive, DuPont, Kemin Foods, Nestlé, Nutricia-Danone, Verdure
Sciences. He has acted as a consultant/expert advisor to Bayer, Danone, Naturex, Nestlé, Pfizer, Sanofi, Sen-Jam
Pharmaceutical, and has received travel/hospitality/speaker fees Bayer, Sanofi and Verdure Sciences. Over the past
36 months, J.C.V. received research grants from Janssen, Nutricia, and Sequential, and acted as a consultant/expert
advisor to Clinilabs, More Labs, Red Bull, Sen-Jam Pharmaceutical, Toast!, and ZBiotics. A.J.A.E.v.d.L. and N.K.
declare no conflicts of interest.
References
1. Verster, J.C.; Van Herwijnen, J.; Olivier, B.; Kahler, C.W. Validation of the Dutch version of the brief young
adult alcohol consequences questionnaire (B-YAACQ). Addict. Behav. 2009, 34, 411–414. [CrossRef]
2. Van Schrojenstein Lantman, M.; Van De Loo, A.J.A.E.; Mackus, M.; Verster, J. Development of a Definition
for the Alcohol Hangover: Consumer Descriptions and Expert Consensus. Curr. Drug Abus. Rev. 2017, 9,
148–154. [CrossRef] [PubMed]
3. Verster, J.C.; Scholey, A.; Van De Loo, A.J.A.E.; Benson, S.; Stock, A.-K. Updating the Definition of the Alcohol
Hangover. J. Clin. Med. 2020, 9, 823. [CrossRef] [PubMed]
4. Kruisselbrink, L.D. The neurocognitive effects of alcohol hangover: Patterns of impairment/nonimpairment
within the neurocognitive domains of the Diagnostic and Statistical Manual of Mental Disorders.
In Neuroscience of Alcohol: Mechanisms and Treatment, 5th ed.; Preedy, V.R., Ed.; Elsevier: London, UK,
2019; pp. 391–402.
5. Ling, J.; Stephens, R.; Heffernan, T.M. Cognitive and psychomotor performance during alcohol hangover.
Curr. Drug Abus. Rev. 2010, 3, 80–87. [CrossRef] [PubMed]
6. Gunn, C.; Mackus, M.; Griffin, C.; Munafò, M.R.; Adams, S. A systematic review of the next-day effects of
heavy alcohol consumption on cognitive performance. Addiction 2018, 113, 2182–2193. [CrossRef] [PubMed]
7. McKinney, A. A review of the next day effects of alcohol on subjective mood ratings. Curr. Drug Abus. Rev.
2010, 3, 88–91. [CrossRef]
8. Verster, J.C.; Bervoets, A.C.; De Klerk, S.; Vreman, R.A.; Olivier, B.; Roth, T.; Brookhuis, K.A. Effects of alcohol
hangover on simulated highway driving performance. Psychopharmacology 2014, 231, 2999–3008. [CrossRef]
9. Alford, C.; Broom, C.; Carver, H.; Johnson, S.J.; Lands, S.; Reece, R.; Verster, J.C. The Impact of Alcohol
Hangover on Simulated Driving Performance during a ‘Commute to Work’—Zero and Residual Alcohol
Effects Compared. J. Clin. Med. 2020, 9, 1435. [CrossRef]
10. Frone, M.R. Employee Psychoactive Substance Involvement: Historical Context, Key Findings, and Future
Directions. Ann. Rev. Organ. Psychol. Organ. Behav. 2019, 6, 273–297. [CrossRef]
11. Verster, J.C.; Arnoldy, L.; van de Loo, A.J.A.E.; Benson, S.; Scholey, A.; Stock, A.-K. The impact of mood and
subjective intoxication on hangover severity. 2020, submitted.
12. Rohsenow, D.J.; Howland, J. The role of beverage congeners in hangover and other residual effects of alcohol
intoxication: A review. Curr. Drug Abus. Rev. 2010, 3, 76–79. [CrossRef]
13. Köchling, J.; Geis, B.; Wirth, S.; Hensel, K.O. Grape or grain but never the twain? A randomized controlled
multiarm matched-triplet crossover trial of beer and wine. Am. J. Clin. Nutr. 2019, 109, 345–352. [CrossRef]
[PubMed]
14. Verster, J.C.; Kruisselbrink, L.; Slot, K.; Anogeianaki, A.; Adams, S.; Alford, C.; Arnoldy, L.; Ayre, E.; Balikji, S.;
Benson, S.; et al. Sensitivity to Experiencing Alcohol Hangovers: Reconsideration of the 0.11% Blood Alcohol
Concentration (BAC) Threshold for Having a Hangover. J. Clin. Med. 2020, 9, 179. [CrossRef] [PubMed]
15. Prat, G.; Adan, A.; Sánchez-Turet, M. Alcohol hangover: A critical review of explanatory factors.
Hum. Psychopharmacol. Clin. Exp. 2009, 24, 259–267. [CrossRef] [PubMed]
16. Penning, R.; Van Nuland, M.; Fliervoet, L.A.; Olivier, B.; Verster, J.C. The pathology of alcohol hangover.
Curr. Drug Abus. Rev. 2010, 3, 68–75. [CrossRef]
17. Tipple, C.; Scholey, A.; Benson, S. A Review of the Physiological Factors Associated with Alcohol Hangover.
Curr. Drug Abus. Rev. 2017, 10, 1. [CrossRef]
18. Palmer, E.; Tyacke, R.; Sastre, M.; Lingford-Hughes, A.; Nutt, D.; Ward, R.J. Alcohol Hangover: Underlying
Biochemical, Inflammatory and Neurochemical Mechanisms. Alcohol Alcohol. 2019, 54, 196–203. [CrossRef]
19. Kim, D.-J.; Kim, W.; Yoon, S.-J.; Choi, B.-M.; Kim, J.-S.; Go, H.J.; Kim, Y.-K.; Jeong, J. Effects of alcohol
hangover on cytokine production in healthy subjects. Alcohol 2003, 31, 167–170. [CrossRef]Int. J. Environ. Res. Public Health 2020, 17, 4039 7 of 8
20. Van de Loo, A.J.A.E.; Knipping, K.; Mackus, M.; Kraneveld, A.D.; Garssen, J.; Scholey, A.; Bruce, G.;
Verster, J.C. Differential effects on acute saliva cytokine response following alcohol consumption and alcohol
hangover: Preliminary results from two independent studies. Alcohol. Clin. Exp. Res. 2018, 142 (Suppl. S2),
20A.
21. Van De Loo, A.J.A.E.; Mackus, M.; Van Schrojenstein Lantman, M.; Kraneveld, A.D.; Brookhuis, K.A.;
Garssen, J.; Scholey, A.; Verster, J.C. Susceptibility to Alcohol Hangovers: The Association with Self-Reported
Immune Status. Int. J. Environ. Res. Public Heal. 2018, 15, 1286. [CrossRef]
22. Van De Loo, A.J.A.E.; Van Schrojenstein Lantman, M.; Mackus, M.; Scholey, A.; Verster, J.C. Impact of mental
resilience and perceived immune functioning on the severity of alcohol hangover. BMC Res. Notes 2018, 11,
526. [CrossRef] [PubMed]
23. Verster, J.C.; Anogeianaki, A.; Kruisselbrink, L.; Alford, C.; Stock, A.-K. Relationship between Alcohol
Hangover and Physical Endurance Performance: Walking the Samaria Gorge. J. Clin. Med. 2019, 9, 114.
[CrossRef] [PubMed]
24. Kruisselbrink, L.D.; Martin, K.L.; Megeney, M.; Fowles, J.R.; Murphy, R.J. Physical and psychomotor
functioning of females the morning after consuming low to moderate quantities of beer. J. Stud. Alcohol 2006,
67, 416–420. [CrossRef]
25. Codella, R.; Luzi, L.; Terruzzi, I. Exercise has the guts: How physical activity may positively modulate gut
microbiota in chronic and immune-based diseases. Dig. Liver Dis. 2018, 50, 331–341. [CrossRef]
26. Devenney, L.E.; Coyle, K.B.; Roth, T.; Verster, J.C. Sleep after Heavy Alcohol Consumption and Physical
Activity Levels during Alcohol Hangover. J. Clin. Med. 2019, 8, 752. [CrossRef]
27. Nelson, D.O. Effects of Ethyl Alcohol on the Performance of Selected Gross Motor Tests. Res. Q. Am. Assoc.
Health Phys. Educ. Recreat. 1959, 30, 312–320. [CrossRef]
28. Karvinen, E.; Miettinen, M.; Ahlman, K. Physical Performance during Hangover. Q. J. Stud. Alcohol 1962, 23,
208–215. [CrossRef]
29. Sobell, L.C.; Agrawal, S.; Sobell, M.B.; Leo, G.I.; Young, L.J.; Cunningham, J.A.; Simco, E.R. Comparison of a
quick drinking screen with the timeline followback for individuals with alcohol problems. J. Stud. Alcohol
2003, 64, 858–861. [CrossRef]
30. Roy, M.; Dum, M.; Sobell, L.C.; Sobell, M.B.; Simco, E.R.; Manor, H.; Palmerio, R. Comparison of the Quick
Drinking Screen and the Alcohol Timeline Followback with Outpatient Alcohol Abusers*. Subst. Use Misuse
2008, 43, 2116–2123. [CrossRef]
31. Watson, P.E.; Watson, I.D.; Batt, R.D. Prediction of blood alcohol concentrations in human subjects. Updating
the Widmark Equation. J. Stud. Alcohol 1981, 42, 547–556. [CrossRef]
32. Verster, J.C.; Benjaminsen, J.M.E.; Van Lanen, J.H.M.; Van Stavel, N.M.D.; Olivier, B. Effects of mixing
alcohol with energy drink on objective and subjective intoxication: Results from a Dutch on-premise study.
Psychopharmacology 2014, 232, 835–842. [CrossRef] [PubMed]
33. Van De Loo, A.J.A.E.; Van Andel, N.; Van Gelder, C.A.G.H.; Janssen, B.S.G.; Titulaer, J.; Jansen, J.; Verster, J.C.
The effects of alcohol mixed with energy drink (AMED) on subjective intoxication and alertness: Results
from a double-blind placebo-controlled clinical trial. Hum. Psychopharmacol. Clin. Exp. 2016, 31, 200–205.
[CrossRef] [PubMed]
34. Verster, J.C.; Van De Loo, A.J.A.E.; Benson, S.; Scholey, A.; Stock, A.-K. The Assessment of Overall Hangover
Severity. J. Clin. Med. 2020, 9, 786. [CrossRef] [PubMed]
35. Wilod Versprille, L.J.F.; Van De Loo, A.J.A.E.; Mackus, M.; Arnoldy, L.; Sulzer, T.A.L.; Vermeulen, S.;
Abdulahad, S.; Huls, H.; Baars, T.; Scholey, A.; et al. Development and Validation of the Immune Status
Questionnaire (ISQ). Int. J. Environ. Res. Public Health 2019, 16, 4743. [CrossRef] [PubMed]
36. Van Schrojenstein Lantman, M.; Mackus, M.; Otten, L.S.; De Kruijff, D.; Van De Loo, A.J.A.E.; Kraneveld, A.D.;
Garssen, J.; Verster, J.C. Mental resilience, perceived immune functioning, and health. J. Multidiscip. Healthc.
2017, 10, 107–112. [CrossRef]
37. Vercoulen, J.H.; Swanink, C.M.; Fennis, J.F.; Galama, J.M.; Van Der Meer, J.W.; Bleijenberg, G. Dimensional
assessment of chronic fatigue syndrome. J. Psychosom. Res. 1994, 38, 383–392. [CrossRef]
38. Vercoulen, J.H.M.M.; Alberts, M.; Bleijenberg, G. De Checklist Individual Strength (CIS). Gedragstherapie
1999, 32, 131–136.Int. J. Environ. Res. Public Health 2020, 17, 4039 8 of 8
39. Worm-Smeitink, M.; Gielissen, M.; Bloot, L.; Van Laarhoven, H.; Van Engelen, B.; Van Riel, P.; Bleijenberg, G.;
Nikolaus, S.; Knoop, H. The assessment of fatigue: Psychometric qualities and norms for the Checklist
individual strength. J. Psychosom. Res. 2017, 98, 40–46. [CrossRef]
40. Rohsenow, D.J.; Howland, J.; Winter, M.; Bliss, C.A.; Littlefield, C.A.; Heeren, T.; Calise, T.V. Hangover
sensitivity after controlled alcohol administration as predictor of post-college drinking. J. Abnorm. Psychol.
2011, 121, 270–275. [CrossRef]
41. Vatsalya, V.; Stangl, B.L.; Schmidt, V.Y.; Ramchandani, V.A. Characterization of hangover following
intravenous alcohol exposure in social drinkers: Methodological and clinical implications. Addict. Boil. 2016,
23, 493–502. [CrossRef]
42. Van Lawick van Pabst, A.E.; Devenney, L.E.; Verster, J.C. Sex differences in the presence and severity of
alcohol hangover symptoms. J. Clin. Med. 2019, 8, 1308; Correction in 2019, 8, 867. [CrossRef] [PubMed]
43. Beagley, K.; Gockel, C.M. Regulation of innate and adaptive immunity by the female sex hormones oestradiol
and progesterone. FEMS Immunol. Med. Microbiol. 2003, 38, 13–22. [CrossRef]
44. Lockshin, M.D. Sex differences in autoimmune disease. Lupus 2006, 15, 753–756. [CrossRef] [PubMed]
45. Hershner, S.D.; Chervin, R.D. Causes and consequences of sleepiness among college students. Nat. Sci. Sleep
2014, 6, 73–84. [CrossRef] [PubMed]
46. Rohsenow, D.J.; Howland, J.; Minsky, S.J.; Arnedt, J.T. Effects of heavy drinking by maritime academy cadets
on hangover, perceived sleep, and next-day ship power plant operation. J. Stud. Alcohol 2006, 67, 406–415.
[CrossRef] [PubMed]
47. Rohsenow, D.J.; Howland, J.; Arnedt, J.T.; Almeida, A.B.; Greece, J.; Minsky, S.; Kempler, C.S.; Sales, S.
Intoxication With Bourbon Versus Vodka: Effects on Hangover, Sleep, and Next-Day Neurocognitive
Performance in Young Adults. Alcohol. Clin. Exp. Res. 2010, 34, 509–518. [CrossRef] [PubMed]
48. Van Schrojenstein Lantman, M.; Mackus, M.; Roth, T.; Verster, J.C. Total sleep time, alcohol consumption,
and the duration and severity of alcohol hangover. Nat. Sci. Sleep 2017, 9, 181–186. [CrossRef] [PubMed]
49. Van Schrojenstein Lantman, M.; Roth, T.; Roehrs, T.; Verster, J.C. Alcohol Hangover, Sleep Quality, and
Daytime Sleepiness. Sleep Vigil. 2017, 1, 37–41. [CrossRef]
© 2020 by the authors. Licensee MDPI, Basel, Switzerland. This article is an open access
article distributed under the terms and conditions of the Creative Commons Attribution
(CC BY) license (http://creativecommons.org/licenses/by/4.0/).You can also read