An analytical study of Andhra Pradesh assembly past poll data to predict the outcome of current polls-2019
←
→
Page content transcription
If your browser does not render page correctly, please read the page content below
Venkatapuram Mahidhar; Reddy International Journal of Advance Research, Ideas and Innovations in Technology

                                                    ISSN: 2454-132X
                                                   Impact factor: 4.295
                                                    (Volume 5, Issue 3)
                                            Available online at: www.ijariit.com

An analytical study of Andhra Pradesh assembly past poll data to
           predict the outcome of current polls-2019
                                                Mahidhar Reddy Venkatapuram
                                                   mahiesweb@gmail.com

                                                          ABSTRACT
This study, by analyzing the poll scenario and poll data of the past general elections conducted for the assembly of the state of
Andhra Pradesh from the date of its formation, aims at a) predicting outcome of present general elections-2019. b) Predicting
a number of seats to be won by major parties. A retrospective comparative study was designed on the data pertaining to seat
share and vote share of major political parties in all the previously conducted general assembly elections (till 2014) and it was
analyzed using linear charts. Three possible outcomes, in the order of probability, were obtained. Poll prediction can be done
when past data is analyzed in a methodical way. Of course, the validity of prediction awaits the decision of time, as these
predictions are done ahead of polling-2019.

Keywords— Andhra Pradesh, Assembly, Polls, Prediction 2019
1. INTRODUCTION
Poll predictions are a trend in the current scenario chiefly due to eagerness of the public and due to large scale bets in gambling.
To cash in on this, television, digital and print media run helter-skelter giving more space to poll predictions. The scenario in the
state of Andhra Pradesh is no different infect a bit more, owing to plenty of political party sponsored news channels which have
taken sides.

The first ever general elections to the Andhra Pradesh assembly were conducted in 1955 and the very recent one stands 14th which
was conducted in 2014.from the formation of AP in 1953, the political picture was dominated solely by Congress (INC) for 3
decades. In 1983 by the thumping victory of Telugu Desam Party (TDP) founded by yesteryears movie star and a demigod in
those days, NTR, the fight has become two sided from then. Both the parties experienced political turmoil’s, the former in the
form of Indira congress split-reunion and ysr’s sudden death and the latter in the form of leadership change. Several newer parties
tried to compete like popular star Chiranjeevis Prajarajyam Party, Loksatta, communist parties etc. but none could topple the top
two parties. Cpi/Cpm restricted themselves playing second Fidel.

There was never a hung assembly in the history of Andhra Pradesh. Another significant socio-political change was the division of
Andhra Pradesh in 2014 just ahead of the elections into two states-AP and Telangana.

2. MATERIALS AND METHODS
We conducted a retrospective cross sectional study. Main theme of present study is to compare the charts which were drawn on a
linear scale comparing percentage of seat share and vote share of major political parties starting from first general assembly
elections of 1955 to 14th general assembly elections of 20141. Overall slant and reversing of the direction of the timelines were
studied. Divergences in the curves of seat percentage and vote percentage were analyzed.

3. RESULTS AND DISCUSSION
The studied graphs and obtained results are shown below. Conclusions drawn from the graphs are of logical and intuitive. Here
we are including YSRCP as an off shoot of congress because the very emergence of YSRCP was from decimation of congress
and the entire vote bank got shifted from congress to YSRCP. A similar incident occurred in the history of AP congress when
Indira congress decimated traditional congress and won 1978 election and of course both of them united later. Henceforth both
words i.e. Congress and YSRCP will be used interchangeably in the rest of the article.

 © 2019, www.IJARIIT.com All Rights Reserved                                                                              Page |64
Venkatapuram Mahidhar; Reddy International Journal of Advance Research, Ideas and Innovations in Technology
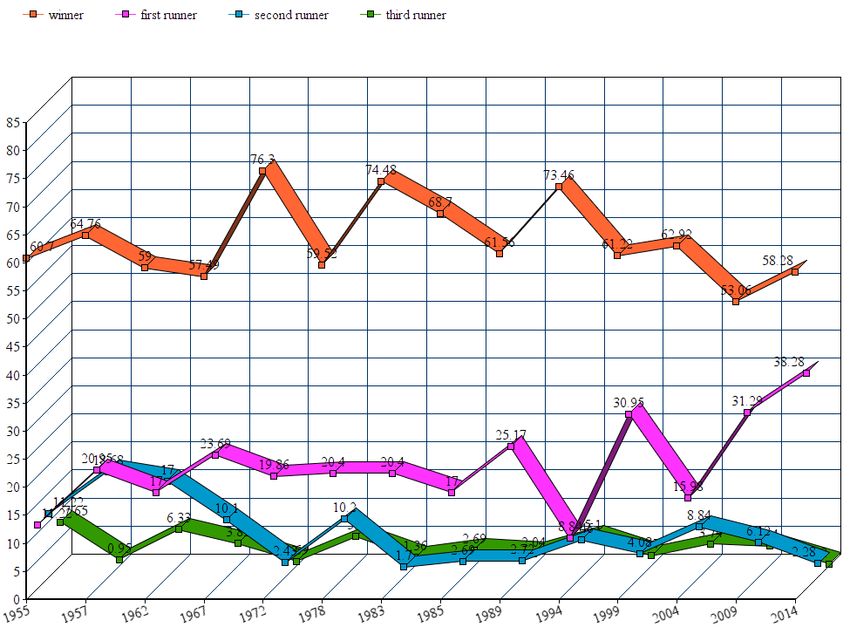
3.1 Graph 1: Comparison of performance of top 4 performers (% of seats)
Fig. 1: Comparison of performance of top 4 performers (% of seats)
Analysis: As we can see in the above graph it is a two party system picture where first and second performers (orange and pink)
are standing out with a positive inclanation. Third and fourth performers never stood out as you can see blue and green lines
showing a gradual decline from 1955 to 2014 thus they never arose and competed with the first two.this explains why there was
never a hung assembly in AP.the same picture might be repeated in 2019 with all probability. (needless to say that congress and
TDP were the top two performers till now, ofcourse, switching sides now and then).
3.2 Graph 2: Comparison of top two performers (% of seats) (again needless to say that they are congress/YSRCP and
TDP switching sides now and then)
Fig. 2: Comparison of top two performers (% of seats) (again needless to say that they are congress/YSRCP and TDP
switching sides now and then)
Analysis: As we can see here the gap between the first(orange) and second performer(pink) is getting narrower and narrower as
time progressed. It started as 60and11(49% difference) in 1955 and ended with 58 and 38(20% difference) in 2014.so we can
expect 2019 result to be an even closer,may be in a margin of 10% seat share difference.no wonder if it might be a photo finish.
© 2019, www.IJARIIT.com All Rights Reserved Page |65Venkatapuram Mahidhar; Reddy International Journal of Advance Research, Ideas and Innovations in Technology
3.3 Graph 3: Congress timeline (% of seats)
Fig. 3: Congress timeline (% of seats)
Analysis: What started as a small wavy timeline went into waxing and waning with the upsurge of TDP in 1983. These
undulations represent the mindset of people where if they vote for the party a crest (top) is made and if they vote against a party a
trough(bottom) is made.point to be noted is, the maximum distance between two end points on a slope is two units i.e. two
assembly elections. The logical conclusion here we can make is the falling line in the last leg might stop(as it has completed two
units) and go for a rise giving fortunes to YSRCP.
3.4 Graph 4: Congress timeline (% of seats) vs congress vote %
Fig. 4: Congress timeline (% of seats) vs congress vote %
3.4.1 Analysis: as we can see here vote % also is exhibiting undulations which is self explanatory i.e decresed votes % leads to
decreased seat %. But the important point to note is the divergence between the two. As you can see in the above chart between
1983 t0 1985 though congress had a decline in seat share its vote share has increased indicating a building up trend for congress
which led to congress winning with majority in the following up elections as evidenced in the above chart. Now the same
divergence you can notice from 2009 to 2014. Though congress lost 2014 election its vote share increased considerably.so we
can expect congress/YSRCP to be the winner in 2019 as evidenced by the increased vote%.
© 2019, www.IJARIIT.com All Rights Reserved Page |66Venkatapuram Mahidhar; Reddy International Journal of Advance Research, Ideas and Innovations in Technology
3.5 Graph 5: TDP time line (% of seats)
Fig. 5: TDP time line (% of seats)
Analysis: TDP time line also exhibits similar waxing and waning with crests and troughs.we we discussed previously the
maximum interval between two successive points on a slope is 2 units (i.e.) 2 assembly elections. As you can see in the above
chart the last leg of upstroke finished two units and might reverse now in 2019.so we can logically conclude TDP might witness a
down stroke in 2019 elections.if we can observe the down stroke it’s a two step process everytime for TDP.the quantity of fall is
12% for 5 years.so we might logically conclude that TDP might witness a downstroke till 46%.
3.6 Graph 6: TDP timeline (%seats) vs TDP % of votes
Fig. 6: TDP timeline (%seats) vs TDP % of votes
Analysis: The above chart is self explanatory.
© 2019, www.IJARIIT.com All Rights Reserved Page |67Venkatapuram Mahidhar; Reddy International Journal of Advance Research, Ideas and Innovations in Technology
3.7 Graph 7: Comparison of congress and TDP timelines with respect to seat %
Fig. 7: Comparison of congress and TDP timelines with respect to seat %
Analysis: Here we can see congress/YSRCP and TDP rebounding from extremes and switching sides and also we can see the
extremes getting contracted as time progresssing.so it is logical to infer that there might be one more crossover now with TDP
coming down and congress crossing up.
4. CONCLUSION
Taking a note of above said points and extrapolating them to current scenario we can conclude the following points.
(a) It’s again a two party fight between TDP and YSRCP.
(b) Continuing the trend, there might not be any hung assembly.
(c) JANASENA might post miniscule numbers.
(d) The probabilities and odds are in favour of YSRCP with almost all the variables discussed above favouring it.
(e) TDP might restrict itself to second place as none of the variables discussed above helping it.
(f) The difference between seat share of YSRCP and TDP might be 8 to 10 percent which comes to a mere 15 seats.
(g) A tight contest with a very narrow seat difference might be expected with advantage YSRCP as the most probable outcome.
5. QUANTITATIVE RESULTS
Most probable outcome
YSRCP: 91-92 SEATS.
TDP: 80-81 SEATS.
JANASENA: 2-3 SEATS
6. DRAWBACKS OF THE STUDY
As the quantity of data is for the past 50 years only and the events in the timeline are only once in 5 years and moreover YSRCP
is a new emergent with only one event in its timeline (hence we have considered it an offshoot of congress technically for the
reasons explained in above sections), the results of the study might not be accurate. Moreover we have given quantitative results
for the most probable outcome only here. The other two possible outcomes which also are in the favour of YSRCP are not
quantitatively discussed here as the inferences and calculations are complicated and out of the scope of this article.
7. REFERENCES
[1] https://eci.gov.in/files/file/4053-andhra-pradesh-2004/
© 2019, www.IJARIIT.com All Rights Reserved Page |68You can also read