An Approach to Skin Cancer Detection using Keras and Tensorflow
←
→
Page content transcription
If your browser does not render page correctly, please read the page content below

Journal of Physics: Conference Series

PAPER • OPEN ACCESS

An Approach to Skin Cancer Detection using Keras and Tensorflow
To cite this article: Abilash Panja et al 2021 J. Phys.: Conf. Ser. 1911 012032

View the article online for updates and enhancements.

                                This content was downloaded from IP address 46.4.80.155 on 30/08/2021 at 11:59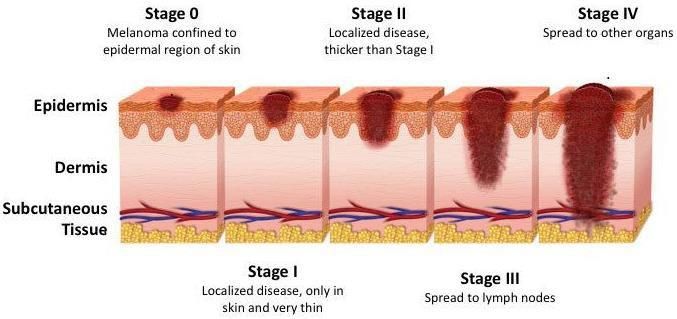
ICITSD 2021                                                                                                     IOP Publishing
Journal of Physics: Conference Series                        1911 (2021) 012032           doi:10.1088/1742-6596/1911/1/012032

An Approach to Skin Cancer Detection Using Keras and
Tensorflow

                     Abilash Panja, Christy Jackson J and Abdul Quadir Md
                     School of Computer Science and Engineering, Vellore Institute of Technology,
                     Chennai, India

                     Email: abilashpanja07@gmail.com, christyjackson.j@vit.ac.in,
                     abdulquadir.md@vit.ac.in

                     Abstract. For humankind, skin cancer is a troubling illness. Given the rapid growth rate of skin
                     cancer, its high treatment cost and death rate, the need for early detection of skin cancer has been
                     increased. Now, the world has evolved in a way where skin cancer detection is possible by image
                     pre-processing and machine learning methods. One well known and well worked method is
                     Convolutional Neural Network (CNN). After segmentation of dermoscopic images, the features
                     of the affected skin cells are extracted using feature extraction technique. We propose a
                     convolutional neural network model to detect cancerous state of a person’s skin and classify
                     them as malignant (melanoma) and benign (non-malignant). The above model’s architecture
                     contains various layers which helps in reading the dataset by computer. Accurate results are
                     always expected in these cases. We are using manual approach instead of automatic approach to
                     overcome possible errors.

1. Introduction
Skin cancer has become a major disease in the present world alongside other commonly occurring
cancer. Skin cancer is of two types, melanoma (malignant) and non-melanoma (benign). A patch of dark
spot, scar, and disfigure on the skin or similar looking patches could be a symptom for skin cancer, but
it does not always have to be cancerous. It could be skin rash as well. Signs of skin cancer include
changes in skin colour, size, shape, itching etc. Basically, we will only know after getting checked. It
can cause severe pain as well as bleeding on the skin. One very well known cause of skin cancer is
ultraviolet rays. Direct exposure to this UV radiation is known to be one of the common cause for skin
cancer.
   A biopsy would usually be done to identify melanoma by doctors / dermatologists. In current
scenario, with the help of computation, machine learning in general, made it possible to identify benign
and malignant melanoma. In this world of technology, experience is something you can only gain
through time and effort. Doctors who have studied for years and helping people in ways only they can
do. Though various research shows that technology has outperformed doctors in terms of knowledge, a
doctor’s opinion in some cases, if not, all the cases, is needed instead of just depending on the
technology. In addition, technology can be used as a tool to back the doctor’s opinion in the case of
expert advices.
   Multiple research studies on automatic classification of images of melanoma using machine learning
and computing vision method has been developed. While these studies deliver promising results, the
use of computer vision and conventional machine learning significantly impacts their classification
performance by the segmentation result of the skin lesion and the features identified for the method of
classification. We are proposing a deep convolution neural network in this research to classify images

              Content from this work may be used under the terms of the Creative Commons Attribution 3.0 licence. Any further distribution
              of this work must maintain attribution to the author(s) and the title of the work, journal citation and DOI.
Published under licence by IOP Publishing Ltd                          1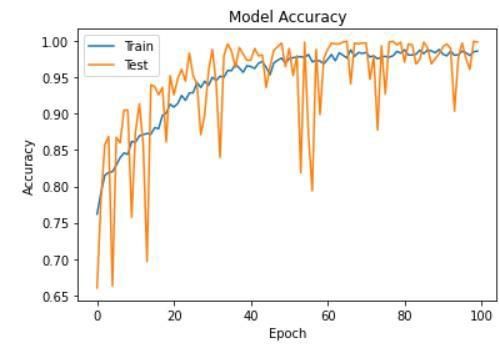
ICITSD 2021                                                                                  IOP Publishing
Journal of Physics: Conference Series            1911 (2021) 012032    doi:10.1088/1742-6596/1911/1/012032

of melanoma into a benign and malignant group. Hopefully, the designed model can be adapted for real
application that can help the professional to make diagnosis and recovery effectively.

                                        Figure 1. Stages of melanoma
2. Literature Survey

The working system of [1] consist of CNN done with the help of Keras API with Conv2D, MaxPool2D,
ReLu and ADAM optimizer. They’ve also used CNN algorithm on VGG, ResNet andDenseNet
methods. They’ve achieved 79% accuracy with CNN with 50 epochs, 90% accuracy with both ResNet50
and DenseNet121 and finally 85% accuracy with VGG11 BN with 10 epochs for other models other
than CNN. In [2], they introduced a new and effective model using the Convolution Neural Networks
algorithm to precisely identify and describe the type of skin cancer without any clinical procedure. They
started with Patch extraction followed by Convolution Layer, Activation Layer, Pooling Layer and
finally, fully connected Layer. They achieved a maximum of 91% after 10 epochs with data size being
8000. In [3], in addition to CNN model, they’ve used something called Gabor filter (GCN) before the
process of CNN starts. The process done in this Gabor filter is then injected into CNN and follow the
steps of CNN model. The dataset consists of 33, 569 images. They’ve done 15 epochs with just CNN
and GCN/CNN combined using ADAM optimizer. In [4], they divide their dataset into multiple splits
and run them each to find the one which gives out the highest accuracy. They have split the dataset into
90-10, 80-20, 70-30, 60-40 and 50-50. They achieved a highest accuracy of 88% for a split of 90-10
with 12000 images in the dataset for each split. In [5], with the dataset size of 200 images, using ANN.
The pre-processing stage of ANN consists of handling missing data and selecting important features.
They compared this proposed model with SVM and RF models and proved that their model scores high
than the other two. In [6], they have used various ML algorithms and compared each other to show
which did best. Using ANN, LDA, NB and SVM to compare, LDA tops with 82.26% accuracy in binary
class classification and SVM tops with 81.61% accuracy in multi class classification. In [7], they used
SVM model and achieved an accuracy of 90% with SVM architecture being a bit different from CNN
architecture having pre-enhanced images and converted into 1-Dimensional array and finally trained in
SVM model. In [8], they’ve used CNN with convolution layer, ReLU layer, Pooling layer, fully
connected layer. The batch size was 20 and the epoch size was 25. They gained 70% accuracy in the
end. In [9], they have used YUV based method with 300 images and 80-20 split. Trained using SVM,
they achieved an overall accuracy of 86.7%. [10] Speaks about detecting the disease with the help of a
dataset consisting 28,000 images collected from a hospital. They had 2 datasets A and B where A
achieved 86.54% accuracy and B achieved 85.86% accuracy. [11] Uses CNN model without the
normalization layer which helps in removing non trainable parameters from the dataset which in turn
helps with the efficiency of the model. They ran tests with multiple epoch values and dropout values

                                                      2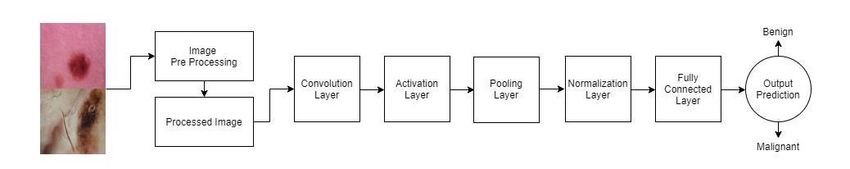
ICITSD 2021                                                                                  IOP Publishing
Journal of Physics: Conference Series           1911 (2021) 012032     doi:10.1088/1742-6596/1911/1/012032

and found that the maximum accuracy achieved was 84.76% doing 10 epochs and a dropout value of
20%.

3. Proposed Method
The proposed approach of predicting skin cancer using image processing offers early diagnosis of skin
cancer using machine-aided processing that provides doctors with great help to diagnose skin cancer
before spreading. In order to implement our model using Keras and TensorFlow libraries, we use deep
learning techniques using a convolutional neural network algorithm.

                                        Figure 2. Basic Architecture
   CNN primarily deals with processing images. It consists of three layers, a hidden layer, an input layer
and a middle layer. In any neural network, all the middle layers are hidden because the activation
function and convolutions hide their inputs and outputs. The first layer whi ch i s convolution
layer performs convolutions on CNN followed by Activation layer, Pooling layer, fully connected layer
and normalization layer. We use the activation function ReLu here in our model, which converts all
positive pixels to 1 and all zeros and negative pixels to 0. There will be a uniformity of the pixels of
each image and it is very simple for classification and analysis. To calculate loss function, we use binary
cross entropy which calculates the average measure of difference between two probability distribution
for random events. Binary cross entropy is followed by sigmoid activation function. Sigmoid activation
function is monotonic function which is used to find probability which exist between 0 and 1. In our
model, we are using the combination of sigmoid and ReLu activation function, so that our model will
be optimized accurately.

                                 Figure 3. Proposed Architecture of CNN
   In the normalization layer, we have used batch normalization. Batch normalization is used to improve
the performance and stability of deep neural network. It normalizes the input layer by re-centering and
rescaling. They remove the parameters from training which reduces the performance of the model and
change them to non-trainable parameters. We use Tensorflow and Keras libraries in jupyter notebook to
implement this model. They are purely python-based framework used to implement neural networks.
Fig.3 represents detailed architecture of CNN. It is clearly explained the different layer approaches of

                                                     3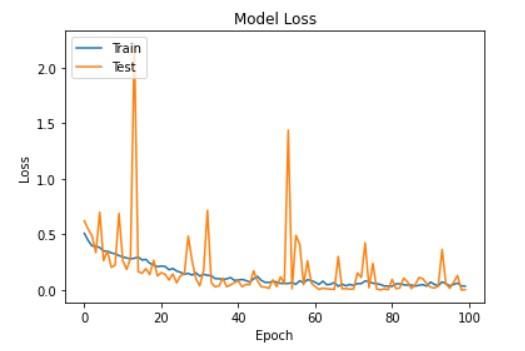
ICITSD 2021                                                                                   IOP Publishing
Journal of Physics: Conference Series            1911 (2021) 012032     doi:10.1088/1742-6596/1911/1/012032

Neural network. Various step carried after an input image is processed to produce desired output. In this
model, we have taken ISIC archive repository dataset which contains 2637 input images for training
which belong to two classes benign and malignant and 800 testing images. We have tested the model
with different epochs to test the accuracy difference between the epochs and loss function. After finding
training accuracy we manually tested the model with 100 random image to check the predictions with
expected results. Results are shown in table. Here in our model, rather than preferring automatic
prediction, we are testing each image separately.

4. Experimental Results
                                   Table 1. Experiments on Epoch Values
                           Epoch               Model’s Performance (%)
                           Value
                                        Existing Model’s     Proposed Model’s
                                           Accuracy              Accuracy
                              10              84.76                83.38
                              25             83.84                    87.52

                              50             82.77                    91.21
                             100             81.25                    95.61

Table 1. Here, we used different epoch values to see how our model performs with the existing model.
We have seen a rapid increase in accuracy when compared to existing model. The best performance we
achieved was at 100 epochs with 95% accuracy with 0.5% dropout value as constant for all the
experiments.
                                   Table 2. Experiments on Dropout Values
                           Dropout             Model’s Performance (%)

                            Value
                             (%)         Existing Model’s    Proposed Model’s
                                            Accuracy             Accuracy

                               0              83.84                   86.86
                              10              83.99                   85.44
                              20              84.76                   84.89
                              30              84.60                   85.48

Table 2. We changed the dropout value and noted the performance change. Dropout layer is used to
increase the performance of the model. Dropout layer forces the model to look for the important features
of the data while leaving out unwanted or less important features. 10 epochs as constant value for
different dropout values. We can see that at 0% dropout, we achieved the highest accuracy of 86% after
10 epochs.

                                                      4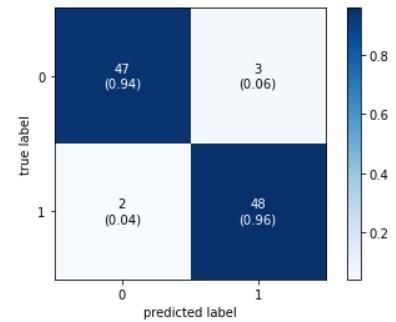
ICITSD 2021                                                                                    IOP Publishing
Journal of Physics: Conference Series             1911 (2021) 012032     doi:10.1088/1742-6596/1911/1/012032

 Tables 1 and 2 represent epoch values and dropout values and the difference in values between each of
the data we used.

                                        Table 3. Classification Report

                                        precision    recall      f1-       support
                                                               score
                              1            0.96       0.94      0.95          50

                              0            0.94       0.96      0.95          50

                          accuracy                              0.95         100

                           macro           0.95       0.95      0.95         100
                            avg

                          weighted         0.95       0.95      0.95         100
                            avg

Table 3. Shows the Classification Report of Validated Images. With these values, performance metrics
can be calculated.

                             Figure 4. Confusion Matrix of Validated Images

   Table 3. And Figure 4. Shows the confusion matrix and classification report for the data we predicted.
Expected prediction and actual prediction is used to determine the confusion matrix and we got values
through classification report.

                                                       5
ICITSD 2021 IOP Publishing
Journal of Physics: Conference Series 1911 (2021) 012032 doi:10.1088/1742-6596/1911/1/012032
Table 4. Performance Metrics
Metrics Formula Value
1 Sensitivity TP/(FN+TP) 0.94
2 Specificity TN/(FP+TN) 0.96
3 True Positive TP/(TP+FN) 0.94
Rate
4 False FP/(FP+TN) 0.04
Positive Rate
Table 5. G-mean and Matthew’s correlation coefficient
Metrics Formula Value
1 G – mean (Sensitivity*Specifici 0.949
ty)1/2
2 Matthew’s (TP*TN – FP*FN) / 0.900
Correlation ((TP+FP)*(TP+FN)*
Coefficient (TN+FP)*(TN+FN))
1/2
Using the values we got, we’ve performed various performance metrics and tabulated them in Table 4.
Table 5 specifies the Geometric mean or G-mean is the performance metrics of specificity and sensitivity.
Matthew’s correlation coefficient is used as the measure of binary classifications. It takes into account
the true and false positives and negatives and is generally regarded as a balanced measure which can be
used even if the classes are of very different sizes.
Figure 5. ROC Curve
6ICITSD 2021 IOP Publishing
Journal of Physics: Conference Series 1911 (2021) 012032 doi:10.1088/1742-6596/1911/1/012032
Receiver Operating Characteristics Curve (ROC Curve) shows the performance classification
between true positive rate and false positive rate.
Figure 6. Model Accuracy Figure 7. Model Loss
This shows the variation in training and testing accuracy as well as the training and testing loss
occurred per epoch. We did 100 epochs and in the graph we can see the variations.
Hence our proposed model is superior to the existing model in terms of efficiency and accuracy. We
used Normalization Layer which separated non trainable parameters from the data and made the training
process faster and efficient.
5. Conclusion
Diagnosing skin cancer in the earlier stages is one of the major criteria for the proper treatment. In fact,
it’s the same for any type of cancer. It is difficult to diagnose cancer in very early stages before tumour
or any structural change occurs in the appearance. It can be done using biopsy as a medical procedure.
But in this world evolved with technology, with machine aided support, it can be done using algorithms
and datasets. Our model provides such an assistance to doctors to recognise at the earliest. This deep
learning model of skin cancer detection using Convolutional Neural Network can be used as an added
assistance to doctors, with respect to doctor’s experience as well.
We can create a mobile based (Android/iOS) or web-based deep learning framework for future work,
where we can upload our image and validate the result that can be more reliable, fast and affordable than
the current system.
References
[1] M. M. I. Rahi, F. T. Khan, M. T. Mahtab, A. K. M. Amanat Ullah, M. G. R. Alam and M. A. Alam,
2019 Detection of Skin Cancer Using Deep Neural Networks, 1-7.
[2] R. S. Sanketh, M. Madhu Bala, P. V. Narendra Reddy and G. V. S. Phani Kumar, 2020 Melanoma
Disease Detection Using Convolutional Neural Networks, 1031-1037.
[3] E. Chabi Adjobo, A. T. Sanda Mahama, P. Gouton and J. Tossa, 2019 Proposition of Convolutional
Neural Network Based System for Skin Cancer Detection, 35-39.
[4] R. EL SALEH, S. BAKHSHI and A. NAIT-ALI, 2019 Deep convolutional neural network for face
skin diseases identification, 1-4.
7ICITSD 2021 IOP Publishing
Journal of Physics: Conference Series 1911 (2021) 012032 doi:10.1088/1742-6596/1911/1/012032
[5] M. Z. Hasan, S. Shoumik and N. Zahan, 2019 Integrated Use of Rough Sets and Artificial Neural
Network for Skin Cancer Disease Classification, 1-4.
[6] P. R. Hegde, M. M. Shenoy and B. H. Shekar, 2018 Comparison of Machine Learning Algorithms
for Skin Disease Classification Using Color and Texture Features, 1825-1828.
[7] N. V. Kumar, P. V. Kumar, K. Pramodh and Y. Karuna, 2019 Classification of Skin diseases using
Image processing and SVM, 1-5.
[8] J. Rathod, V. Waghmode, A. Sodha and P. Bhavathankar, 2018 Diagnosis of skin diseases using
Convolutional Neural Networks, 1048-1051.
[9] L. Wijesinghe, D. Kulasekera and W. Ilmini, 2019 An Intelligent Approach to Segmentation and
Classification of Common Skin Diseases in Sri Lanka, 47-52.
[10] X. Zhang, S. Wang, J. Liu and C. Tao, 2017 Computer-aided diagnosis of four common cutaneous
diseases using deep learning algorithm, 1304-1306.
[11] R. Rokhana, W. Herulambang and R. Indraswari, 2020 Deep Convolutional Neural Network for
Melanoma Image Classification, 481-486.
8You can also read