An assessment of environmental taxation in France to identify priority areas for reform
←
→
Page content transcription
If your browser does not render page correctly, please read the page content below
An assessment of
             environmental taxation in
             France to identify priority
                  areas for reform

         Augustin Vicard
         augustin.vicard@developpement-durable.gouv.fr

         Commissariat général au développement durable
         French Ministry of Environment, Energy and the
         Sea

       7th Thematic FAERE Workshop
       May 12, 2017

Crédit photo : Arnaud Bouissou/MEEM
A report on environmental taxes
An inventory of
environmental taxation and
its recent evolutions:
Paris Agreement, Energy
Transition towards Green
Growth Act and « carbon
pricing »
But also : pay-as-you-throw
schemes, equal taxation for
gasoline and diesel, etc.
A summary for all
stakeholders:
Main figures
How taxes work, and do they
work?
International benchmark
2
Outline

1. Green Taxation in France:
 where do we stand now?

2. Some options for reform

                               3
A short definition of green taxes
Taxes based on the polluter pays principle
Statistical international definition (OECD and
Eurostat, since the end of the 90’):
« A tax whose tax base is a physical unit (or a proxy of
it) that has a proven specific negative impact on the
environment »
=> tax base criterium, but no reference to tax rates
In economics (pigouvian tax), the definition is
more stringent:
The tax rate should also be high enough to compensate
for the damages implied by the pollution, and/or to really
change behaviour
4
Revenue from env. taxes
                                  Eurostat’s Definition

                                          Revenue 2015                              Nb of
                                             in M€                               instruments
            Energy                                38 522                                    11
          Transport                                  6 128                                  18
           Pollution                                 2 452                                   4
        Resources                                         376                                7

               Total                              47 478                                    40
Source : CGDD, d’après les annexes au PLF, Evaluation des voies et moyens, Tome 1, Evaluation de recettes, DGDDI

                                                                                                                   5
The main environmental taxes

  Source : CGDD, d’après les annexes au PLF, Evaluation des voies et moyens, Tome 1, Evaluation de recettes, DGDDI

                                                                                                                     6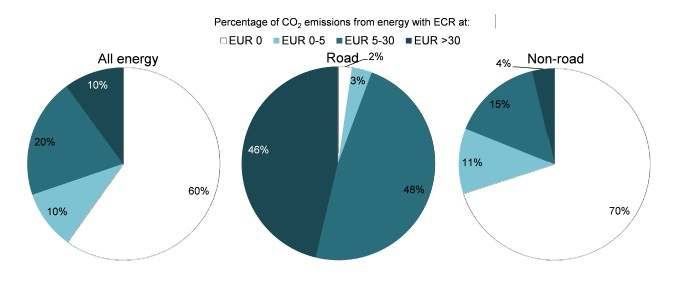
France within Europe
                         Environmental taxes as a share of GDP,
                     in France and the Euro-zone, 1995-2014 (in %)
              3,0

                                                                                                 EURO-ZONE
              2,5

              2,0
En % du PIB

                                 FRANCE
              1,5
                                                                                                       In 2015, ranked 20th
                                                                                                         over 28 European
              1,0                                                                                            countries

              0,5

              0,0
                1995                            2000                           2005                            2010
                    Champ : Eurostat, excluant notamment les taxes et redevances d’enlèvement des ordures ménagères (TEOM et REOM) et la
                    taxe d’aménagement.
                    Source : Eurostat (les données de 2013 et 2014 sont semi-définitives ou provisoires).

                                                                                                                                           7
France within Europe
            Environmental taxes as a share of GDP,
        in France and the European Union, 2015 (in %)

Pollution and resources               +53%
                                                                                   EU-28 France

              Transport                              -44%

                 Energy
                                                                                                                     -5%

                          0.0      0.2      0.4       0.6      0.8      1.0      1.2       1.4      1.6      1.8      2.0

                                                       Tax revenue as a % of GDP
         Champ : Eurostat, excluant notamment les taxes et redevances d’enlèvement des ordures ménagères (TEOM et REOM) et la
         taxe d’aménagement.
         Source : Eurostat.

                                                                                                                                8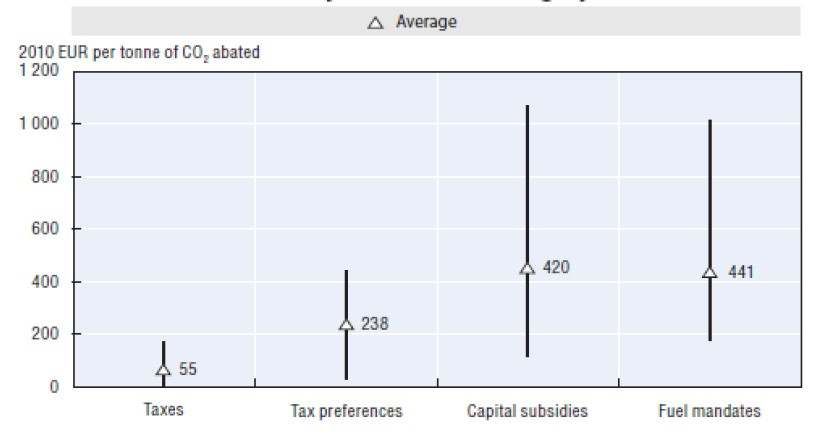
Tax revenue since 1995
                         Environmental taxes as a share of GDP,
              3,0
                     in France and the Euro-zone, 1995-2014 (in %)

              2,5

              2,0
En % du PIB

              1,5                 Why did the share decline until 2008?

                                  1) Dieselisation of the car fleet
              1,0
                                  2) Non-indexation of the main energetic taxes

              0,5                 3) Partial decoupling between economic growth
                                  and growth of energy consumption or pollution

              0,0
                1995                            2000                            2005                            2010
                    Champ : Eurostat, excluant notamment les taxes et redevances d’enlèvement des ordures ménagères (TEOM et REOM) et la
                    taxe d’aménagement.
                    Source : SOeS (les données de 2013 et 2014 sont semi-définitives ou provisoires).

                                                                                                                                           9
Tax revenue since 1995
Environmental taxes as a share of GDP,
3,0
in France and the Euro-zone, 1995-2014 (in %)
2,5
2,0
En % du PIB
Why did the share increase since 2009?
1,5
1) Increase in the tax on electricity consumption,
which finances in France the support to renewable energy
1,0 (since 2011)
2) Introduction of a carbon tax (since 2014)
0,5
3) More marginally, break of the time-series related to
the introduction of IFER (in 2010)
0,0
1995 2000 2005 2010
Champ : Eurostat, excluant notamment les taxes et redevances d’enlèvement des ordures ménagères (TEOM et REOM) et la
taxe d’aménagement.
Source : SOeS (les données de 2013 et 2014 sont semi-définitives ou provisoires).
10Main reforms since 2008
Environmental taxes as a share of GDP,
3,0
in France and the Euro-zone, 1995-2014 (in %)
2,5
2,0
En % du PIB
1,5
From 2009: increasing use of Pay-as-you-throw
Schemes (PAYTS) for garbage collection
1,0 Tarification incitative des déchets (REOMI)
2012: legal possibility to implement PAYTS
in every city, regardless of their status
0,5 Tarification incitative des déchets (TEOMI)
0,0
1995 2000 2005 2010
Champ : Eurostat, excluant notamment les taxes et redevances d’enlèvement des ordures ménagères (TEOM et REOM) et la
taxe d’aménagement.
Source : SOeS (les données de 2013 et 2014 sont semi-définitives ou provisoires).
11Main reforms since 2008
Environmental taxes as a share of GDP,
3,0
in France and the Euro-zone, 1995-2014 (in %)
2,5
2,0
En % du PIB
1,5 2013 and 2014 : extension
of the tax on air pollutants
to 12 new substances
1,0
TGAP air
0,5
0,0
1995 2000 2005 2010
Champ : Eurostat, excluant notamment les taxes et redevances d’enlèvement des ordures ménagères (TEOM et REOM) et la
taxe d’aménagement.
Source : SOeS (les données de 2013 et 2014 sont semi-définitives ou provisoires).
12Main reforms since 2008
Environmental taxes as a share of GDP,
3,0
in France and the Euro-zone, 1995-2014 (in %)
2,5
2,0
En % du PIB
1,5
2014 : carbon tax
Contribution climat-énergie
1,0 ou composante carbone
0,5
0,0
1995 2000 2005 2010
Champ : Eurostat, excluant notamment les taxes et redevances d’enlèvement des ordures ménagères (TEOM et REOM) et la
taxe d’aménagement.
Source : SOeS (les données de 2013 et 2014 sont semi-définitives ou provisoires).
13Main reforms since 2008
Environmental taxes as a share of GDP,
3,0
in France and the Euro-zone, 1995-2014 (in %)
2,5
2,0
En % du PIB
1,5
2015 : towards an equal
taxation for gasoline
1,0 and diesel
0,5
0,0
1995 2000 2005 2010
Champ : Eurostat, excluant notamment les taxes et redevances d’enlèvement des ordures ménagères (TEOM et REOM) et la
taxe d’aménagement.
Source : SOeS (les données de 2013 et 2014 sont semi-définitives ou provisoires).
14Main reforms since 2008
Environmental taxes as a share of GDP,
3,0
in France and the Euro-zone, 1995-2014 (in %)
2,5
2,0
En % du PIB
1,5 2016 : increase in the tax on
waste stocking centres
and incineration plants
1,0
TGAP déchets
0,5
0,0
1995 2000 2005 2010
Champ : Eurostat, excluant notamment les taxes et redevances d’enlèvement des ordures ménagères (TEOM et REOM) et la
taxe d’aménagement.
Source : SOeS (les données de 2013 et 2014 sont semi-définitives ou provisoires).
15Outline
1. Green Taxation in France: where do we
stand now?
2. Some options for reform
16Why should we reform our
environmental tax system? (1/2)
Strong injunctions from international organizations,
including:
European Commission (greening of the European
semester)
OECD (France 2016 Environmental Performance Review)
G20 (fossil fuel subsidies)
National and international targets for reducing our
environmental footprint (LTECV, Paris Agreement,
etc.) and for raising our revenue from green taxation
(conférence environnementale 2012)
17Why should we reform our
environmental tax system? (2/2)
In this context, the report takes stock of
evaluations of existing taxes, and presents
several successful experiences from our main
partners (international benchmark)
It identifies possible avenues for reform, without
prejudging their political expediency
18Let’s open the debate!
I will cover several topics, on
which some of you have certainly
worked.
Your questions and inputs are
highly welcome.
Please feel free to interrupt me.
19Indexing environmental tax rates
on inflation?
Unlike other tax instruments, no automatic indexing of most
environmental taxes
This point is often overlooked in the debate about green
taxes.
Most economists would agree that environmental tax rates
should increase as the externalities that the tax cover. And
because these externalities – like damages to the ecosystem
or deterioration of human health - rise faster than prices
(Quinet report, 2013), env. tax rates should at least be
indexed on inflation
This point is so evident to many economists that they don’t
mention it (e.g. Mirrless review in the UK).
20Indexing environmental tax rates
on inflation?
Lack of indexing significantly erodes taxes’
ability to reduce pollution
Would avoid an erosion of env. taxation such as
that observed between 1995 and 2008:
In constant euros, the tax rate on gasoline is still 15% lower in 2016
than at its peak in 1998
In the absence of indexation and with an inflation rate of 1.75% per
year up to 2030, the TICPE rate on gasoline would be lower in constant
euros in 2030 than in 2017, although the carbon component increase
from 30,5 € / tCO2 in 2017 to 100 € / tCO2 in 2030
Automatic indexing does exist in France for the
TGAP air since 2013 and in several European
countries for fuel taxes (Norway or the
Netherlands)
21Taxing diesel at the right level?
First steps towards an equal taxation of diesel and
gasoline (2015-2017); equal taxation could be reached
by 2022, by reducing the tax on gasoline by 5c€/l (-1c€/l
every year) and increasing the tax on diesel in the same
proportions
Taxation differential between diesel and gasoline
2014 2015 2016 2017
Gasoline (SP95 E5) and
+ 14 c€/l + 12 c€/l
Diesel
+ 18 c€/l + 16 c€/l
Gasoline (SP95 E10) and
+ 12 c€/l + 10 c€/l
Diesel
Feebate scheme for the purchase of a new car could
incorporate an air pollution component (see Israeli
system for instance), which will discourage businesses
and households to buy diesel cars
22Tax incentives for buildings’
thermal renovation
Three instruments : tax credit (CITE), Reduced
VAT rate and Zero rate loan (Eco-PTZ)
Essential to achieve our renovation and
emission reductions targets, but could probably
be improved
German program is interesting, because the
amount of the subvention is based on the
energy reductions achievements (whereas the
CITE yields a uniform subvention corresponding
to 30% of the renovation costs)
23Taxing off-CO2 GHG emissions?
Methane (tax on red meat or on breeding)?
Nitrogen oxide (tax on nitrogen fertilizers)?
24Developing Pay-As-You-Throw
Systems?
Very efficient: -30%
residual garbage
collection
Quick development
betw. 2011 and
2014, but slowdown
since 2015
How can we reach
the legal target of
25m people
covered in 2025?
25What about urban sprawling and
loss of biodiversity?
Urban sprawling and artificialisation of land surfaces are one
of the main causes of loss of biodiversity
We could green our development tax (taxe d’aménagement)
by reducing or suppressing the tax exemptions, for instance
for parking lots or public housing (Sainteny report, 2012)
Or generalize a tax on buildings with a small surface as
compared to its land consumption (versement pour sous-
densité)
But taxes are seldom usedfor that purpose in other countries
(OECD, 2012), and are probably not the best instrument for
dealing with spatial issues
26Any other idea?
27Thank you for your attention!
APPENDIX

           29
Outline
1. More on the French Carbon Tax
2. More on pay-as-you-throw
schemes for garbage
30What is a carbon tax?
A tax on the carbon-content of fossil fuels,
expressed in € per tonne of CO2
To be more concrete, a tax of 20€/tCO2
correspond to:
- diesel or domestic fuel 5.3 c€ per L
- gasoline 4.6 c€ per L
- natural gas 3.6 c€ per MWh
Generally, several exemptions, in
particular for energy-intensive industries
(risk of carbon leakage)
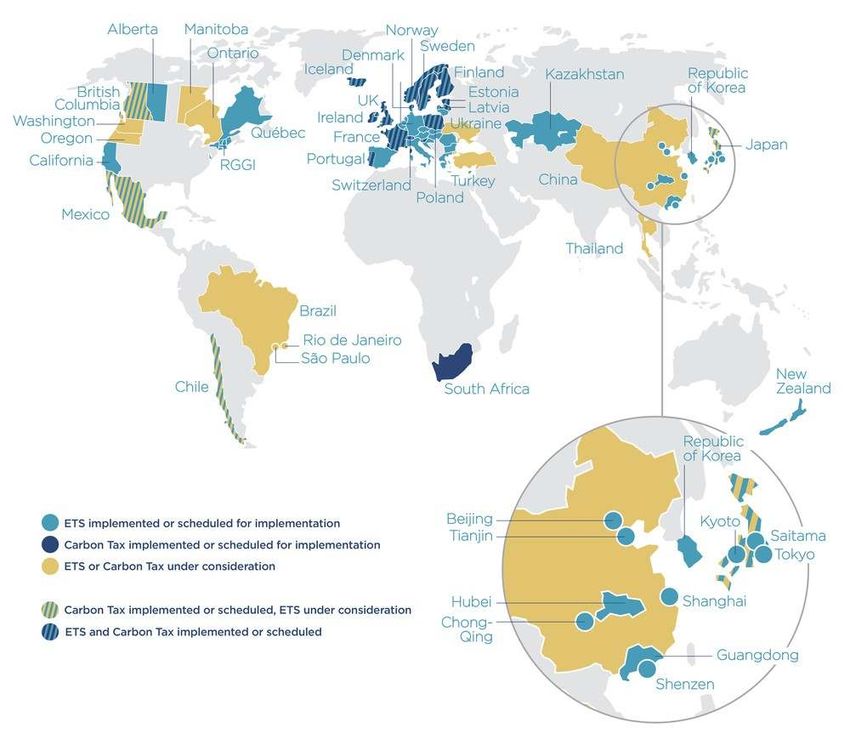
31Which countries have
introduced a carbon tax?
Source : CPLC
32Explicit and implicit
taxation of carbon
Some taxes aren’t explicitly based on GHG
emissions but implicitly tax GHG by taxing goods
emitting GHG, like fossil fuels
Share of CO2-emissions from energy use subject to effective carbon rates
(explicit, implicit or ETS), in OECD countries and 41 partners
Source : OECD (2016) Effective Carbon Rates: Pricing CO2 through
taxes and emissions trading systems
33Is a carbon tax efficient?
Estimated effective carbon price in the road
transport sector, by instruments category
Source : OECD
34Several failed attempts
In Europe at the beginning of the 90’
=> Member countries must be unanimous in bringing into force fiscal
measures, but impossible to reach a consensus; EU launched the EU-
ETS instead; some European countries (Sweden, Denmark…)
implemented a carbon tax
In the US at the beginning of the 90’ (Clinton first term)
=> strong political pressure to abandon the proposal, in particular due
to redistributive issues
In France in 1999 and 2009
=> the proposals were approved by the parliament, but rejected by the
supreme court (« Conseil constitutionnel »), because of the planned tax
exemptions (e.g. for big businesses covered by the EU-ETS or
agriculture), which undermine the constitutional principle of equal taxing
for all citizens
35The success of 2014:
why did it work this time?
International commitments
Political support: left-green government coalition
Scientific and technical committees:
Quinet report (2008): trajectory of carbon pricing from 2010 to 2030
to reach the « factor 4 » target
Green Tax Commission report (2013): a turnkey reform proposal
Window of opportunity:
a new tax credit for businesses was planned (CICE), but
w/o the corresponding financing
the carbon tax could raise revenue to finance the tax credit
Tax proposal compatible with the Constitution (not an
independent ecotax, but just a component of taxes on
fossil fuels)
36How does it work?
The so called carbon component of taxes on fossil fuels, or
Contribution climat-énergie, taxes every fossil fuel proportionally to its
carbon content
Aim: to encourage the energetic transition:
« to decrease GHG emissions by 40% between 1990 and 2030 and to
divide them by 4 until 2050 »
« to reduce the energetic final consumption by 50% between 2012 and
2050 »
Several exemptions, in particular for businesses covered by the
EU-ETS, taxis, public works, agriculture, public transportation, etc.
Rise of the trajectory:
37The difficult question
of the acceptability of the reform
Several stakeholders have opposed the introduction of a
carbon tax and remain reserved as to the increase in the tax
rate until 2030:
Some (but not all) union representatives, because of the loss of purchasing
power of workers and poor households
Some (but not all) business representatives, due to the risk of loss of
competitiveness, especially for SMEs
When introducing a carbon tax, policy makers should also focus
on the recycling revenue, which can be used to help households
and businesses cope with rising energy prices
=> The favourable opinion on carbon taxes in the world depends heavily on the
recycling of their income
Economists can also play an important role in carrying out
meaningful and accurate evaluations of the impact of
introducing the tax (anticipated impacts by shareholders are often
overestimated in relation to actual impacts)
38Take-aways
Carbon pricing (and especially carbon taxes) is a
very efficient way of encouraging the energetic
transition and to reduce GHG emissions at a lower
economic cost
The road is often long and painful to introduce a
carbon tax, but it has eventually been done in
France, as in many other countries in the last years
The question of the acceptability of the reform by
stakeholders is fundamental, and closely depends
on the use of the tax revenue
39Pay-as-you-throw schemes:
how does it work?
Pay as you throw is a usage-pricing model
for disposing of municipal solid waste
Users are charged a rate based on how much
waste they present for collection to the
municipality or local authority (excluding
recyclable waste like newspapers, packaging,
etc.).
Different from the usual schemes
Users pays a tax based on the household
composition or the dwelling characteristics,
regardless of the volume of waste they generate
40The risks of earmarking Example of the public support to feed-in tariffs for electricity generated by renewable energy (solar, wind) The public support was funded by an earmarked tax on electricity consumption. The problem here is that you generate bad incentives: you’re greening electricity production while at the same time increasing the price of electricity consumption, and yield incentives for households to use fuel oil or natural gas for heating purposes. The problem was not important till 2009, because the cost of our feed-in tariff program was low (
Pay-as-you-throw schemes:
how does it work?
Different methods available. Users
can either pay a tax based on:
The frequency of the garbage truck passages
(most frequent method in France)
The size of the garbage container
The weight of the waste collected (very costly
to implement)
The number of trash bags (less frequent)
42Pay-as-you-throw schemes:
a quick development in France
Source : Déchets ménagers - Efficacité de la
tarification incitative, Théma Essentiels, CGDD, 2016
43Pay-as-you-throw schemes:
a very efficient tax
Source : Déchets ménagers - Efficacité de la
tarification incitative, Théma Essentiels, CGDD, 2016
44You can also read