An Institutional Take on the 2020 / 2021 Digital Asset Market
←
→
Page content transcription
If your browser does not render page correctly, please read the page content below

An Institutional Take
   on the 2020 / 2021
   Digital Asset Market

December 2020

Table of Contents

Overview …………………………..………………………………………………………………….……………………………………………………………………….. 03

  Part I.    Top 10 Takeaways of 2020   No.1    Active Management Roars Back ………………….……………………..………………………………………………………………………………… 05
                                        No.2    For Investors, 2020 Was The Year of DeFi and Asset Selection ……………………………………………………….……… 06
                                        No.3    Digital Asset Yields Are Sustainable, For Now ……………………………………………………………………………….…….. 07
                                        No.4    The Remarkable Rise, Fall, and Rise Again of Crypto Derivatives …………………………………………………………… 08
                                        No.5    Crypto Hedge Funds Are Institutionalizing, But Some More Than Others .……………………………………………... 09
                                        No.6    There’s Liquid and There’s Venture, But Liquid Venture is a Tougher Pitch ………………………………………….... 10
                                        No.7    Simplicity Prevails: How The Easy Trades Continue to Win (and Scale) …………………………….……………………. 11
                                        No.8    As the Bull Returns, Beta Competes Against Venture for Capital …………………………………………………………… 12
                                        No.9    Stablecoins Have Become the Market’s Unsung Hero .….……………………………………………………………………… 13
                                        No.10   From Speculators to Allocators: Witnessing Crypto’s Investor Maturation .…………..……...………………………… 14

  Part II.   What Comes Next?           What Comes Next? A 2021 Look Ahead …………………..……………………..………………………………………………………………………………… 16
             A 2021 Look Ahead
                                        Preparing for 2021………………………….…………………………..……………………..………………………………………………………………………………… 20

                                                                                                                                                    02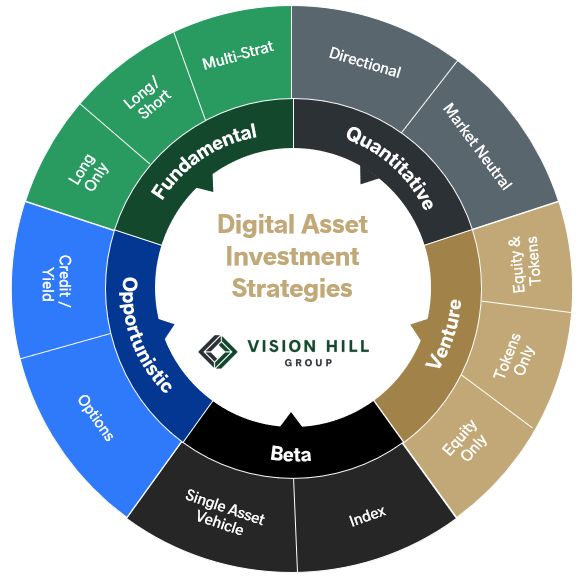
Overview

A Trusted Leader in Digital Assets
Vision Hill Group is a premier investment consultant and asset manager in
digital assets, empowering investors to make smarter investment decisions
through access to better data, benchmarks, and analytics, and to invest in a
more informed way.

With a family of crypto hedge fund indices, a leading market intelligence
database, called VisionTrack, and an asset management arm with a crypto-
focused fund of funds product, we sit at the intersection of information
(data), expertise (strategies), and access (opportunities). This vantage point,
combined with our strong and trusted relationships across numerous crypto
hedge fund and venture fund managers, gives us unique perspectives on
industry intelligence, especially as it relates to the crypto buy-side.

We are excited to continue our annual tradition of sharing some of these
perspectives in our year-in-review industry takeaways.

                                                                                  03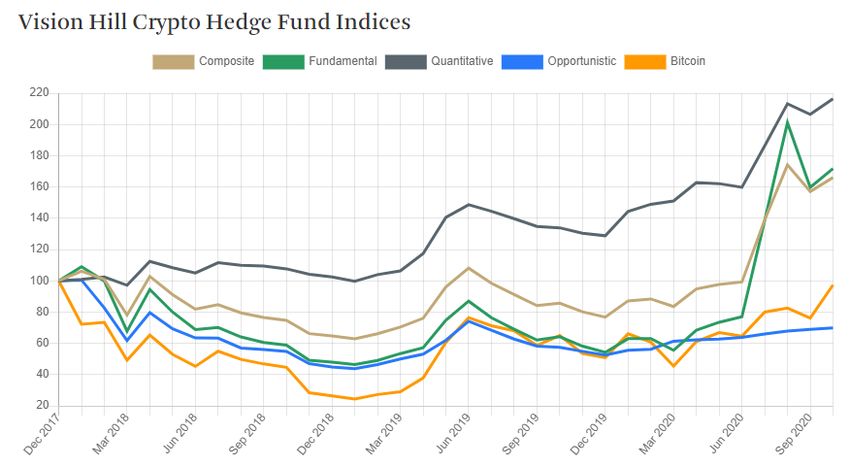
PART I.
Top 10 Takeaways
     of 2020

                   04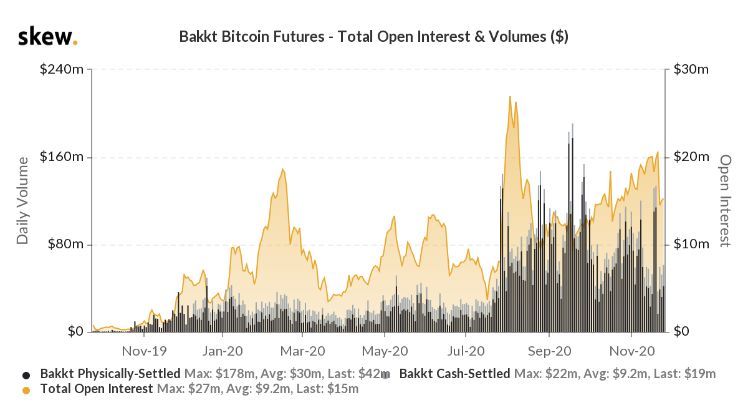
01. Active Management Roars Back
Following a challenging 2019 market in which concentration in beta (bitcoin) prevailed over idiosyncratic
diversification, active management came roaring back in 2020. According to VisionTrack data as of October 2020,
crypto hedge funds generated net returns of +116% on average, with some Fundamental managers generating net
returns in excess of +300% YTD through October. Compared to bitcoin’s +92% return over the same time period, on
average crypto hedge funds generated an outperformance of ~+2400 bps.

When it comes to return expectations and performance assessment, many investors are still focused on relative
value comparisons based on absolute returns, especially for fundamental strategies. Quantitative directional and
quantitative market-neutral strategies, on the other hand, are viewed more from a risk-adjusted return lens,
utilizing common ratios like Sharpe and Sortino. But, in an early-stage asset class, capital efficiency often can take
a backseat to absolute performance in an asymmetric return potential asset class where there is significant
opportunity cost of investment dollars allocated.

Another trend we have seen emerge this year was the establishment and growth of back offices that strengthened
many operational processes.       This includes quicker turnaround times for NAV reporting and significant               Active Benchmarks                      YTD (10/31/20)
                                                                                                                         Vision Hill Composite Index              116.29%
improvements to custody, security, valuation, and asset verification policies. Lastly, leading active managers are
                                                                                                                         Vision Hill Fundamental Index            216.86%
embracing more diligent risk management techniques. These should be table stakes in running an active asset              Vision Hill Quantitative Index            69.17%
management strategy but have been sub-par from many early managers. The presence, or lack thereof, of proper             Vision Hill Opportunistic Index           32.92%
risk management determined how many funds fared through the Black Thursday market crash on March 12th. We
are seeing an increasing number of managers thinking about risk and portfolio management correctly – on topics           Passive Benchmarks
                                                                                                                         Bitcoin (BTC)                             91.57%
ranging from upside / downside volatility capture to position limits and sizing to “max pain” stress tests and VaR
                                                                                                                         Bitwise 10 Large Cap (BITX)               94.94%
analysis – and exhibiting a deeper understanding of how their portfolio should trade in varying market regimes.          Bloomberg Galaxy Crypto Index (BGCI)      97.14%

                                                                                                                                                                                 05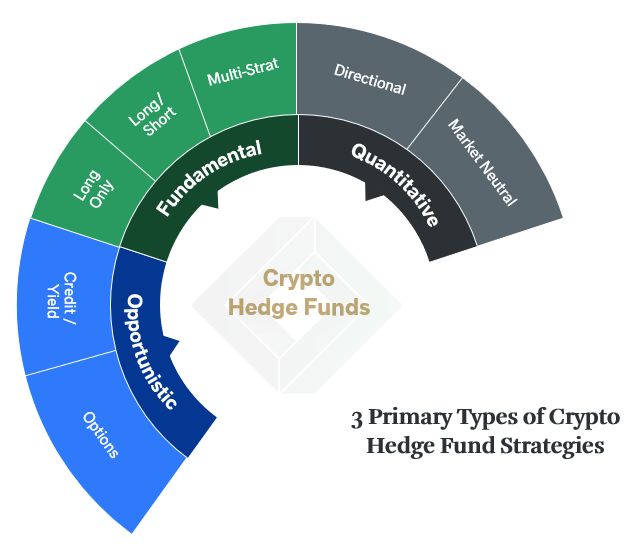
02. For Investors, 2020 was the Year of DeFi and Asset Selection
DeFi Sector DeFi stands for “Decentralized Finance” and represents a nexus of software-based “smart contracts”
Name Ticker Category YTD (1) YTD Peak (2) that interact with each other and collectively enable global access to legacy financial infrastructure,
Ethereum ETH Base Layer 374.4% 379.3% without the need for a trusted financial intermediary. DeFi started rising in popularity within the
Solana SOL Base Layer 136.8% 493.7%
industry in 2019 and made an even steeper ascent during the summer of 2020. It can be best thought of
Aave AAVE Borrowing/Lending 4,421.9% 4,569.0%
as a thematic sector within the frontier digital asset market. Just like the S&P 500 is comprised of
Maker MKR Borrowing/Lending 29.7% 83.2%
Compound COMP Borrowing/Lending 10.1% 215.0%
various sectors (financials, healthcare, industrials, etc.), each with their own sub-verticals, DeFi is a
RenVM REN Liquidity Provision / AMMs / DEXs 989.9% 1,763.7% thematic investable sector of digital assets, with its own set of sub-verticals. These include borrowing
Serum SRM Liquidity Provision / AMMs / DEXs 862.8% 3,333.5% and lending, decentralized exchanges (DEXs) and automated market makers (AMMs), liquidity
Loopring LRC Liquidity Provision / AMMs / DEXs 804.6% 1,108.9% providers, synthetic and wrapped assets, decentralized insurance, prediction markets, and much more.
Kyber KNC Liquidity Provision / AMMs / DEXs 463.0% 907.0%
Bancor BNT Liquidity Provision / AMMs / DEXs 297.6% 916.8% Many of these DeFi markets offer highly attractive yields in exchange for locking up capital for either
Uniswap UNI Liquidity Provision / AMMs / DEXs 242.7% 528.5% collateral or governmental “voting rights” staking purposes, and this has enticed many investors to
0x ZRX Liquidity Provision / AMMs / DEXs 134.7% 302.0% “farm” for those yields. Total value locked in DeFi contracts surged 25x to ~$15 billion as of the end of
Balancer BAL Liquidity Provision / AMMs / DEXs -23.9% 77.6%
November from ~$600 million in January. The exploding DeFi asset prices witnessed in summer 2020
Curve CRV Liquidity Provision / AMMs / DEXs -84.6% 21.6%
were largely attributable to this “yield farming” frenzy; however, by Q3/Q4 2020, it became obvious that
Yearn.Finance YFI Programmatic Yield 2,412.2% 4,022.4%
Kava KAVA Programmatic Yield 49.1% 354.8%
yield farming was becoming an expensive user acquisition feature in disguise. The attractive yields
UMA UMA Synthetic Assets 600.9% 2,281.9%
offered by newly launched DeFi platforms represented the costs incurred to acquire new users, and
Synthetix SNX Synthetic Assets 284.6% 496.4% these costs were paid out in the form of their respective network tokens (aka, inflation). Just like
Nexus Mutual NXM Decentralized Insurance 162.9% 804.0% traditional cash burn, these capital expenditures were intended to generate high user retention,
Gnosis GNO Prediction Markets 481.7% 516.8% however not all platforms succeeded. In Q3/Q4 2020, users rotated out of poorer quality DeFi projects
Augur REPv2 Prediction Markets 75.8% 233.8% into higher quality ones for sustainability.
Data sourced from Messari and CoinMarketCap. Representative of public performance for the year-to-date period or since first trading day for new assets.
1) Performance since January 1, 2020 or launch price through November 30, 2020. Most DeFi applications, to date, have been built atop the Ethereum blockchain. Thus, ETH, Ethereum’s
2) Performance since January 1, 2020 or launch price through YTD peak (which occurred between August and September 2020 for most assets).
native asset, benefitted from the growing DeFi application usage within and atop its network.
Ethereum’s onchain activity over the last year has thrived; according to Flipside Crypto, as of early
November, there were over 30,000 smart contracts created daily in the last 12 months and 15% of active
Ethereum addresses have interacted with DeFi on a recurring basis. As network activity increased,
demand for Ethereum block space grew, and this led to rising gas costs (Ethereum’s transaction fees)
and a surge in demand for ETH itself as the asset emerged as DeFi’s “directional beta” bet this year. If
investors didn’t want to take on considerable concentration risk on a single thinly traded DeFi asset,
they could play the narrative through a position in ETH and benefit from DeFi’s rising tide effect.
Alternatively, investors have increasingly sought out select active managers with DeFi expertise to gain
exposure to the sector.
Investors that put capital to work in this thematic sector of digital assets generally outperformed bitcoin
and the digital asset market beta in 2020.
06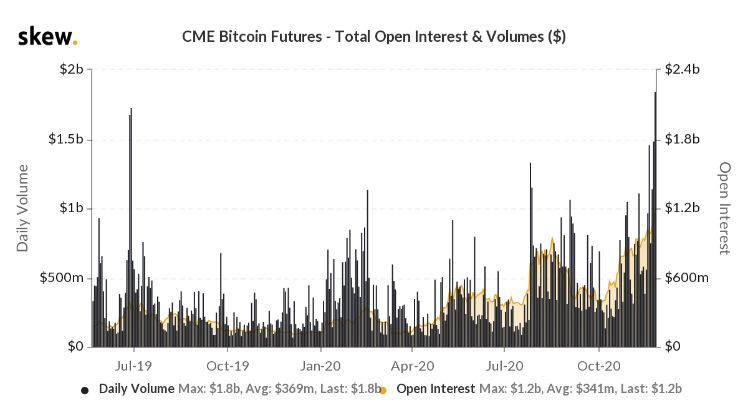
03. Digital Asset Yields Are Sustainable, For Now
                                                                                                                                         Platform (1)                            BTC               ETH               USDC                 Dai              USDT
     A major theme that emerged in 2020 was the rise in demand for yield on digital assets. Credit opportunities within crypto
                                                                                                                                         CeFi Avergage (2)                     5.7%               5.3%               9.8%              10.2%               10.2%
     started presenting themselves back in 2018, but it wasn’t until 2020 that this segment of the market started to gather steam.
                                                                                                                                         DeFi Average (3)                      6.1%               2.9%               7.9%               7.3%                7.1%
     There are three generic forms of yield generation in the crypto market: 1) spot borrowing/lending, 2) call overwriting, and
                                                                                                                                         OTC Desk Average (4)               4.0% - 6.0%        5.0% - 7.0%        7.0% - 10.0%      7.0% - 10.0%        7.0% - 10.0%
     3) yield farming, as touched on in Takeaway #2. All three remain in high demand as of Q4 2020, and this is largely driven by        General Mkt Average                   5.6%               4.7%               8.7%              8.7%                8.6%
     the attractive rates digital assets offer relative to the traditional markets.
                                                                                                                                         1) For illustrative purposes only. Actual lending rates will vary based on many idiosyncratic borrower factors.
     For context, Chase Savings pays a 0.01% annual percentage yield (APY). Competing big banks pay similar rates, which has             2) General averages of BlockFi, Celsius Network, Crypto.com and Nexo. While this constitutes a limited dataset,
     caused customers to seek high-yield savings accounts. But even those p.a. yields are capped around 0.50% to 0.60%.                  we believe these platforms dominate the CeFi lending market.
     Meanwhile, CeFi spot lending platforms like BlockFi, Celsius, Crypto.com and Nexo offer 8.6% to 12.0% APYs on USD-pegged            3) Data sourced from native DeFi platforms, loanscan.io, coinmarketcap.com and defiprime.com/defi-rates.
     stablecoin collateral deposits (particularly USDC and GUSD), nearly 15x to 20x greater than the highest traditional market          4) Lending rate ranges as quoted by major OTC lending desks. Rates are dynamic based on a variety of factors,
     high-yield savings account offering rate for the same (albeit synthetic) asset, the USD. The average p.a. stablecoin yield at the   including collateralization levels (LTVs), terms (fixed or open), putable or callable optionality, and more.
     time of writing on most DeFi platforms ranged from 7.1% to 7.9% for USDC, Dai, and USDT (three of the most popular USD-
     pegged stablecoins in the market) with some platforms, such as Yearn and Fulcrum, offering APYs as high as 18.9% to 22.0%
     p.a. Yields across other digital assets such as bitcoin (BTC) and ether (ETH) are also considerably more attractive than what
     most traditional market yields offer. BTC yields currently average around 5.7% APY across popular CeFi platforms, 6.1% APY
     across most DeFi platforms and range from 4.0% to 6.0% across the major OTC desks, whereas ETH yields currently average
     around 5.3% APY (CeFi), 2.9% (DeFi), and 5.0% to 7.0% (OTC), according to our research. This naturally begs the question of
     sustainability – when are these yields bound to compress? How much longer will this attractive earning power last, and just
     how secure are the DeFi protocols that offer them?

     To answer these questions, we must first understand how these yield markets are driven. Who are the institutional
     counterparties and borrowers generating this demand? A few come to mind: hedge funds, OTC decks, market makers and
     liquidity providers. Funds and liquidity providers focusing on arbitrage strategies need to borrow crypto in order to
     compress mispricing between exchanges and dislocated markets, particularly in the case of spot vs. futures (e.g., the basis
     trade), or for crypto-native staking arbitrage when staking yields exceed borrow rates. Margin traders need to borrow in order
     to execute their trading strategies, particularly those desiring to short sell certain assets. OTC desks need to keep inventory
     on-hand to connect buyers and sellers who do not wish to transact on public exchanges, largely to avoid frictions such as
     slippage, market impact, delays in execution, and more. Rather than owning crypto outright (a capital-intensive and volatile
     undertaking), these OTC desks typically borrow inventory to facilitate their transactions. The strength of these demand
     forces leads us to believe these yields are sustainable for the foreseeable future in this early and developing asset class.

     Finally, we also believe the yields offered by DeFi protocols are sustainable so long as collateral (loan-to-value or LTV ratios)
     and volatility (price action) are tightly managed. Since Black Thursday (March 12th), we have seen smart contract
     functionality and audits significantly improve, with coordinated decentralized working groups constantly debugging their
     software, particularly in the case of decentralized oracles that report market prices to these DeFi platforms.
                                                                                                                                                                                                                                                                       07
Sources: Vision Hill Group research, Genesis Capital Q2 2020 and Q3 2020 Digital Asset Market Reports.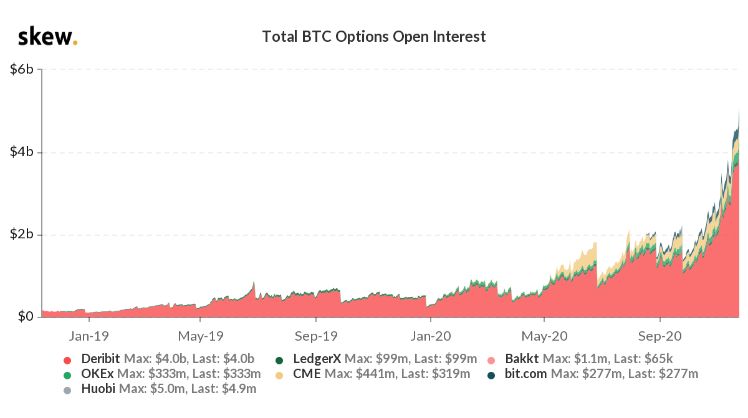
04. The Remarkable Rise, Fall, and Rise Again of Crypto Derivatives
                                     Crypto derivatives have made a fascinating comeback in 2020 after a challenging 2018-2019 market regime.
                                     The overhyped launches of regulated CME and Cboe BTC futures in December 2017 (which happened to be
                                     when the last bull cycle ended), saw brief traction that soon morphed into lackluster volumes in the face of
                                     declining price action. The daily notional value traded on the CME averaged approximately $170 million in
                                     mid-January 2018 and quickly dropped nearly -80% to approximately $40 million by early/mid February
                                     2018. During this same time, BTC’s price collapsed approximately -45% as the 2018 crypto bear market
                                     ensued. Almost a year later in March 2019, Cboe shut down their BTC futures offering as less attention was
                                     given to crypto among institutional investors. This marked a historic low point in crypto derivative history.

                                     There was a short-lived revival in futures volumes in Q2 2019 as BTC rallied +163.5% during the quarter;
                                     CME’s daily volumes reached a peak of $1.8 billion on June 26, 2019. However, 2H 2019 saw BTC’s price fall
                                     another -33.5% and this corresponded with another steep decline in CME futures where daily volumes hit a
                                     local low of approximately $70 million as of December 3, 2019. Despite the market pullback, three notable
                                     developments occurred in Q4 2019. Bakkt, a subsidiary of the Intercontinental Exchange, launched its
                                     physically-backed futures offering in September 2019 and then its BTC options platform in December 2019.
                                     Additionally, in September 2019, Skew analytics introduced its analytics platform, focused exclusively on
                                     crypto derivatives. Though these launches did not receive much fanfare, in hindsight they proved to be
                                     milestone accomplishments in revitalizing and institutionalizing the crypto derivatives market.

                                     Things significantly improved from there. At the start of 2020, the CME launched its BTC options offering
                                     to compete with Bakkt as one of the leading regulated derivatives platforms in the market. As asset price
                                     volatility returned, liquidity poured back into the market and both futures and options volumes surged to
                                     record levels throughout the year. CME BTC daily futures volumes recently peaked at $2.2 billion at the end
                                     of November 2020 while Bakkt BTC daily futures volumes peaked at $178 million just a couple months
                                     earlier in September. BTC and ETH options trading volumes also surged throughout the year as more
                                     platforms such as Deribit, FTX, LedgerX, Binance, Huobi, and OKEx (many of which remain unregulated),
                                     launched and/or scaled their offerings. The daily BTC options volumes reached their historic peak of $4.3
                                     billion at the end of November, with Deribit generating $3.6 billion (approximately 84%) of the total daily
                                     volume traded. At the same time, daily ETH options volumes peaked at $670 million, with Deribit
                                     generating $637 million (approximately 95%) of the total daily volume traded.

                                     “First a trickle and then a flood”, once the industry’s mantra back in 2018-2019, has proven true in 2020.

                                                                                                                                                  08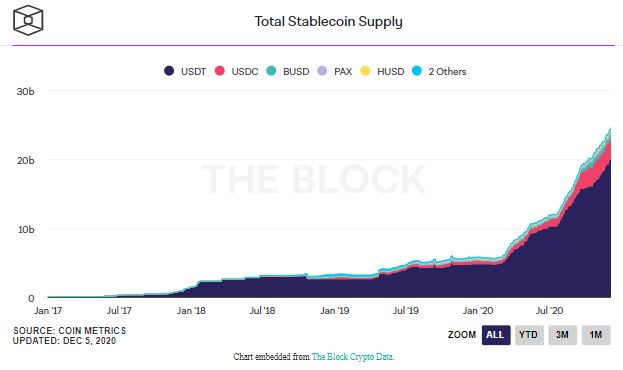
05. Crypto Hedge Funds Are Institutionalizing, But Some More Than Others
Crypto hedge funds exhibited early signs of maturation back in 2018 when managers started to transition from generalist                                                       Institutional Hedge Fund
investing to specialized strategy investing. Pre-2018, it was common to see many hedge funds trading or investing in largely the      Attributes
                                                                                                                                                                                     Best Practice
same set of digital assets across public and private markets with little differentiation. The notions of market beta and alpha did
not yet exist at the time; however, in the 2018 crypto bear market, risk management techniques started to emerge and that
                                                                                                                                       Transparent and Forthcoming
started the early transition among managers toward running specialized and differentiated investment strategies. Fast forward
to 2020, there are now a variety of beta and alpha-focused hedge fund strategies across three primary verticals: Fundamental,          with Information                               ✔️
Quantitative, and Opportunistic, as we have previously shown.
                                                                                                                                       Monthly Factsheet
While the above certainly reflected the beginning of the institutionalization of crypto hedge funds, to date we have seen a variety
of funds institutionalize themselves even further in preparation for growing institutional investor demand. One major attribute
                                                                                                                                       with Net Performance
                                                                                                                                       (net of all fees and expenses)
                                                                                                                                                                                      ✔️
of this continued maturation that stood out to us this year was the increasing number of monthly tearsheets (factsheets) that are
getting distributed in a timely fashion and reflect monthly performance net of all fees (both management and performance) and          Performance Reflects All Fund
                                                                                                                                       Investments
fund-level expenses from the perspective of a hypothetical “day 1” investor. Fundamental managers are also presenting
monthly net returns that include exposure to all their fund’s investments (e.g., including any and all side pocket investments         (e.g., not liquid-only portions of
                                                                                                                                       portfolio if there are side pockets)
                                                                                                                                                                                      ✔️
made to date), something we believe paints a much more accurate picture on inception-to-date performance. Another has been
the increasing level of concisely written commentary around a fund’s performance attribution and its source(s) of alpha in a
given month or quarter beyond general “macro” market commentary. Both these attributes reflect a boost to transparency, and            Commentary on Performance
we view this as a monumental step of progress for the institutionalization of crypto hedge funds. Other signs of maturation            Attribution and Sources of Alpha               ✔️
include quicker turnaround times for LP net asset value (“NAV”) reporting (we have recently seen this start to truncate from
more than~T+60 days to approximately ~T+45 days for the majority of VisionTrack contributors), completed DDQs, operational
                                                                                                                                       Completed Due Diligence
robustness including a growing team of dedicated professionals that specialize in back office functions to support front office
activities, and general improvements to risk management processes. The foregoing attributes are commonly expected among                Questionnaire (DDQ)                            ✔️
traditional market hedge funds, and it is encouraging to see many crypto hedge funds rising to those institutional “gold
standards” in preparation for the future.
                                                                                                                                       Operational Robustness and
However, not all managers have evolved with the times. There remain a handful of funds in the market that manage liquid
                                                                                                                                       Established Back Office                        ✔️
books and still report quarterly instead of monthly, report gross instead of net, report in a limited fashion on the liquid-only
portions of their books rather than the entirety of their portfolios (e.g., they don’t include side pocket performance in their        Established Risk Management
monthly performance numbers), have no DDQ, have extensively delayed NAVs and/or don’t discuss portfolio attribution or their
fund’s value proposition clearly. In fact, we have surprisingly even seen a few funds that have remained stuck in the 2017 crypto
                                                                                                                                       Processes and Techniques                       ✔️
market mentality in the sense they invest broadly and generally in the space in a “buy and hold” fashion, charge 2/20 despite
having large portions of their portfolios exposed to beta (bitcoin), and also show little to no evidence of running a risk-managed,
disciplined and repeatable alpha-generating strategy. While some of these funds could certainly continue to grow in the future
                                                                                                                                       Timely Monthly NAV Reporting
                                                                                                                                                                                      ✔️
and perform well, we have seen many others wind themselves down as a result of failed operations. According to our
VisionTrack database that currently tracks 385 global crypto hedge funds, approximately one in four managers have shuttered
their funds since 2017.
                                                                                                                                                                                                         09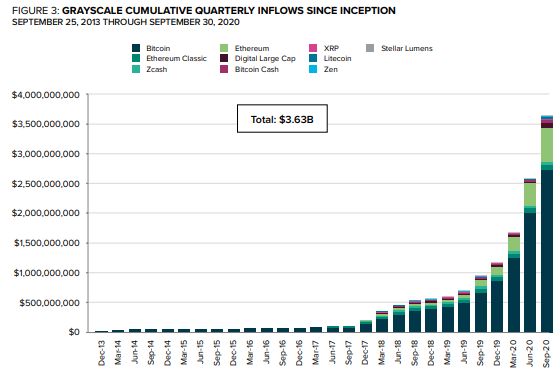
06. There’s Liquid and There’s Venture, But Liquid Venture is a Tougher Pitch
                                                    This is a topic we first wrote about in last year’s report. The distinction between liquid hedge fund strategies and illiquid
                                                    venture fund strategies continues to be clear. Hedge funds have short-term investment horizons, typically spanning from six
      Crypto Fund Venn Diagram                      months to two years, and focus primarily on investing in the liquid market. Conversely, venture funds have long-term
                                                    investment horizons, typically spanning 10+ years, and focus primarily on investing in the private (illiquid) market. Both
                                                    these strategies have scaled well in the market so far; in 2020 we have witnessed venture funds raising an estimated $2.3
                                                    billion of capital for new funds while crypto hedge fund AUMs have grown to approximately $2.4 billion according to data
                                                    captured in VisionTrack. However, the digital asset market continues to have its fair share of hybrid “liquid venture” funds
                                                    that attempt to capture the best of both the liquid and private worlds. While the opportunity set for such funds is certainly
                                                    expanded, such strategies are not without their complexities and challenges.

    Hedge Funds              Venture Capital        First, liquid venture funds with short-term lock-up periods making frequent illiquid investments can run the risk of creating
                                                    an asset-liability mismatch if they are not careful with the fund’s liquidity and/or do not align their investment interests or
                                                    expectations with their limited partners (“LPs”). If a fund’s lock-up period expires for an LP, and the LP wants a full
    Primarily Liquid           Primarily Illiquid   redemption, but finds the fund is too illiquid, the fund could be unable to meet the LP’s redemption request in full in a
      Short-Term                  Long-Term         timely fashion. This can be detrimental for LPs in need of liquidity. Second, many hybrid funds utilize side pockets to make
      (6-24 months)                (10+ years)      their private investments; these side pockets are typically created at a defined point in time and are only available to existing
                                                    LPs as of that point in time. Thus, new LPs that enter the fund in the future will not gain exposure to the existing private
                                                    investments made. This can create a potential misalignment of interests between LPs and the manager absent proper
                                                    disclosures and communication. Third, there are challenges surrounding when investments rotate out of side pockets and
                                                    into the main funds; if such transitions occur based on parameters such as sufficient liquidity, which is a very difficult thing
                  Liquid Venture                    to define in these thinly traded, early digital asset markets, managers must consider the potential dilutive impact to LPs in
                                                    the side pocket that held the risk of those investments since inception. Once in the main fund, all LPs share in the upside of a
                                                    given investment, however, in some cases, only a fraction of the fund’s LPs bore the risk of that investment since the
                   Liquid + Illiquid                manager’s entry. Thus, it is extremely important for managers to work closely with their fund administrators and auditors to
                  Short + Long-Term                 create detailed valuation policies for side pockets and illiquid assets. We remain strong advocates for fair market value (FMV)
               Side Pocket Complexity               approaches, not cost basis, if there are observable prices and for marking of positions with simple over complex approaches
                                                    that are transparent for LPs. Finally, a performance related observation that we believe is especially relevant in a rising
                                                    market: these venture-like illiquid positions in a side pocket can act as a drag on upside performance for a period of time
                                                    until they become liquid or have an opportunity for monetization, since they are often conservatively held at FMV (which
                                                    often coincides with entry price) until such a liquidity event occurs (or does not occur).

                                                    In our experience, few funds in the market have been able to scale hybrid liquid venture strategies well. While there are
                                                    certainly some who have, we believe the side pocket era for crypto hedge funds is beginning to sunset as more institutional
                                                    investors enter the market and prefer simplicity over complexity, especially for allocators with stricter parameters for
                                                    bucketed hedge vs. venture strategies based on liquidity, reporting, and investment horizon duration limitations.                   10
07. Simplicity Prevails: How The Easy Trades Continue to Win (and Scale)
Throughout 2020 we continued to see investors prefer the simpler trades in the market. One of the most popular examples of
this is the success of Grayscale’s investment trust products. Given the lack of a regulated Bitcoin ETF, investors have sought
high quality, single asset vehicles, specifically bitcoin-only ones, to express their investment thesis in digital assets.
Grayscale’s GBTC bitcoin product has grown from $1.8B AUM in January to $10.2B AUM as of the end of November. While
the investment trust provides a high-quality product for many new institutional investors looking to hold bitcoin in their
portfolio, it also benefits from a structural regulatory arbitrage trade.
The strategy behind this trade is simple. Buying digital assets directly remains a somewhat burdensome undertaking for the
average newcomer, particularly the retail investor, and such an investor is more likely to want to gain exposure to digital
assets through existing brokerage accounts rather than having to worry about creating a new crypto-native wallet on an
unfamiliar company’s platform and then deal with the headaches of custody and security risks. A handful of the Grayscale
trust products trade as liquid shares on the over-the-counter (“OTC”) markets and are accessible through most traditional
brokerages. Thus, they are able to plug into this strong retail market demand. The supply side (the other side of the trade)
entails accredited investors subscribing to the Grayscale trusts at their net asset values (“NAVs”) (not their OTC market
prices), subject to a defined lock-up period (typically 6-12 months) before having the option to trade their unrestricted shares
via the OTC markets. When the demand for OTC shares continuously exceeds the demand for NAV subscriptions, the OTC
prices trade at a premium to the NAVs. This has generally been the case historically across Grayscale’s products given the
extensive delays by regulators in approving the creation of publicly traded crypto-focused ETFs and mutual funds. Thus,
accredited investors can “arb” the current regulatory regime by acquiring shares in the Grayscale trusts at NAV, holding those
restricted shares until their respective lock-up periods expire, and then selling them for a premium in the OTC markets. As
shown on the right, not only have these trades been widely popular in the market, they have also scaled exceptionally well. At
the time of writing, Grayscale’s platform AUM stood at $12.6 billion.
There are a few other examples of successful investment strategies that remain simple in nature and have scaled well. In
“
addition to the Grayscale trusts, other bitcoin-focused single asset vehicles and multi-asset index funds have also exploded in
popularity in 2020 and comprised approximately $800 million in aggregated AUM according to VisionTrack at the time of
writing. The value proposition of these passive vehicles is simple: when investing in an early-stage asset class, capture the Diversification will also help investors capture the industry’s upside, as
beta first. It is thus not that surprising to us that institutional allocators have been converting nicely here. We believe it is returns are likely to be generated by a small subset of companies and
just a matter of time until crypto fund-of-funds (“FoF”) strategies also start rising in popularity in a similar fashion, as a way projects. For smaller portfolios that cannot diversify across managers as
for institutional allocators to pick up diversified exposure to “everything else” via one allocation to actively managed easily, investors should consider allocating to a fund-of-funds or an index
strategies to supplement their beta exposure. fund to gain exposure.
We would be remiss if we didn’t acknowledge how venture capital funds in crypto have also scaled well over the last few years. - Cambridge Associates, Cryptoassets, Venture into the Unknown (February 2019)
We believe much of the success behind venture strategies has been attributable to the plain vanilla, simple structures they
offer – typically 2/20 and a 10-year investment period – rather than the thematic investment areas they specialize in. Given
the “early-stage tech” nature of crypto, it has been easier for larger allocators to consider crypto venture funds as an
extension of legacy fintech funds than to internally pitch the case for creating an entirely new portfolio category exclusively 11
for digital assets.08. As the Bull Returns, Beta Competes Against Venture For Capital
Traditionally speaking, in established markets investors understand that higher returns won’t typically get generated
without taking higher risks. Given the annual S&P 500 return over the last five decades averages just 9.0%, it is of little
surprise that some capital has shifted from public markets to private ones, particularly in venture capital, in search of
those higher returns. Historically, as depicted on the left, Index Ventures shows that most venture funds target 1.5x to 3.0x
net returns across early stage, growth, and later stage investments over an 8- to 10-year average holding period. While
start-up companies have the highest return potential (10x+ multiple), they also have the highest loss rate (greater than
65.0%), thus making such strategies challenging to execute well in a disciplined and repeatable fashion. According to data
sourced from Cambridge Associates, only the top 5% of venture funds tend to generate return multiples in excess of 3.0x
on average; the upper quartile and median return multiples across observed venture capital funds tended to range from
approximately 1.4x to just under 2.0x on average, with lower quartile performers generating average return multiples
under 1.0x. Thus, proper manager selection is critical, and as industry data shows, the odds are against most investors
when attempting to achieve 3.0x+ return multiples over 8- to 10-year time frames.
Conversely, if we observe the beta returns generated in the digital asset market (BTC and ETH in this context) since
inception and, particularly, over the prior bull cycles, we find something interesting: these beta assets have consistently
Digital Asset Beta Return Multiples (1) outperformed venture fund returns in a fraction of the time period and both offer substantially improved liquidity over
2012-2013 2016-2017 2020+ ITD venture funds as well. This goes back to what we briefly highlighted in Takeaway #7 previously: there is a strong incentive
to capture the beta first when investing in an early-stage asset class, especially when a bull market is underway. While
Name Ticker Bull Market Bull Market Bull Market Return (2)
these assets have historically not been the easiest to directly acquire primarily due to custody, security and reporting
Bitcoin BTC 235.0x 49.0x 2.7x 77,880.3x complexities, in the last 12-24 months we have witnessed the industry substantially improve accessibility through single
asset vehicles, index funds and separately managed account structures, all of which offer substantially cheaper fees
(generally in the range of 0.75% to 3.0% for management fees with no performance fees, per VisionTrack data) than
Ethereum ETH n/a 1,567.7x 4.7x 409.6x traditional venture funds that normally charge 2/20.
1) Data sourced from Messari and CoinMarketCap. Bull market metrics represent low-to-high returns generated during observed periods.
2) Represents inception-to-date return through November 30, 2020.
It is worth noting that despite the strengthening case for holding digital asset beta in a bull market regime as opposed to
locking up capital in a venture fund for 8- to 10- years, we believe venture funds offer substantial diversification benefits to
investors and should supplement existing beta allocations rather than compete with them. Additionally, venture
strategies in an early market, like digital assets, likely offer the opportunity for a larger potential number of outsized
KEY TAKEAWAY winners, which could lead to better than average historical return multiples. While the two buckets may inevitably
compete for capital among some investors, we would be remiss if we did not mention the extensive volatility passive
digital asset beta allocations encounter, and more notably, the near -75.0% drawdowns these assets both experienced
As shown above, investors that allocated to venture funds as of
during the last bear market in 2018. As valuations were pulled down across the market during the bear market, venture
January 1, 2020 expecting a 3.0x return multiple over 8-10 years would have funds with dry powder on hand were able to take advantage of the opportunities in front of them by investing in early-stage
achieved 90% of their return target and remained liquid in just the first 11 months deals at attractive entries with 10x+ return potential. In hindsight, not all these investments were successful as several
of 2020 if they allocated to BTC instead. An allocation to ETH would have projects got stalled due to regulatory challenges, but many others continue to show promise as of the end of 2020.
performed even better (4.7x return). Additionally, some crypto venture funds allocate a portion of their portfolios to digital asset beta, so a sole allocation to
venture does not necessarily exclude investments to BTC and ETH, depending on the manager. 1209. Stablecoins Have Become the Market’s Unsung Heroes
Back in 2017, bitcoin (BTC) dominated the crypto market by various measures. Not only has BTC consistently been
the industry’s largest and most liquid digital asset, back then, the tradeable market was structured in such a way that
nearly all digital assets were BTC-denominated and could generally only trade on exchanges with BTC as the bridging
cross-asset pair. Additionally, it was challenging to access stable banking channels, and despite the attempts by over-
the-counter (“OTC”) desks to make the market more institutionally accessible by facilitating trades between
institutional buyers and sellers who did not wish to transact on public exchanges, liquidity remained poor, and
spreads between venues were often in the single-digit percentages.
Things then started to improve in 2018 with the emergence of stablecoins like Tether (USDT), USD Coin (USDC),
TrueUSD (TUSD), and Dai, among others. The rise of these stablecoins boosted liquidity in the crypto market and
enabled digital asset trading to become cheaper, faster, and stablecoin-denominated. Derivatives volumes, as we
addressed previously in Takeaway #4, grew significantly since this time and now comprise 4.6x the size of spot
volume on average according to a recent Q4 2020 report issued by U.S. crypto exchange Kraken. Bid-ask spreads have
also collapsed across the board from as high as nearly 2.0% back in 2017 to single-digit basis points on average as of
the end of 2020, according to our research. Additionally, since 2018, OTC execution has become automated as clients
now plug in directly to the OTC platforms, stream quotes and execute trades all of which are powered by application
programming interfaces (these APIs enable the interaction between multiple software intermediaries). Furthermore,
as we addressed in Takeaway #3, the burgeoning credit market within digital assets has, in large part, been enabled
by stablecoins, as trading firms and market makers can leverage those assets to facilitate their transactions with
significantly greater capital efficiency. It should therefore come as a shock to none that the market capitalization of
stablecoins has nearly quadrupled from just under $5 million in 2019 to nearly $20 billion in 2020 and that
stablecoins have also emerged as the most liquid trading pairs for most of the market’s large cap digital assets.
Additionally, Facebook’s June 2019 announcement of the Libra stablecoin (now Diem) caught the attention of the U.S.
Senate and House of Representatives, and every Fortune 500 company, as every major news outlet at the time pushed
stablecoins, bitcoin, Libra/Diem, digital assets, and crypto at large into the mainstream conversation. Throughout
2020, U.S. regulators, alongside many U.S. businesses, continued to make progress on strategic initiatives related to
digital assets and blockchains, particularly as it relates to payments and central bank digital currencies (“CBDCs”) in
response to China’s imminent launch of its digital yuan, the DCEP (digital currency electronic payment). As of Q4
2020, recent rulings by both the SEC and FinCEN have started to ease regulatory concerns for digital asset trading in
the U.S. and have further edged stablecoins closer to being used as viable currencies.
For all these reasons and more, we believe stablecoins have become the digital asset market’s unsung hero as they
have played a vital role in transforming the market into becoming more institutionally accessible.
1310. From Speculators to Allocators: Witnessing Crypto’s Investor Maturation
While the crypto industry has witnessed some occasional institutional moments since 2018, none quite resulted
in direct price appreciation the way 2020’s institutional movement did. Despite its occasional parabolic ascents
(which are a byproduct of bitcoin’s absolute scarcity), bitcoin’s meteoric rise this year has largely been linear, with
spot volumes at times outpacing the rapidly growing derivatives volumes. This suggests that throughout the year
there has been a much more sustainable version of price discovery in bitcoin relative to the 2017 bull market
when we last tested the $20,000 high for bitcoin. Additionally, as of November 30, 2020, the Google search trends
indicator for bitcoin stood at 21, implying that the number of individuals searching for bitcoin on Google was
about 1/5th that of the peak that we witnessed in the 2017 bull market that was led by retail. These factors,
combined with the surging volumes across regulated derivatives exchanges like the CME and Bakkt that we
covered in Takeaway #4, confirm this year’s bull run has primarily been driven by institutional investors.
Bitcoin’s value proposition as a digital store-of-value was also given a boost as billionaire hedge fund manager
Paul Tudor Jones revealed in May 2020 that the Tudor Group investment corporation holds a bitcoin futures
contract position and subsequently doubled down on bitcoin as the “best inflation hedge” in October 2020. His
view that the U.S. is entering an environment of unprecedented fiscal expansion and quantitative easing by the
Fed, that is expected to result in a wave of inflation to the U.S. economy became shared by others in the macro
community as well. Following Jones, Rothschild Investment Corp. started making bitcoin purchases in October
through Grayscale’s Bitcoin Trust. Fidelity, a long-term supporter of bitcoin, released a report to the public in
mid-October detailing the portfolio benefits of a hypothetical 5% allocation to bitcoin. JP Morgan also disclosed
to investors in an October investor letter that the bank believes bitcoin has “considerable” upside in the long-
term as it competes better with gold as an alternative store of value. Also, in October, legendary hedge fund
investor Raoul Pal described bitcoin as “the best trade he’s ever found” and the “world’s most pristine reserve
asset” and disclosed his company Real Vision invested 10% of its cash holdings in bitcoin. In early November,
billionaire U.S. investor Stanley Druckenmiller revealed on CNBC that he owns bitcoin, in addition to gold, for
similar reasons discussed above, and that he is anticipating a three- to four-year decline in the U.S. dollar. By
mid-November we saw a senior analyst at Citibank disclose a $300,000 bitcoin price prediction by
December 2021, and at the end of November the Guggenheim Funds Trust filed an amendment with the U.S. SEC
to allow its $5.0 billion Macro Opportunities Fund to gain exposure to bitcoin by investing up to 10% of its NAV in
the Grayscale Bitcoin Trust. At that same time, the research arm of investment giant Alliance Bernstein reversed
its previous stance and disclosed its belief that bitcoin has a role in investor’s portfolios. December opened with
a rare positive statement (and possible tacit endorsement) on bitcoin by BlackRock’s Larry Fink saying it “caught
the attention and the imagination of many people.” Corporates have also joined the conversation with Square
and MicroStrategy buying bitcoin as part of their corporate treasury allocations, and PayPal creating crypto
trading and payment services for its 360 million users.
The table on the left presents a snapshot of the public and private companies that own bitcoin. Based on the
above, it is evidently clear that we are witnessing the maturation of crypto investors and experiencing a global
shift from speculation to allocation.
14PART II.
What Comes Next?
A 2021 Look Ahead
15What Comes Next? A 2021 Look Ahead
When we wrote about our 2020 outlook in last year’s report, we did not anticipate the unprecedented impact COVID-19
would have across the globe. From the lows of March to the highs of November, 2020 has thus far shaped up to be an
exceptionally volatile year. While many markets and industries remain under pressure, the digital asset industry appears
to have not just survived this year, but rather thrived. Is this because digital assets are untethered to the unprecedented
fiscal expansion and quantitative easing inherent in the traditional markets? While that may partly be the reason, we
believe the main reason is because the industry is fueled by tech-savvy individuals that are used to distributed work and
used to running operationally lean. It is also worth remembering that bitcoin was born in a time of massive market stress
during the global financial crisis of 2008-2009. Despite the heavy volatility in March 2020, blockchains have yet again
shown their resiliency as technologies and as investment assets, free from any political or government oversight. While
global equity and debt markets required the aid of the U.S. Fed to come to the rescue this year, bitcoin and digital asset
markets continued to function independently throughout the year despite encountering and overcoming certain pains of
their own.
So, what comes next for 2021? The outlook largely depends on whether we can get COVID-19 under control. As of
December 2020, we are seeing global equity markets anticipating a vaccine-driven rally ahead of quicker-than-
anticipated (albeit staggered) economic cross-sector recoveries following the November vaccine announcements.
Optimism around further government stimulus, both in the U.S. and globally, also continues to push markets in a
positive direction. Both these factors are eclipsing worries about the near-term economic outlook and are driving a risk-
on mood in the markets, especially crypto.
We believe we are in the early phases of a 12-24 month bull market cycle in digital assets as part of a multi-decade long
investment opportunity. While the last speculative hype cycle in 2017 was led predominantly by retail investors, this cycle
is led by high quality institutional capital entering the space, as we noted in Takeaway #10. Crypto investing is
increasingly moving from speculation to allocation. Thus, as we move into 2021, it will be even more important to have a
dedicated and intentional strategy to express the digital asset investment thesis. The smartest investors will continue to
stay one step ahead of the crowd, investing at the edge of innovation and thus capturing the greatest alpha. While many
global investors continue to awaken to the important role of bitcoin in a modern portfolio, the smartest investors will
already be looking ahead to the next waves of innovation to capture edge in DeFi, non-fungible tokens (“NFTs”), Web 3.0,
sovereign identity, scalability, advertising, gaming, prediction markets and social blockchain networks.
There are now many different ways to invest into the growing digital asset class, as illustrated on the right. We discuss
each of these strategies in more detail in the following slides.
16
Source Image copyright of Vision Hill Group Inc.Passive Beta Strategies
Passive Strategies can be accessed via single asset vehicles (e.g. BTC only) or Index
Funds for multi-asset exposure.
BETA:
• Passive strategies offer predictable and dedicated exposure to certain digital assets
• Single asset (e.g. BTC or ETH) or diversified exposure (e.g. Top 10) depending upon the product
• In some cases, passive beta vehicles provide a lower cost/fee alternative to active management, but
not in all cases
• Generally, only charge management fees, not performance fees
2021 OUTLOOK:
We believe bitcoin (BTC) will continue to be the first stop for many allocators that are new to digital assets. It is
reasonable to assume that in order to build conviction in this asset class, allocators need to get comfortable
with the general notion of how a blockchain works, and why its value proposition is unique relative to
everything else in their investable universe (that may also come with longer and more established track records
of success). In 2021, investors are also likely to expand their definition of beta to include Ethereum (ETH) in
addition to bitcoin. ETH is the industry’s second largest asset by network value (~$63 billion currently) and is
Reported AUM in VisionTrack: $13.6 billion complementary to bitcoin as a base layer smart contract platform and programmable money network.
As we previously addressed in Takeaways #7 and #8, there are strong incentives for investors to maintain
simplicity and capture the beta first when entering an emerging market. It is therefore not surprising to us
that passive beta strategies have accumulated a whopping $13.6 billion of AUM according to VisionTrack. We
expect this AUM to continue to increase significantly in 2021.
17
Source Image copyright of Vision Hill Group Inc.Venture Fund Strategies
Venture Funds in crypto generally focus on equity only, tokens only, or equity and tokens
across various stages.
VENTURE:
• Finance very early development of new projects
• Traditional venture structures of long investment and harvesting period (~10 years)
• SAFT, SAFE, seed, series, pre-sale investments, and vesting illiquid tokens
• Stage Focus (Seed, Series A, Series B, Growth) and Geographic Focus (US, Asia, etc.)
• Thematic Focus (Infrastructure, Gaming, Future of Work, DeFi, Layer 1 and Layer 2 protocols)
2021 OUTLOOK:
We believe we will see continued growth of dedicated crypto venture fund strategies into 2021 as many of the
early venture funds in the space return to market to raise subsequent funds (Fund II or Fund III) on the back of
successful early track records for their initial funds. While a dedicated crypto venture fund as a unique category
might have been a differentiator in the early days, in 2021 more focus is likely to turn to thematic differentiation Estimated AUM: > $10.0 billion*
(e.g. DeFi vs. infrastructure), structural differentiation (equity vs. tokens), stage differentiation (pre-seed, Series
A, growth stage), and geographic differentiation (US, Asia, Emerging Markets, etc.).
*Crypto Venture Fund Data is currently not yet available in
VisionTrack, but will be soon. Per internal research, we estimate the
For some investors, venture will be the preferred first stop to gain digital asset exposure as it maps well to the aggregate crypto venture fund AUM as of Q4 2020 to be in excess of
way they think about the space – an investment in an early-stage technology that will take years to play out. We $10.0 billion.
expect to see some investors push venture funds in 2021 to justify a path to above-average expected returns vs. an
allocation to liquid markets given the opportunity cost and liquidity tradeoffs we touched on in Takeaway #8.
18
Source Image copyright of Vision Hill Group Inc.Hedge Fund Strategies
Crypto hedge funds are segmented by strategy into three primary categories:
Fundamental, Quantitative and Opportunistic.
FUNDAMENTAL:
• Deep value research
• High conviction asset selection
• Tactical, catalyst, and event driven positioning
QUANTITATIVE:
• “Risk-on”/”risk-off” models
• Directional or market neutral / zero beta
• Algorithmic momentum, trend following, mean-reversion, arbitrage & HFT systematic trading
OPPORTUNISTIC:
• Credit and yield driven strategies
• Options, derivatives, and volatility strategies
2021 OUTLOOK:
Crypto hedge funds grew in popularity in 2017 as effective investment vehicles to get exposure to the growing digital asset
class when regulated onramps and infrastructure weren’t yet fully established. As that infrastructure was built out over
the last 3 years, investors have started to push back on paying fees (2/20) for fund strategies that simply maintain most of
their exposure in bitcoin or beta. As we’ve noted, there are now much easier ways to capture the beta opportunity in a
lower cost way. That said, we believe dismissing actively managed crypto hedge funds would be missing an enormous
market opportunity. In 2020, we have seen crypto hedge funds outperform passive beta strategies, as noted in Takeaway
Reported AUM in VisionTrack: $2.4 billion #1, through careful asset selection, demonstrating proven alpha.
We believe 2021 will be a breakout year for crypto hedge funds. With an expected bullish market regime, we expect
idiosyncratic asset selection will present opportunities for differentiated and uncorrelated alpha. While large cap digital
assets may garner most of the attention of investors, it is likely that higher beta, mid- and small-cap assets will capture
potential outsized returns as some of these assets grow into the market leaders in their respective thematic categories. 19
Source Image copyright of Vision Hill Group Inc.Preparing for 2021
As evidenced in our top 10 takeaways of 2020, bitcoin continues to be the first stop for many investors looking to gain
exposure to the nascent and growing digital asset class. While this remains a perfectly acceptable way of expressing the
digital asset thesis, it is just scratching the surface of the overall investment opportunity in this early asset class.
Investors should consider approaching the space with the same dedicated, thoughtful, and comprehensive approach they
would take with any other investment vertical, such as equities, credit or real estate. This begins with understanding the
overall opportunity set, categorizing the different types of investments, their risk and return profiles, investment horizons
and durations, and liquidity. The next step is then gathering the best data possible to make more informed and smarter
investment decisions. For individual market assets or direct company investments, that means conducting deep research
on the token, project, network and/or business model. For fund allocations, that entails gathering the best buy-side
performance and fund information data in the market for necessary relative value and cohort analysis.
Creating a Dedicated Digital Asset Investment Strategy
To create an intentional allocation strategy, investors should start by asking the right questions:
• What is the opportunity cost of NOT allocating to digital assets?
• What is your risk tolerance?
• What are your return expectations?
• What is your time horizon?
• What are your liquidity needs?
• What sources of information, data, and research are you utilizing to weigh and compare different strategies?
• Do you have the in-house expertise to properly map and diligence the investment landscape or should you look to
outsource or supplement your existing capabilities?
Depending on answers to these and other questions, investors can begin to formulate a plan, seek out the right external
resources, and determine an allocation strategy that suits their unique needs.
The future is bright for digital assets. Let us know how we can help at info@visionhill.com.
20You can also read