Analysis of Housing Consumption and Opportunities - PART C - APPENDICES (.id, 2016)
←
→
Page content transcription
If your browser does not render page correctly, please read the page content below

PART C – APPENDICES

5. Analysis of Housing
    Consumption and
    Opportunities
    (.id, 2016)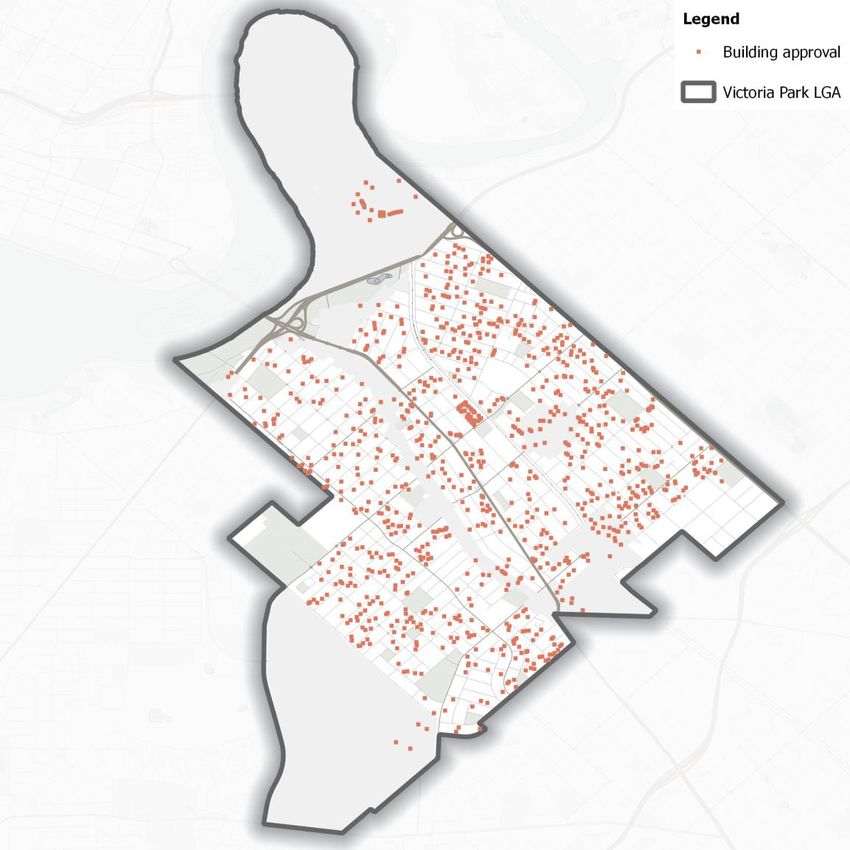
Town of Victoria Park
housing.id

Analysis of housing consumption and opportunities

                                                    September 2016
Town of Victoria Park – housing.id

Table of contents

1. Introduction................................................................................................ 5
   1.1     Objective ..................................................................................................... 5
   1.2     Context ....................................................................................................... 5
   1.3     Approach..................................................................................................... 6

2. Residential demand ................................................................................... 8
   2.1     How is the population changing?................................................................. 8
     2.1.1       How has the age structure changed? ................................................... 8
     2.1.2       How will the age structure change in the future? ................................ 10
     2.1.3       Who is leaving and who is arriving? ................................................... 12
   2.2     How are households changing? ................................................................ 15
     2.2.1       Households and suburban lifecycles .................................................. 15
     2.2.2       Current households ............................................................................ 17
     2.2.3       Emerging households ........................................................................ 19
     2.2.4       Larger (family) households ................................................................. 20
     2.2.5       Smaller households............................................................................ 21
     2.2.6       How will households change in the future? ........................................ 23
   2.3     How is the dwelling stock changing? ......................................................... 25
   2.4     What dwellings do households live in? ...................................................... 29
     2.4.1       Couples with young children .............................................................. 30
     2.4.2       Young couples without children .......................................................... 33
     2.4.3       Middle aged lone person households ................................................. 36
     2.4.4       Older lone person households............................................................ 39
     2.4.5       Young lone person households .......................................................... 42
   2.5     What is our level of housing stress? .......................................................... 44
     2.5.1       Definitions .......................................................................................... 44
     2.5.2       Breakdown of households by income and housing stress .................. 45
     2.5.3       Mortgage stress ................................................................................. 47
     2.5.4       Rental stress ...................................................................................... 48
     2.5.5       Differences in housing stress between household types .................... 48
     2.5.6       Summary ........................................................................................... 48
   2.6     Is housing in our area affordable? ............................................................. 49
     2.6.1       What is affordable housing? ............................................................... 49
     2.6.2       Household income and housing ......................................................... 51

                                                                                                                               3
Town of Victoria Park – housing.id

     2.6.3        Renting in Victoria Park ...................................................................... 52
     2.6.4        Rental Affordability Conclusions ......................................................... 56
   2.7     Home buying in Victoria Park .................................................................... 57
   2.8     Policy implications ..................................................................................... 62
     2.8.1        Regeneration ..................................................................................... 62
   2.9     Larger dwellings ........................................................................................ 63
     2.9.1        Increasing density .............................................................................. 65
     2.9.2        Declining average household size? .................................................... 66

3. Residential supply ................................................................................... 68
   3.1     Where is residential development occurring? ............................................ 68
   3.2     Opportunity for future residential development .......................................... 71
     3.2.1        Opportunity for development in Activity Centres ................................. 71
     Methodology .................................................................................................... 72
     Assumptions .................................................................................................... 80
     Results ............................................................................................................. 84
     3.2.2        Opportunity for infill and other residential development outside Activity
     Centres 85
     Methodology .................................................................................................... 85
     Lot size analysis by location ............................................................................. 87
     3.2.3        Major development supply assessment – strategic redevelopment sites
                  90
   3.3     Housing supply summary .......................................................................... 91

4. Conclusion – housing opportunities in the Town of Victoria Park ............ 92
   4.1     Housing consumption ................................................................................ 92
     4.1.1        The dominant group ........................................................................... 92
     4.1.2        The emerging group ........................................................................... 93
   4.2     Housing opportunity .................................................................................. 94
   4.3     Policy considerations ................................................................................ 95

5. Glossary .................................................................................................. 98

                                                                                                                                4
Town of Victoria Park – housing.id

1. Introduction

1.1 Objective

The Town of Victoria Park is in the process of developing a Local Housing Strategy
and as such require an understanding of the changing demographic and housing
patterns within the Town. The 2011 Census data, coupled with an update to the
forecast.id product in January 2016, presents an opportunity to provide an analysis of
housing supply and changing demographics. This information will form the evidence
base underpinning the development of the new housing strategy.

To assist in preparing the housing strategy, Council has commissioned .id (Informed
Decisions) to undertake an analysis of housing consumption patterns and
opportunities. It also includes an assessment of centres identified by Council as
appropriate for intensification and their potential dwelling capacity, as well as an
assessment of housing stress and affordability in the Town. The benefits of
undertaking this analysis include:

       meeting critical local needs of changing household types and increase local
       housing choice for residents
       addressing affordability by increasing supply
       sustaining Council’s facilities and services base in response to changing age
       structures and housing consumption patterns
       protecting valued areas from inappropriate development
       providing an evidence based incorporating data from the 2011 Census
       providing the appropriate tools and information required to achieve planning
       outcomes

1.2 Context

Over the past decade, Western Australia has been experiencing a population boom,
driven by mining and related economic activity. People were attracted to the state
from all over Australia and overseas, and the net number of migrants peaked in 2012
at approximately 75,000. However, recent economic and demographic data shows
that this boom is starting to slow. Overseas migration dropped dramatically after

                                                                                                  5
Town of Victoria Park – housing.id

2013 and from 2014 Western Australia has recorded negative net interstate migration
ie more people are moving out of the State than in.

That said, the metropolitan area of Perth is still expected to grow by between 30,000
and 40,000 residents each year, and the Town of Victoria Park will play an important
role in housing many of these new residents, and others already located in Perth. In
common with many inner city areas in urban Australia, Victoria Park attracts large
numbers of young adults and professionals both from neighbouring Perth councils as
well as interstate and overseas. The metropolitan strategy for Perth – Perth and
Peel@3.5million – seeks to encourage more infill development in established areas
in order to reduce urban sprawl, and the Town of Victoria Park has an important role
to play in this regard.

The Town’s location in inner Perth means that it is an established part of the urban
fabric. Consequently, future development opportunities are dependent on the
availability of strategic sites, opportunities for infill, as well as Transport Oriented
Developments (TOD). Constraints on infill development include heritage areas as
well as the fact that large parts of the Town, particularly east of Albany Highway,
have already undergone significant amounts of infill development. Significant
development opportunities have been identified in Burswood, consisting largely of
medium and high density apartments, both on the Burswood Peninsula and in the
Causeway Precinct.

1.3 Approach

This report is presented in two parts. Part A presents an analysis of recent and likely
future trends in the demand for dwellings in the Town of Victoria Park, primarily using
Census data. It also includes an assessment of housing stress and affordability.
Part B assesses the supply of dwellings to identify dwelling opportunities in the Town
before drawing policy conclusions.

Part A: Understand housing consumption in relation to supply and demand by
addressing the following questions:
        how is the population changing?
        how is age structure changing?
        who is leaving and why?
        who is attracted to the area?
        how are households changing?

                                                                                                     6
Town of Victoria Park – housing.id

      how has the dwelling stock changed?
      who is living in what type of household and dwelling?
      what is our level of housing stress?
      is housing affordable in our area?

Part B: Quantify residential supply opportunities in the context of where recent
development has occurred and where it could occur:
      in designated Activity Centres
      on specific sites – Strategic Redevelopment Areas
      on underutilised residential lots

                                                                                            7
Town of Victoria Park – housing.id

2. Residential demand

2.1 How is the population changing?

At 30 June 2015, the population of Victoria Park was estimated to be 38,450,
representing an average annual growth rate of 2.7% over the previous five years.
This is on par with a figure of 2.7% for the Perth Greater Capital City Statistical Area
(GCCSA) (Greater Perth). Much of is growth has occurred through higher rates of
residential construction, typified by the high rise apartments that now form part of the
skyline on the Burswood Peninsula.

The growth rate of Victoria Park has moderated slightly since 2014, in line with wider
demographics trends affecting Western Australia in the post mining boom era. This
includes lower levels of net overseas migration, and a loss of residents to other parts
of Australia ie net interstate migration loss.

2.1.1 How has the age structure changed?
In 2011, the age structure of Victoria Park was relatively different to that of Greater
Perth (Figure 1). Victoria has larger proportions of young adults (20-34 years) and
also of elderly (80+ years). In contrast, the proportion of young children (0-14 years)
is much lower in Victoria Park, particularly for the cohort 10-14 years (3.4% in
Victoria Park, 6.4% in Greater Perth). Victoria Park also has slightly lower
proportions of older adults (35-64 years).

                                                                                                  8
Town of Victoria Park – housing.id

    Figure 1.     Age structure, Victoria Park and Greater Perth – 2011
  % 14

       12

       10

        8

        6

        4

        2

        0

                                        Victoria Park     Greater Perth

Source: ABS, Census of Population and Housing (2011). Data based on place of usual residence.

Between 2006 and 2011, there were some significant changes to the age structure of
Victoria Park (Figure 2). Unlike other parts of Australia, there was a small decrease
in the number of elderly persons (70-84 years), probably as a result of mortality or
out migration to other areas. There was a significant increase in older baby boomers
(50-64 years). However, the age cohort which recorded the highest increase was 25-
29 year olds – already the dominant group in Victoria Park. This reflects the growing
popularity of the newly developed Burswood Peninsula and increasing availability of
rental accommodation that is attractive to this age cohort.

                                                                                                                  9
Town of Victoria Park – housing.id

    Figure 2.     Change in age structure, Victoria Park – 2006-2011
 +1,400

 +1,200

 +1,000

   +800

   +600

   +400

   +200

       0

    -200

    -400

Source: ABS, Census of Population and Housing (2006 and 2011). Data based on place of usual residence.

Overall, these changes in the age structure indicate that, despite modest growth
rates, there is significant churn in the population of Victoria Park. This is
characteristic of established suburban areas that have developed over many
decades but it also reflects its location within the Greater Perth metropolitan area.
Suburb life cycles can be at different stages across the Town and therefore respond
to different housing and demographic drivers. In other words, while some parts of
Victoria Park are ageing and are ripe for suburban regeneration, other parts have
undergone, or are going through a process of gentrification based on their relative
proximity to the CBD. Because housing needs change depending on age, it creates
challenges for service provision and policy formulation, but also highlights the
importance of fine grained spatial analysis to determine the different population
drivers across the Town of Victoria Park.

2.1.2 How will the age structure change in the future?
An examination of future changes in the age structure is important for service
planning, as many are age dependent eg schools, aged care. In 2016, .id updated
population forecasts for Victoria Park, taking into account the results of the 2011
Census and more recent demographic trends. These forecasts indicate modest
growth for Victoria Park over the period 2011-2036, with the population increasing
from 34,734 to 56,625. This translates to an annual average growth rate of 2.0%, or

                                                                                                                  10
Town of Victoria Park – housing.id
about 21,891 persons over the twenty five years. Growth rates are forecast to be
relatively consistent over this time.
Figure 3 shows the forecast age structure of Victoria Park at 2011 and 2036. Growth
is assumed to occur in all age cohorts, with slightly more growth forecast for family
age groups (30-39 year olds and 0-14 year olds) and retirees/elderly persons (55-79
year olds). This is more apparent in Figure 4, which shows the forecast change in
age structure. This largely reflects an ageing in place process for the period 2011 to
2021, showing the movement of the baby boomer cohort into the upper ends of the
age spectrum. There is also some growth of families with children aged 0-14 years,
reflecting increases in the fertility rate as well as suburban regeneration. On the other
hand, in the period 2021-2036 there is likely to be a high level of net migration to
Victoria Park, especially of those aged 20-29 years. This reflects the nature of the
housing stock primarily being constructed. High density apartments typically cater for
smaller households, many being attractive to renting households. According to the
2011 Census, just over half of high density dwellings are rented, compared to just
20% of separate houses.
Figure 3. Forecast age structure, Victoria Park – 2011-2036
7000
6000
5000
4000
3000
2000
1000
0
2011 2036
Source: .id (2016)
11Town of Victoria Park – housing.id
Figure 4. Forecast change in age structure, Victoria Park – 2011-2021 and 2021-
2036
1600
1400
1200
1000
800
600
400
200
0
Change 2011-2021 Change 2021-2036
Source: .id (2016)
2.1.3 Who is leaving and who is arriving?
Of all the components of population change, migration to Australia and between
areas is the most volatile, as it varies considerably over time and space. An
examination of migration patterns is critical to understanding how populations grow
and change. Characteristics of migration in Australian cities include:
A high proportion of local moves, ie within the same suburb or municipality;
The dominance of outward moves in a sectoral direction ie from inner south to
outer south; and
Strong links between life cycle events and age. Young adults ie 18-34 year
olds, are the most mobile age group. Thereafter migration tends to decline
with age, although there is a slight increase in the oldest age groups which is
probably related to health issues.
Figure 5 shows the major migration flows to and from the Town of Victoria Park
between 2006 and 2011, and there is evidence of these characteristics.
12Town of Victoria Park – housing.id
Figure 5. Major net migration flows, Victoria Park – 2006-2011
Source: ABS, Census of Population and Housing (2011)
Sectoral outward movement ie from inner south to outer south, is evident from the
net outflow to Canning, Gosnells and Armadale. There was also substantial
movement between neighbouring councils, for example, one of the strongest inflows
was from South Perth, and one of the strongest outflows to Belmont. Most of these
will be local moves that happen to involve an LGA boundary. Local moves
predominate because people tend to move to areas with which they have some
familiarity, and it also enables people to retain ties with their local community, and
this can be important for families with children attending local schools.
The strong links between life cycle events and age are reflected in Figure 6, which
shows age specific migration patterns in Victoria Park over the period 1991-1996 to
13Town of Victoria Park – housing.id
2006-2011. Historically, Victoria Park has gained young adults, typically seeking
housing that is close to employment, education and lifestyle opportunities. On the
other hand, the Town loses young families, typically people aged in their late 20s and
early 30s – and their children. This pattern has remained relatively stable since the
early 1990s, but in the 2006-11 intercensal period there was a sharp increase in net
migration of young adults. In addition, there was a net gain of people in their late 20s
and early 30s, whereas previously this age group left the Town for other parts of
metropolitan Perth. This increased net migration is reflective of higher levels of
residential development over the 2006-11 period, as well as more rapid population
growth, including overseas and interstate migration as a result of the mining boom.
Figure 6. Age specific net migration, Town of Victoria Park – 1991-1996 - 2006-
2011
2,000 1991-1996
1996-2001
1,500 2001-2006
2006-2011
1,000
No of persons
500
0
-500
-1,000
-1,500
Age group
Source: ABS, Census of Population and Housing (1996, 2001, 2006 and 2011)
14Town of Victoria Park – housing.id
2.2 How are households changing?
The most prevalent household types in Australian cities are typically families –
couples with children and single parent households. However, social and
demographic changes have combined to change the household mix. These include
ageing of the population, family breakdown and fewer children per family. In many
areas, family households are declining in number, while smaller households (couples
without children and lone person households) are increasing. From a housing
perspective, the result is lower average household size ie fewer people per dwelling.
It is important to recognise that declining household size tends to increase the
demand for dwellings, even if the population is stable or growing slowly. This trend,
however, is not evident in Victoria Park. While there was a decrease in household
size between 1991 and 2001 (2.16 to 2.02), there was a significant increase in
household size between 2001 and 2011. The average household size in 2011 was
2.18 persons, higher than the 1991 figure1.
2.2.1 Households and suburban lifecycles
Urban areas are constantly evolving primarily due to changing household needs and
preferences reflecting population and age structure changes. Figure 7 provides a
framework for traditional household pathways and identifies points at which needs
may change.
Starting as a child in a family household, a person may move into a group or lone
person household as a young adult, and then often becomes part of a couple
relationship. The adult years may feature movement between family, single parent
and lone person household needs. Child rearing is followed by an ‘empty-nester’
period (older couples without children) and ultimately becomes an elderly lone
person, as partners die or separate.
There is an increasing tendency for people around Australia to live alone or as a
couple without children. This is the result of a combination of factors, such as an
ageing population, resulting in growth of empty nester and elderly lone person
households, as well as the emergence of smaller households resulting from divorce
and partner separations.
1 Please see Footnote 2 on page 25.
15Town of Victoria Park – housing.id
Smaller households are predominant in Victoria Park (lone persons and couples
without children), but emerging household types are larger, generally couples with
young children. The Town of Victoria Park has a diverse dwelling stock that caters
well to both groups. All other things being equal, smaller households have less
income and require less space than larger households. They therefore need more
affordable housing, which can be smaller than the traditional three or four bedroom
dwelling and yet still cater well for their needs.
Figure 7. Traditional household pathway – a framework
The suburban lifecycle framework (Figure 8) provides an illustration of how suburbs
may change over time. Victoria Park is an interesting municipality to analyse with
reference to the suburban lifecycle framework as its development has spanned
several decades, hence encompassing a wide range of household types which are
regenerating at different times. This is evident in Lathlain, where the older population
has declined, and their homes are then replaced by younger households, including
families.
16Town of Victoria Park – housing.id
Figure 8. The suburban lifecycle – a framework
2.2.2 Current households
The 2011 ABS Census identified that the dominant household type in Victoria Park is
lone person households, totalling 4,428 households and comprising about one-third
of the total (Figures 9 and 10) . The number of lone person households has been
declining steady since 2001, from 41.2% in 2001 to 33.8% in 2011.
Couples with children and couples without children households each comprised
about one-quarter of the total, but in contrast to lone person households, the number
and proportion have increased since 2001. Couples with children increased from
1,898 in 2001 to 2,678 in 2011 (41.1%), while couples without children increased
from 2,668 to 3,495 over the same time period (31.0%).
17Town of Victoria Park – housing.id
Figure 9. Household types, Victoria Park – 2001-2011
Number 2001 2006 2011
6,000
5,000
4,000
3,000
2,000
1,000
0
Couples with Single parent Couples without Lone person Group Other family
children families children households households households
Household Type
Source: ABS, Census of Population and Housing (2011)
Victoria Park has a housing profile that is quite different to the wider metropolitan
Perth area (Figure 10), possibly because the municipality encompasses a range of
housing styles and eras. The Perth metropolitan area had a higher proportion of
couples with children (33.6%) and single parent families (10.4%), but a lower
proportion of lone person households (23.5%) and group households (4.3%).
18Town of Victoria Park – housing.id
Figure 10. Share of household types, Victoria Park and Perth – 2011
Share Victoria Park Perth (SD)
40%
35%
30%
25%
20%
15%
10%
5%
0%
Couples with Single parent Couples without Lone person Group households Other family
children families children households households
Household Type
Source: ABS, Census of Population and Housing (2001 and 2011)
2.2.3 Emerging households
Emerging households are those that are increasing in number. They provide some
insights into the types of community services that may be needed in future. Service
providers, policy makers and the housing industry understand the different housing
consumption patterns and servicing needs of ‘young’ and ‘old’ lone person
households; similarly, couples with young children households are likely to have quite
different needs to older couples without children (“empty nesters”). Analysis is
presented for key emerging households using the following groupings:
Children status Young households Middle-aged or Older households
maturing
households
No children at home Adults aged 15-44 Adults aged 45-64 Adults aged 65 and
over
Children at home Only children under Children of mixed Only children over
15 ages 15
Note that couple families as recorded in the Census can include both same-sex and
opposite sex couples, though the former are typically small in number.
19Town of Victoria Park – housing.id
Due to the significant number of household types when combined with the age of the
household, information is presented for the larger (family) household types
separately to the smaller household types.
2.2.4 Larger (family) households
The share of family households in Victoria Park is shown below in Figure 11. As
noted above, couples with children are not the dominant household type in Victoria
Park, but do comprise one-quarter of all households. Within family households,
couples with young children (all under 15 years) are most prevalent (13.7% of all
households). Compared to the Perth metropolitan average, the share of couples with
children was slightly lower in Victoria Park.
Figure 11. Share of family household types by age, Victoria Park – 2001-2011
Victoria Park Perth (SD)
Share
20%
18%
16%
14%
12%
10%
8%
6%
4%
2%
0%
Young Maturing Older Young Maturing Older
Couples with children Single parent families
Household Type
Source: ABS, Census of Population and Housing (2011)
Between 2001 and 2011, there was significant change in the number of the different
family household types (Figure 12). Couples with young children (all under 15 years)
showed the most significant increase over the ten year period (49%), however most
of this increase occurred between 2006 and 2011. On the other hand, single parents
with young children declined by 23%, as reduced housing affordability in the Town of
Victoria Park may drive many to leave the area to find more affordable housing.
20Town of Victoria Park – housing.id
Figure 12. Net change in family households by age – 2001-2011
Net Change
700
600
500
400
300
200
100
0
-100
-200
Young Maturing Older Young Maturing Older
Couples with children Single parent families
Household Type
Source: ABS, Census of Population and Housing (2001 and 2011)
2.2.5 Smaller households
In contrast to larger households, there was no household type that was clearly
dominant, though lone person households feature more prominently (Figure 13).
Young couple without children households comprised the largest share (15.1%),
followed by older lone persons (11.6%) and young lone person households (11.4%).
The proportion of lone person households was notably higher than that for the Perth
metropolitan area. This partly reflects some ageing of the Victoria Park population, as
these types of households tend to be formed through death of a spouse, divorce, or
children leaving home. However, the number of older lone person households has
been stable in recent years, as some in this age group leave the area for retirement
villages and aged care facilities, or mortality catches up with them. The proportion of
young couples without children was also higher than the Perth metropolitan average,
indicating that some areas are beginning to regenerate or be developed for
residential use (e.g. Burswood Peninsula). In addition, proximity to the CBD, the
Albany Highway and to Curtin University make the Town an attractive location for
young couples.
21Town of Victoria Park – housing.id
Figure 13. Share of ‘smaller’ household types by age, Victoria Park and Perth –
2011
Share Victoria Park Perth (SD)
16%
14%
12%
10%
8%
6%
4%
2%
0%
Young Middle aged Older Young Middle aged Older
Couples without children Lone person households
Household Type
Source: ABS, Census of Population and Housing (2011)
This gradual ageing of the Victoria Park population is reflected in the change in the
household types over the period 2001-2011 (Figure 14). The number of middle aged
lone person households increased significantly over this period (24.9%, or 2.3% per
annum). While some of this is a result of population ageing, particularly as the large
baby boom cohort matures, this household type is also formed through family
breakdown and may also reflect lifestyle choices ie a preference for living alone.
In contrast, the smaller household types to record a decline over the period 2001-
2011 were young lone person, older lone person and older couple without children
households. The largest decrease was in young lone persons. In 2001, they
comprised 16.8% of households, but this declined to 11.4% in 2011. Again, this
reflects the ageing population in Victoria Park but it is worth noting that the proportion
of young lone person households also declined in metropolitan Perth. This suggests
other factors such as housing affordability may be at play, and that these people are
adjusting their living arrangements accordingly. This is explored further in the section
on housing affordability.
22Town of Victoria Park – housing.id
Figure 14. Net change in ‘smaller’ households by age, Victoria Park – 2001-2011
Net Change
800
600
400
200
0
-200
-400
-600
Young Middle aged Older Young Middle aged Older
Couples without children Lone person households
Household Type
Source: ABS, Census of Population and Housing (2001 and 2011)
2.2.6 How will households change in the future?
Population and dwelling forecasts prepared by .id in 2015 indicate that all household
types are forecast to record growth in the next twenty five years (Figure 15). This
growth is assumed to occur despite the demographic trends discussed above, and
relates to the significant development opportunities identified in the Town. Note that
the household types used in the forecast.id product differ slightly from those
presented in other parts of this section.
Of the major household types, couples without dependents and lone person
households are forecast to experience the most significant growth – about one-third
of total growth each. Though these households tend to be associated with ageing
populations, they can occur across the age spectrum – couples without dependents
can include younger couples yet to have children. The key issue is that it is smaller
households that are forecast to grow faster than larger households such as families
and group households.
23Town of Victoria Park – housing.id
Figure 15. Households by type, Victoria Park – 2011-2036
Source: forecast.id (2016)
The growth in smaller households will also result in a decline in average household
size (Figure 16). In 2011, average household size in Victoria Park was 2.22 persons,
but it is forecast to decline slightly to 2.18 by 2036, but with some increase between
2011 and 2016. This is related to the ageing of the population, as well as social
changes which will result in smaller households eg family breakdown.
24Town of Victoria Park – housing.id
Figure 16. Average household size2, Victoria Park – 2011-2036
Year Average household size
2011 2.22
2016 2.29
2021 2.28
2026 2.25
2031 2.21
2036 2.18
Source: forecast.id (2015)
2.3 How is the dwelling stock changing?
In Australian cities, separate dwellings with three or more bedrooms are the most
prevalent and typically provide for larger households. Housing policy throughout
Australia now calls for greater housing diversity and the facilitation of higher-density
development to address the sustainability challenges inherent in ever expanding
urban areas. This might be implemented via policy measures which encourage more
development around public transport nodes and activity centres in order to make
better use of existing services and infrastructure. A highly visible change to dwelling
stock, particularly in the central cities and inner suburbs, is the increase in
apartments. Victoria Park, having developed over many decades, contains a range of
housing types and densities, from separate houses on single blocks, to multi-dwelling
units, and of course high density apartments such as those on the Burswood
Peninsula. This section examines how Victoria Park compares to the Perth
metropolitan area, and how densities – as measured through the dwelling structure
and number of bedrooms per dwelling – are changing.
In 2011, there were 14,100 occupied private dwellings in Victoria Park. Around half
of these were separate houses, primarily consisting of three bedrooms (Figure 17).
The number of these increased by about 6% over the period 2001-2011, and the
number of separate houses with 4 or more bedrooms, though the numbers were
smaller, increased by almost 46%. Compared to metropolitan Perth, Victoria Park
2Average household size in Figure 16 is based on the Estimated Resident Population at
2011. This results in a different figure to that obtained if the calculation is based on the
Census population, as per the data on page 15.
25Town of Victoria Park – housing.id
had a lower proportion of separate houses (53.1% compared to 71.4%). Though the
number of occupied private dwellings in Victoria Park increased by almost 14% over
the period 2001-2011, there was a marked difference between separate houses and
medium and high density dwellings. The former increased by almost 10% over the
ten years, compared to over 20% for medium and high density dwellings. In fact the
number of medium and high density dwellings with three bedrooms almost doubled in
number over the ten years.
Figure 17. Dwellings by type, Victoria Park – 2001-2011
Number 2001 2006 2011
4,500
4,000
3,500
3,000
2,500
2,000
1,500
1,000
500
0
Small: 0-2 br Medium: 3 br Large: 4+ br Small: 0-1 br Medium: 2 br Large: 3+ br Other Dwelling
Separate house Medium & High Density
Dwelling Type
Source: ABS, Census of Population and Housing (2001-2011)
Dwelling types vary widely across the Town and again this is indicative of the urban
development of Victoria Park over many decades. In 2011, the highest proportion of
separate houses was found in Lathlain (82%), followed by St James (80%). Lathlain
developed primarily in the inter war years, and planning controls through the
application of the R20 zone restrict the level of development permissible on each
block. St James developed in the post war era and until recently was not a favoured
location for multi dwelling housing, although this is starting to change.
26Town of Victoria Park – housing.id
In contrast, only 14% of dwellings in Burswood were separate houses, a further 27%
were medium density dwellings and 58% were high density dwellings. In addition to
some of the older apartments along the ridge line, there has been significant
development in this area since 2001 consisting of townhouses and apartment towers.
The dwelling profile for Victoria Park shows few similarities to that of the Perth
metropolitan area (Figure 18). Victoria Park has quite a high level of dwelling
diversity, with much higher proportions of medium and high density housing than the
metropolitan Perth average. While separate houses still hold the majority, they are
smaller than the Greater Perth average, with more houses having 3 or fewer
bedrooms. Housing in Victoria Park is much more likely to be medium or high density
dwellings, such as townhouses and apartments. These are larger than many found in
Perth, with 19.3% having 3 or more bedrooms, compared to 8.5% across
metropolitan Perth.
Figure 18. Share of dwelling type, Victoria Park and Perth – 2011
Share Victoria Park Perth (SD)
40%
35%
30%
25%
20%
15%
10%
5%
0%
Small: 0-2 br Medium: 3 br Large: 4+ br Small: 0-1 br Medium: 2 br Large: 3+ br Other Dwelling
Separate house Medium & High Density
Dwelling Type
Source: ABS, Census of Population and Housing (2011)
Over time however, there has been a trend in Victoria Park for dwellings to contain
more bedrooms. Regardless of the type of dwelling, those with 3 or more bedrooms
increased their share slightly from 53.5% in 2001 to 58.4% in 2011 (Figure 19).
While the total number of dwellings in Victoria Park increased by 14% over the ten
27Town of Victoria Park – housing.id
years, dwellings with 3 or more bedrooms increased by 24.4%. In other words, larger
dwellings increased at a faster rate than total dwelling growth. This is part of the
Australia wide trend towards larger homes, a trend which may not be environmentally
sustainable. Factors which influence this trend include:
The desire for space - to work from home, to provide a bedroom for every
child (including those in separated families) or the desire for a spare room for
visitors and family;
Higher developer profits from large format housing;
Increased affluence;
The perception of increased capital gain from buying larger homes.
The increase in larger dwellings does mask some significant changes when the type
of dwelling is considered (Figure 19). Notably, there was only a small increase in the
number of 3 bedroom separate houses (222 or 6%), but the number of 4 bedroom
separate houses increased by 510 (45.9%). This is likely a result of home renovation
(adding more bedrooms to an existing dwelling) as well as demolition of older and
sub-standard housing, and its replacement with modern and larger dwellings with
more bedrooms. The number of medium density dwellings with 3 or more bedrooms
almost doubled over the ten years and increased their share from 4.7% to 8.7% of
dwellings. Similarly, this is likely the result of medium density developments, such as
villa units and townhouses, replacing older separate houses, as well as townhouses
on strategic development sites. The trend away from smaller homes is interesting in
light of declining average household size and the increase in smaller households,
particularly those occupied by one person. Again, this reflects wider trends in the
Australian urban housing market, but it has created concern in some circles that one
and two person households are “over consuming” the dwellings in which they reside.
These concerns do fail however to consider the social and demographic environment
in which household types are created, such as the suburban lifecycle.
28Town of Victoria Park – housing.id
Figure 19. Change in dwelling types by number of bedrooms, Victoria Park – 2001-
2011
Net change
1,000
800
600
400
200
0
-200
-400
Small: 0-2 br Medium: 3 br Large: 4+ br Small: 0-1 br Medium: 2 br Large: 3+ br Other Dwelling
Separate house Medium & High Density
Dwelling Type
Source: ABS, Census of Population and Housing (2001 and 2011)
2.4 What dwellings do households live in?
This section identifies the dominant and emerging household types, and looks at the
types of dwellings in which they live. The dominant household type is the category
with the highest share of households at the 2011 Census, while an emerging
household is that with the highest increase in absolute numbers between 2001 and
2011.
While there is little qualitative data on housing preference, Census data enables
detailed analysis of dwelling consumption by household type to show preferences in
the context of supply constraints. Revealed preferences are the types of dwellings
that households actually live in, as indicated by Census data. Expressed
preferences are those stated by individuals when surveyed as to what sort of housing
they would like to live in. The latter is not part of the scope of this report, but there
are examples of this type of research being undertaken in Australia, such as the
Grattan Institute’s 2011 report “The housing we’d choose”.
29Town of Victoria Park – housing.id
This analysis uses Census data to identify the relationship between key dominant
and emerging household types and the dwellings they live in. The following
household types are analysed:
Couples with young children (dominant and emerging)
Young couples without children (dominant and emerging)
Maturing lone persons households (emerging)
Older lone person households (dominant)
Young lone person households
Although young lone person households are neither dominant nor emerging, there
was a sharp decline in their numbers over the period 2001-2011. This may relate to
housing affordability and hence in the context of this report is worthy of analysis.
2.4.1 Couples with young children
Couples with young children (all under 15 years of age) are the dominant household
type in the Town of Victoria Park, comprising 13.7% of the total. Their numbers
increased by almost half between 2001 and 2011. As a result, couples with young
children were both the dominant and emerging household type in the Town.
Typically, these households fall into three housing markets:
Those early in housing career who are buying their first home and may be
spending large proportions of their income on housing costs;
Second and third home-purchasers moving to larger dwellings more distant
from the city centre that are more suitable to their changing needs;
Those living in higher density dwellings, both renters and buyers, who have
just had their first child.
In terms of dwelling type, couples with young children were most likely to be living in
separate houses with three bedrooms (Figure 20). The numbers were relatively
steady between 2001 and 2006, but increased sharply in 2011. The numbers living
in separate houses with four or more bedrooms increased, as did those living in
medium and high density dwellings with three or more bedrooms. However due to
the rapid increase in this household type over time, there were increases in all
dwelling types.
30Town of Victoria Park – housing.id
Increasing numbers of these households spur demand for children’s services and
diversify established areas. They also help maintain population levels, as their
household size is more likely to grow in the short term. However, it is often difficult
for inner urban areas to retain this household type due to the nature of the dwelling
stock as many houses have only two bedrooms, or are on a small block with minimal
private outdoor space. Generally, the birth of a second or third child triggers a move
outwards to a larger home in the outer suburbs.
Figure 20. Couples with young children, by dwelling type – 2001-2011
Number 2001 2006 2011
700
600
500
400
300
200
100
0
Small: 0-2 br Medium: 3 br Large: 4+ br Small: 0-1 br Medium: 2 br Large: 3+ br Other
Dwelling
Separate house Medium & High Density
Dwelling Type
Source: ABS, Census of Population and Housing (2001, 2006 and 2011)
In 2011, around one third of couples with young children lived in separate houses
with three bedrooms (Figure 21). This was slightly higher than the Perth metropolitan
average of 27.1%. Across metropolitan Perth, a far higher proportion lived in
separate houses with four or more bedrooms (almost 60% compared to 24.1%). This
largely reflects the differences in the dwelling stock – as mentioned above, three
bedroom separate houses are the dominant dwelling type in the Town of Victoria
Park. Similarly the Town had a higher proportion of couples with young children
living in medium and high density dwellings simply due to the choice available.
31Town of Victoria Park – housing.id
Figure 21. Couples with young children by dwelling type (%) – 2011
Share Victoria Park Perth (SD)
70%
60%
50%
40%
30%
20%
10%
0%
Small: 0-2 br Medium: 3 br Large: 4+ br Small: 0-1 br Medium: 2 br Large: 3+ br Other Dwelling
Separate house Medium & High Density
Dwelling Type
Source: ABS, Census of Population and Housing (2001, 2006 and 2011)
In terms of net change between 2001 and 2011 (Figure 22), all dwelling types
recorded an increase, but it’s clear that this favoured larger dwellings regardless of
whether it was a separate house or medium/high density. Larger dwellings are
clearly more suitable for family households so where they are available and
affordable, there is a preference for families to live in these types of dwellings.
32Town of Victoria Park – housing.id
Figure 22. Net change in couples with young children, by dwelling type – 2001-
2011
Net change
200
180
160
140
120
100
80
60
40
20
0
Small: 0-2 br Medium: 3 br Large: 4+ br Small: 0-1 br Medium: 2 br Large: 3+ br Other Dwelling
Separate house Medium & High Density
Dwelling Type
Source: ABS, Census of Population and Housing (2001, 2006 and 2011)
2.4.2 Young couples without children
This household type are early in their housing careers and may be prepared to
accept high levels of housing stress to enable them to enter the housing market. This
household type is also prepared to compromise on the format of their dwelling to
achieve affordability. They are an important group, particularly for well established
areas to attract, as they have a high propensity for having children, therefore
providing demand for children’s services in the future. They play a key role in
diversifying well established areas and maintaining population levels as they are
likely candidates to have a growing average household size. Within the Town, they
tend to be concentrated in Victoria Park and East Victoria Park, particularly along the
Albany Highway Corridor.
Despite their smaller household size, young couples without children display similar
housing preferences to couples with young children. The growth in young couples
without children between 2001 and 2011 meant that most dwelling types recorded
increases over the ten years, particularly dwellings with three or more bedrooms
(Figure 23). This is a reflection of the available dwelling stock but may also indicate
33Town of Victoria Park – housing.id
a preference for larger dwellings to accommodate future changes in household type
eg children, or simply a desire for more space.
Figure 23. Young couples without children households, by dwelling type – 2001-
2011
Number 2001 2006 2011
700
600
500
400
300
200
100
0
Small: 0-2 br Medium: 3 br Large: 4+ br Small: 0-1 br Medium: 2 br Large: 3+ br Other Dwelling
Separate house Medium & High Density
Dwelling Type
Source: ABS, Census of Population and Housing (2001, 2006 and 2011)
Figure 24 shows that compared to the Perth metropolitan area, young couples
without children have a similar propensity to live in separate houses with three
bedrooms (around 30%). In the Town of Victoria Park this household type is far
more likely to live in medium and high density dwellings, especially those with three
or more bedrooms (24.3% compared with 14.6%). Once again the distinguishing
dwelling type was separate houses with four or more bedrooms, with only 6.4% of
this household type living in such a dwelling in the Town of Victoria Park, compared
with almost 30% in the Perth metropolitan area.
34Town of Victoria Park – housing.id
Figure 24. Young couples without children by dwelling type (%) – 2011
Share Victoria Park Perth (SD)
35%
30%
25%
20%
15%
10%
5%
0%
Small: 0-2 br Medium: 3 br Large: 4+ br Small: 0-1 br Medium: 2 br Large: 3+ br Other Dwelling
Separate house Medium & High Density
Dwelling Type
Source: ABS, Census of Population and Housing (2001, 2006 and 2011)
Because of the increase in this household type over the ten years, most dwelling
types recorded an increase in numbers, but it was higher for medium and high
density dwellings (regardless of the number of bedrooms) and three bedroom
separate houses. There was a small decline in separate houses with 0-2 bedrooms,
in line with the overall trend for this dwelling type.
35Town of Victoria Park – housing.id
Figure 25. Net change in young couples without children, by dwelling type – 2001-
2011
Net change
250
200
150
100
50
0
-50
-100
Small: 0-2 br Medium: 3 br Large: 4+ br Small: 0-1 br Medium: 2 br Large: 3+ br Other Dwelling
Separate house Medium & High Density
Dwelling Type
Source: ABS, Census of Population and Housing (2001, 2006 and 2011)
2.4.3 Middle aged lone person households
Middle aged lone person households are often not considered in housing analysis,
however, they were the only lone person household type in the Town of Victoria Park
to record an increase between 2001 and 2011. This increase is partly the result of
ageing in place of younger lone person households, children leaving the home of a
single parent (“empty nesters”), but also due to family breakdown. This tends to
create a smaller household unit which might consist of one parent leaving the family
home to live elsewhere. They are more advanced in their housing careers and are
more likely to have considerable housing equity that gives them more choice in the
property market. They also may have existing social ties to the community that
influences their housing choice.
Over the ten years between 2001 and 2011 middle aged lone person households
became more likely to live in larger dwellings, with increases in separate houses with
three or more bedrooms, as well as larger medium and high density dwellings.
Again, this reflects the available housing stock but may also reflect processes of
ageing in place (children leaving the family home), or family breakdown (need for
more bedrooms for joint custody arrangements).
36Town of Victoria Park – housing.id
Figure 26. Middle aged lone person households, by dwelling type – 2001-2011
Number 2001 2006 2011
400
350
300
250
200
150
100
50
0
Small: 0-2 br Medium: 3 br Large: 4+ br Small: 0-1 br Medium: 2 br Large: 3+ br Other Dwelling
Separate house Medium & High Density
Dwelling Type
Source: ABS, Census of Population and Housing (2001, 2006 and 2011)
Compared to metropolitan Perth, middle aged lone persons in the Town of Victoria
Park are far less likely to live in separate houses, particularly those with four or more
bedrooms. In contrast, they are more likely to live in medium and high density
dwellings (Figure 27).
37Town of Victoria Park – housing.id
Figure 27. Middle aged lone person households, by dwelling type (%) – 2011
Share Victoria Park Perth (SD)
35%
30%
25%
20%
15%
10%
5%
0%
Small: 0-2 br Medium: 3 br Large: 4+ br Small: 0-1 br Medium: 2 br Large: 3+ br Other Dwelling
Separate house Medium & High Density
Dwelling Type
Source: ABS, Census of Population and Housing (2001, 2006 and 2011)
Between 2001 and 2011, middle aged lone person households recorded increases in
most dwelling types, including separate houses (regardless of the number of
bedrooms), and particularly medium/high density dwellings with three or more
bedrooms (Figure 28).
38Town of Victoria Park – housing.id
Figure 28. Net change in middle aged lone person households, by dwelling type –
2001-2011
Net change
100
80
60
40
20
0
-20
Small: 0-2 br Medium: 3 br Large: 4+ br Small: 0-1 br Medium: 2 br Large: 3+ br Other Dwelling
Separate house Medium & High Density
Dwelling Type
Source: ABS, Census of Population and Housing (2001, 2006 and 2011)
2.4.4 Older lone person households
Despite macro level demographic trends indicating a gradual ageing of the
population, the number and proportion of persons aged 65 years and over in the
Town of Victoria Park declined between 2001 and 2011. This decline was
concentrated in the 70-79 year age cohort and is a result of out migration, but also
mortality and the fact that this cohort – largely born in the 1930s – is smaller in size
due to low fertility of the time. Despite this, older lone person households remain one
of the dominant household types in the Town, comprising 11.6% of the total. This
household type is concentrated in Bentley where there is housing aimed at older age
groups, but there are also smaller concentrated in Victoria Park and Carlisle.
The housing profile for older lone person households also shows the preference for
larger dwellings. Between 2001 and 2011 the largest increase for this housing type
was medium and high density dwellings with three or more bedrooms (Figure 29).
Other dwelling types remained relatively stable over the ten years.
39Town of Victoria Park – housing.id
Figure 29. Older lone person households, by dwelling type – 2001-2011
Number 2001 2006 2011
250
200
150
100
50
0
Small: 0-2 br Medium: 3 br Large: 4+ br Small: 0-1 br Medium: 2 br Large: 3+ br Other Dwelling
Separate house Medium & High Density
Dwelling Type
Source: ABS, Census of Population and Housing (2001, 2006 and 2011)
As shown in Figure 30, the most common type of dwelling for older lone person
households is the three bedroom separate house (38.5%), followed by medium and
high density dwellings with three or more bedrooms (24.7%). Older lone persons
households in the Town of Victoria Park showed a far greater propensity to live in
medium and high density dwellings compared to the Perth metropolitan average.
40Town of Victoria Park – housing.id
Figure 30. Older lone person households, by dwelling type (%) – 2011
Share Victoria Park Perth (SD)
45%
40%
35%
30%
25%
20%
15%
10%
5%
0%
Small: 0-2 br Medium: 3 br Large: 4+ br Small: 0-1 br Medium: 2 br Large: 3+ br Other Dwelling
Separate house Medium & High Density
Dwelling Type
Source: ABS, Census of Population and Housing (2001, 2006 and 2011)
There is a widespread perception that older households will downsize in line with
their housing needs, and that if they age in place in the family home then they are
“overconsuming” dwellings. However, downsizing takes many forms and can involve
a move to a smaller dwelling, which may be a unit rather than a separate house, or it
may simply be a smaller house with fewer bedrooms. In many parts of Australian
cities older households are bucking this perception. In line with trends for other
household types, there was an increase in the number of older lone person
households living in larger dwellings, but much of this increase was in large medium
and high density dwellings ie three or more bedrooms. Between 2001 and 2011,
there was a small decline in the number living in separate houses with 0-2 bedrooms.
41Town of Victoria Park – housing.id
Figure 31. Net change in older lone person households, by dwelling type – 2001-
2011
Net change
60
50
40
30
20
10
0
-10
-20
-30
Small: 0-2 br Medium: 3 br Large: 4+ br Small: 0-1 br Medium: 2 br Large: 3+ br Other Dwelling
Separate house Medium & High Density
Dwelling Type
Source: ABS, Census of Population and Housing (2001, 2006 and 2011)
2.4.5 Young lone person households
Although young lone person households are not the dominant or emerging
household types, analysis of this household type is useful due to the dramatic decline
in their numbers over the period 2001-2011. This is likely a combination of factors,
including out-migration, but also a shift to other household types eg lone person
households becoming couple households. Between 2001 and 2011 their numbers
declined by around 23%. Notably for all dwelling types, except medium and high
density dwellings with 0-1 bedrooms, there was a decline in numbers (Figure 32).
42You can also read