Analysis of the engine test cycles from China VI heavy duty vehicle standard and China automotive test cycle
←
→
Page content transcription
If your browser does not render page correctly, please read the page content below
E3S Web of Conferences 268, 01020 (2021)                                 https://doi.org/10.1051/e3sconf/202126801020
VESEP2020

      Analysis of the engine test cycles from China VI
      heavy duty vehicle standard and China
      automotive test cycle
      Xiaowei Wang1,*, Chuanqi Wang 1,2, Tao Gao 1, Tengteng Li 1,2, and Hailiang Lao 1
      1 CATARC      Automotive Test Center (Tianjin) Co., Ltd., Tianjin 300300, China
      2 School   of Mechanical Engineering, Tianjin University, Tianjin 300072, China

                     Keywords: diesel engine, China VI standard, China automotive test
                     cycle, regression analysis, emissions.

                     Abstract. This paper studied the engine test cycles including world
                     harmonized steady cycle (WHSC), world harmonized transient cycle
                     (WHTC) , china heavy-duty steady cycle (CHSC) and china heavy-duty
                     transient cycle (CHTC) based on a diesel engine which meet the China VI
                     heavy duty vehicle emission standard. The results show that regression
                     analysis of speed, torque and power all meet the requirements of the China
                     VI heavy duty vehicle standard. For this engine, NOx, PM and THC
                     pollutants under CHSC are 134.5%, 29.6% and 94.4% higher than those
                     under WHSC, respectively. PN emissions of CHSC is 65.6% lower than
                     that of WHSC. NOx, PM and PN pollutants under CHTC are 62.9%,
                     96.4% and 64.3% higher than those under WHTC, respectively. The
                     exhaust temperature of the first 350 seconds at CHTC is lower, which
                     poses a greater challenge to the conversion efficiency of the after-treatment
                     system at low speed and low load.

      1 Introduction
          The fast-growing Chinese automobile industry has become one of the pillars of China's
      economy. However, with the rapid increase in car ownership, the environmental problems
      have also attracted more and more attention. The exhaust pollution of diesel vehicles,
      especially heavy-duty diesel vehicles, is even more serious. In the "China Motor Vehicle
      Environmental Management Annual Report (2018)", diesel trucks only accounts for 7.8%
      of automotive ownership, emitting 57.3% of nitrogen oxides and 77.8% of particulate
      matter [1].
          The GB 17691-2018 "Limits and measurement methods for emissions from diesel
      fuelled heavy-duty vehicles" (China VI) issued in 2018 adopts the world harmonised
      transient cycle (WHTC) and the world harmonised steady state cycle (WHSC) for type
      certification [2]. In the development process of the above operating conditions, the actual
      driving data were mostly from European and American countries rather than China.
      Actually, there is a certain driving deviation between China and other countries. In this

      *   Corresponding author: wangxiaowei@catarc.ac.cn

© The Authors, published by EDP Sciences. This is an open access article distributed under the terms of the Creative Commons
Attribution License 4.0 (http://creativecommons.org/licenses/by/4.0/).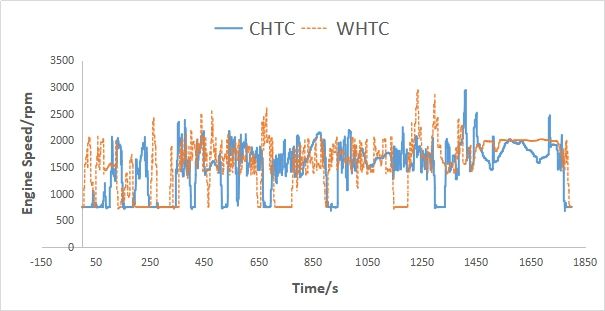
E3S Web of Conferences 268, 01020 (2021)                         https://doi.org/10.1051/e3sconf/202126801020
VESEP2020

      context, China Automotive Technology Research Center Co., Ltd. took the lead in the
      development of the "China Automotive Driving Conditions" National Standard Part 3:
      Engines, which has now entered the stage of soliciting opinions [3]. The engine operating
      conditions are also composed of transient cycle (CHTC) and steady state operating cycle
      (CHSC).
          In order to study the cycle difference between GB 17691-2018 standard and China
      automotive driving conditions of heavy-duty vehicles, this paper runs the above
      steady state and transient cycles on a diesel engine, then compares and analyzes emission
      differences under above cycles.

      2 Experimental setup

      2.1 Engine and equipment

      This paper selects a 2.8L diesel engine that meets the China VI emission standard. The
      emission control technical route is diesel oxidation catalyst (DOC) + diesel particle filter
      (DPF) + selective catalytic reduction catalyst (SCR) + ammonia catalyst (ASC). The main
      technical parameters of the test diesel engine are shown in Table 1.
                                 Table 1. Main parameters of tested engine.
                           Parameter                                        Value
                        Engine capacity                                     2.78L
                         Bore×Stroke                                    94mm×100mm
                          Rated power                                      115kW
                       Maximum Torque                                      450Nm
                         Technical route                           DOC+DPF+SCR+ASC
                        Emission Level                                     China VI
         The main equipment used in this paper is shown in Table 2
                                           Table 2. Test equipment.
                  Equipment name                      Equipment Type and Manufacturer
                 AC Dynamometer                              AVL INDY P44
              Test bed control system                     AVL PUMA Open V1.5.3
               Intake air temperature
                                                      AVL Air Conditioning System 1600
                    conditioning
                 Gaseous emission
                                                          AVL Emission Bench AMA i60
                   measurement
               Particle number (PN)
                                                                      AVL 489
                   measurement
                 Fuel consumption
                                                                AVL 753C/735S
                   measurement
                 Particle sampling                               AVL SPC 472
                     Balance                                   Sartorius CPA2P-F

      2.2 Test procedure

                                                      2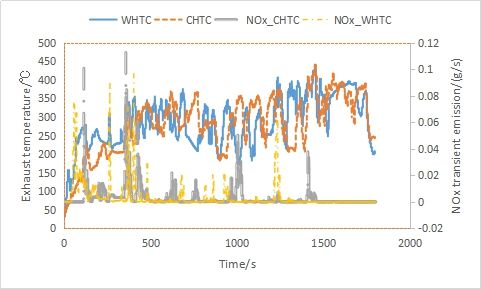
E3S Web of Conferences 268, 01020 (2021)                      https://doi.org/10.1051/e3sconf/202126801020
VESEP2020

     According to the requirements of GB 17691-2018 standard, WHTC in hot and cold state,
     WHSC in hot state, and CHTC in cold and hot state and CHSC in hot state were run
     respectively. The calculation method of emissions completely followed the method
     provided by GB 17691-2018 standard.

     3 Results and analysis

     3.1 Comparison of CHSC and WHSC
     Figure 1 shows the comparison of CHSC and WHSC. Both cycles include 13 operating
     points. The size of the bubble of each operating point is proportional to run time in the total
     cycle. It can be seen from Figure 1 that the speed and load assessed by CHSC are lower.
     The maximum normalized speed of CHSC is 60%, while WHSC is 75%. The lowest
     normalized load for CHSC except idling conditions is 10%, while WHSC is 25%.

     Fig. 1. Operating points comparison of CHSC and WHSC.
         The regression analysis of CHSC is shown in Figures 2-4. As can be seen from the
     figures, the slopes of the regression lines for speed, torque, and power are 1.002, 0.9981,
     and 0.9986, the correlation coefficients are 1, 0.9988, and 0.9993; the intercepts are 0.3761,
     0.322, and 0.0523, respectively. In addition, the standard deviations (SEE) of the regression
     lines for speed, torque, and power are 0.4, 3.46, and 0.53 respectively, which all meet the
     tolerance of the WHSC regression line in Table C.3 of GB 17691-2018 standard. The
     results indicate that the CHSC of this engine can be well followed.

     Fig. 2. Engine speed regression analysis of CHSC.

                                                         3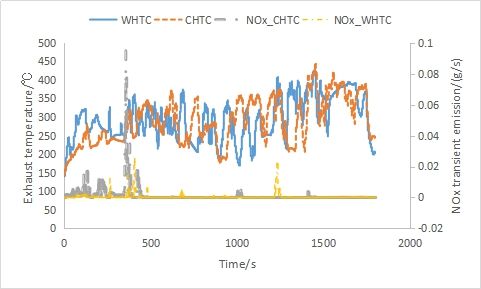
E3S Web of Conferences 268, 01020 (2021)                          https://doi.org/10.1051/e3sconf/202126801020
VESEP2020

      Fig. 3. Engine torque regression analysis of CHSC. Fig. 4. Engine power regression analysis of
      CHSC.
          Run WHSC and CHSC sequentially on the selected engine, and the comparison of
      related operating data and emission results is shown in Table 3. It can be seen that the total
      duration of CHSC and the idle duration are lower than WHSC,. The total power of CHSC is
      22.02kW, which is 17.5% lower than that of WHSC. CHSC is more biased towards
      low-load conditions.
          Emissions for both CHSC and WHSC can meet the requirements of GB 17691-2018
      standard. NOx, PM and THC pollutants of CHSC are 134.5%, 29.6% and 94.4% higher
      than WHSC respectively. For PN emissions, CHSC is 65.6% lower than WHSC. CO
      emissions for both CHSC and WHSC are below the detection limit. Since the overall speed
      and load of CHSC are lower than WHSC, resulting in a lower exhaust temperature which
      causes an increase in NOx emission for CHSC. At the same time, incomplete combustion
      will cause an increase in THC and CO2 emissions. the load of CHTC is low so the PN
      emissions are reduced. The increase in PM emission may be due to incomplete combustion
      leading to an increase in volatile organic compounds [4].
                                  Table 3. Comparison of CHSC and WHSC.
                 Parameter                    CHSC                WHSC                 Difference/%
                Total time/s                   1800                1895                   -5.01
                 Idle time/s                   360                  420                  -14.29
             Idle percentage/%                  20                   22                   -9.09
              Total power/kW                  22.02                 26.7                 -17.53
                NOx/g/kW.h                    0.2643              0.1127                 134.52
                 PN/#/kW.h                  6.47E+10             1.88E+11                -65.59
                 PM/g/kW.h                    0.0035              0.0027                  29.63
                 CO/g/kW.h                       0                   0                       0
                CO2/g/kW.h                    779.28              748.73                   4.08
                THC/g/kW.h                    0.0241              0.0124                  94.35

      3.2 Comparison of CHTC and WHTC
      The operating conditions comparison of CHTC and WHTC is shown in Figures 5-7. The
      total time of CHTC and WHTC are 1800 seconds. For this engine, the average engine
      speed of CHTC is 1483 rpm, while the average engine speed of WHTC is 1568 rpm. It can
      be seen from Figure 7 that the medium and low speed operating condition of CHTC is more

                                                       4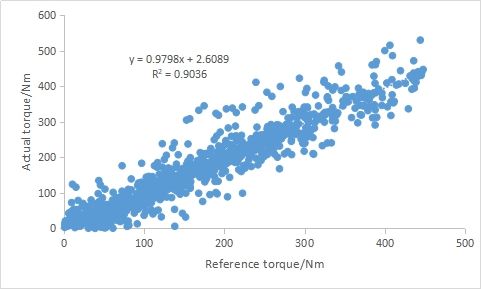
E3S Web of Conferences 268, 01020 (2021) https://doi.org/10.1051/e3sconf/202126801020
VESEP2020
than that of WHTC, while the high-speed operating condition of CHTC is less than that of
WHTC.
Fig. 5. Engine speed comparison between CHTC and WHTC.
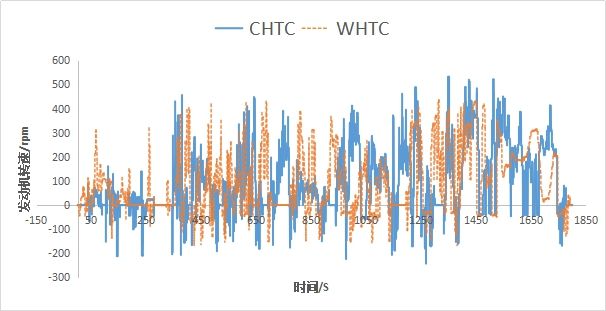
Fig. 6. Engine torque comparison between CHTC and WHTC.
600
500 CHTC
WHTC
400
300
Engine torque/Nm
200
100
0
-100
-200
-300
500 1000 1500 2000 2500 3000
2 Engine speed/rpm
Fig. 7. Engine operating points distribution of CHTC and WHTC.
The regression analysis of CHTC is shown in Figures 8-10. As can be seen from the
figures, the slopes of the regression lines for speed, torque, and power are 0.9995, 0.9798,
and 0.976, the correlation coefficients are 0.9999, 0.9036, and 0.9219, the intercepts are
0.7561, 2.6089, and 0.5533 respectively. In addition, the standard deviations (SEE) of the
regression lines for speed, torque, and power are 3.47, 36.49, and 6.63 respectively, which
all meet the tolerance of the WHTC regression line in Table C.2 of GB 17691-2018
standard. The results indicate that the CHTC of this engine can be well followed.
5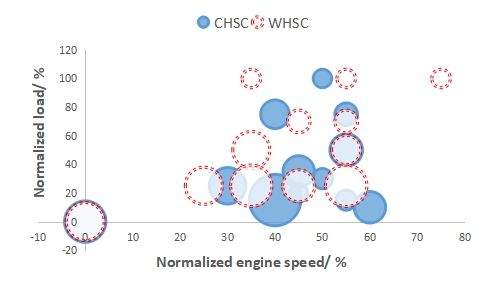
E3S Web of Conferences 268, 01020 (2021)                          https://doi.org/10.1051/e3sconf/202126801020
VESEP2020

      Fig. 8. Engine speed regression analysis of CHTC. Fig. 9. Engine torque regression analysis of
      CHTC.

      Fig. 10. Engine power regression analysis of CHTC.
          Run WHTC and CHTC sequentially on the selected engine, and the comparison of
      related operating data and emission results is shown in Table 4.. The total power of CHTC
      is 18.75kW, which is about 4% lower than that of WHTC. Emissions for both CHTC and
      WHTC can meet the requirements of GB 17691-2018 standard. However, the various
      pollutants emissions of CHTC are higher than those of WHTC. NOx, PM and PN pollutants
      of CHTC are increased by 62.9%, 96.4% and 64.3% respectively compared with WHTC.
      This results show that enterprises need to make targeted calibrations focusing on CHTC.
                           Table 4 Comparison of CHTC and WHTC(cold plus hot state)
               Parameter                   CHTC                    WHTC                 Difference/%
              Total time/s                  1800                    1800                      0
            Total power/kW                  18.60                   19.53                   -4.76
              NOx/g/kW.h                   0.2663                  0.1635                   62.87
               PN/#/kW.h                  9.31E+10                4.74E+10                  96.41
              PM/g/kW.h                    0.0046                  0.0028                   64.29
              CO/g/kW.h                    0.0375                  0.0261                   43.68
              CO2/g/kW.h                    783.5                  774.23                    1.2
              THC/g/kW.h                   0.0183                  0.0056                  226.79
         Figures 11 and 12 show the exhaust temperature and transient NOx emissions variation
      of WHTC and CHTC in the cold and hot states. It can be seen that the exhaust temperature
      of CHTC is significantly lower than that of WHTC in the first 350 seconds, regardless of
      cold or hot state. This is mainly because the speed and torque of CHTC in the first 350
      seconds are relatively low. From the results of the transient NOx emission, the NOx

                                                       6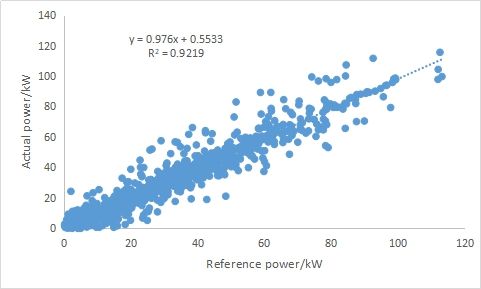
E3S Web of Conferences 268, 01020 (2021)                     https://doi.org/10.1051/e3sconf/202126801020
VESEP2020

     emission of CHTC in the first 350 seconds is significantly higher than that of WHTC,
     which brings challenges in catalytic conversion efficiency under low exhaust temperature.

     Fig. 11. Exhaust temperature and NOx transient emission of cold CHTC and WHTC.

     Fig. 12. Exhaust temperature and NOx transient emission of hot CHTC and WHTC.

     4 Conclusions
     By running the steady state cycles (CHSC, WHSC) and the transient cycles (CHTC,WHTC)
     of a diesel engine which meets the GB 17691-2018 heavy duty engine emission
     requirements, it is found that:
         (1) The regression analysis results of speed, torque and power of both CHSC and CHTC
     all meet the requirements of GB 17691-2018 standard, indicating that the new
     steady-state and transient-state cycles can be followed very well.
         (2) For this engine whose calibration based on WHSC and WHTC, almost all emissions
     of CHSC and CHTC are higher than WHSC and WHTC.
         (3) The low exhaust temperature in the first 350 seconds of CHTC will pose a greater
     challenge to the conversion efficiency of after-treatment system.

     This research was financially supported by CATARC Project (TJKY1920020).

     References
     1. China Mobile Source Environmental Management Annual Report [R]. Ministry of
        Ecology and Environment 2019.

                                                   7
E3S Web of Conferences 268, 01020 (2021) https://doi.org/10.1051/e3sconf/202126801020
VESEP2020
2. GB17691-2018 Limits and measurement methods for emissions from diesel fueled
heavy-duty vehicle (Chinese Ⅵ) [S]. Ministry of Ecology and Environment 2018.
3. GB/T 38146.3—XXXX China automotive test cycle—Part Ⅲ: Engine [S], Draft for
comments. 2020.
4. Liu Xunjun. Emissions and control of internal combustion engines [M]. Beijing:
Machinery Industry Press, 2005.
8You can also read