ANNUAL PERFORMANCE PLAN - 2016/17 DEPARTMENT OF BASIC EDUCATION - Parliamentary ...
←
→
Page content transcription
If your browser does not render page correctly, please read the page content below

DEPARTMENT OF BASIC EDUCATION

ANNUAL PERFORMANCE PLAN
         2016 /17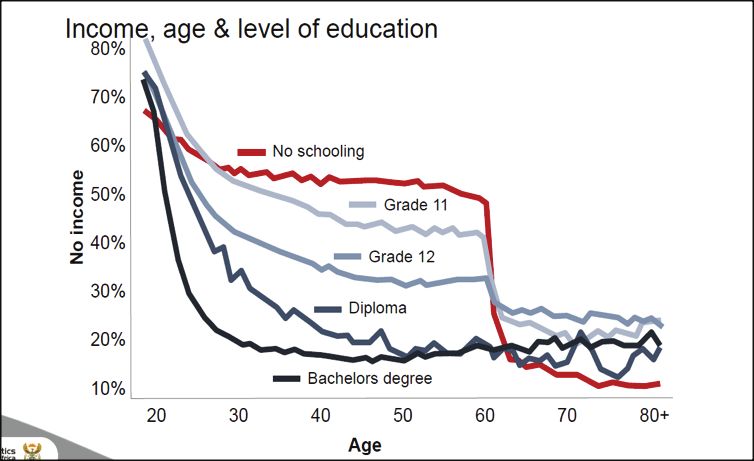

ANNUAL PERFORMANCE PLAN
       2016/2017
      MARCH 2016
TABLE OF CONTENTS
List of Acronyms  .  .  .  .  .  .  .  .  .  .  .  .  .  .  .  .  .  .  .  .  .  .  .  .  .  .  .  .  .  .  .  .  .  .  .  .  .  .  .  .  .  .  .  .  .  .  .  .  .  .  .  .  .  .  .  .  .  .  .  .  . 2

Foreword  .  .  .  .  .  .  .  .  .  .  .  .  .  .  .  .  .  .  .  .  .  .  .  .  .  .  .  .  .  .  .  .  .  .  .  .  .  .  .  .  .  .  .  .  .  .  .  .  .  .  .  .  .  .  .  .  .  .  .  .  .  .  .  .  . 4

Official Signing Off .  .  .  .  .  .  .  .  .  .  .  .  .  .  .  .  .  .  .  .  .  .  .  .  .  .  .  .  .  .  .  .  .  .  .  .  .  .  .  .  .  .  .  .  .  .  .  .  .  .  .  .  .  .  .  .  .  .  .  . 6

Part A: Strategic Overview
1.         Updated Situational Analysis  .  .  .  .  .  .  .  .  .  .  .  .  .  .  .  .  .  .  .  .  .  .  .  .  .  .  .  .  .  .  .  .  .  .  .  .  .  .  .  .  .  .  .  .  .  .  .  .  .  . 7

           1.1.       Performance Delivery Environment .  .  .  .  .  .  .  .  .  .  .  .  .  .  .  .  .  .  .  .  .  .  .  .  .  .  .  .  .  .  .  .  .  .  .  .  .  .  .  .  .  . 7

           1.2.       Organisational Environment  .  .  .  .  .  .  .  .  .  .  .  .  .  .  .  .  .  .  .  .  .  .  .  .  .  .  .  .  .  .  .  .  .  .  .  .  .  .  .  .  .  .  .  .  .  . 10

2.         Revisions to Legislative and other Mandates .  .  .  .  .  .  .  .  .  .  .  .  .  .  .  .  .  .  .  .  .  .  .  .  .  .  .  .  .  .  .  .  .  .  .  .  .  .  .  .  . 17

           2.1.       Regulations  .  .  .  .  .  .  .  .  .  .  .  .  .  .  .  .  .  .  .  .  .  .  .  .  .  .  .  .  .  .  .  .  .  .  .  .  .  .  .  .  .  .  .  .  .  .  .  .  .  .  .  .  .  .  . 17

           2.2.       Pending Court Cases .  .  .  .  .  .  .  .  .  .  .  .  .  .  .  .  .  .  .  .  .  .  .  .  .  .  .  .  .  .  .  .  .  .  .  .  .  .  .  .  .  .  .  .  .  .  .  .  .  . 17

3.         Overview of 2015/2016 Budget and MTEF Estimates .  .  .  .  .  .  .  .  .  .  .  .  .  .  .  .  .  .  .  .  .  .  .  .  .  .  .  .  .  .  .  .  .  .  .  . 18

           3.1.        Expenditure Estimates .  .  .  .  .  .  .  .  .  .  .  .  .  .  .  .  .  .  .  .  .  .  .  .  .  .  .  .  .  .  .  .  .  .  .  .  .  .  .  .  .  .  .  .  .  .  .  .  . 18

           3.2.        Relating Expenditure Trends to Strategic Outcome-Oriented Goals .  .  .  .  .  .  .  .  .  .  .  .  .  .  .  .  .  .  .  .  .  .  .  . 19

Part B: Programme and sub-programme plans
4.         Departmental Programmes: Strategic Objectives, Programme Performance Indicators and Annual Targets for
           2015/2016 .  .  .  .  .  .  .  .  .  .  .  .  .  .  .  .  .  .  .  .  .  .  .  .  .  .  .  .  .  .  .  .  .  .  .  .  .  .  .  .  .  .  .  .  .  .  .  .  .  .  .  .  .  .  .  .  .  .  .  . 21

           4.1.       Programme 1: Administration  .  .  .  .  .  .  .  .  .  .  .  .  .  .  .  .  .  .  .  .  .  .  .  .  .  .  .  .  .  .  .  .  .  .  .  .  .  .  .  .  .  .  .  .  . 21

           4.2.       Programme 2: Curriculum Policy, Support and Monitoring  .  .  .  .  .  .  .  .  .  .  .  .  .  .  .  .  .  .  .  .  .  .  .  .  .  .  .  .  . 25

           4.3.       Programme 3: Teachers, Education Human Resources and Institutional Development  .  .  .  .  .  .  .  .  .  .  .  .  . 36

           4.4.       Programme 4: Planning, Information and Assessment .  .  .  .  .  .  .  .  .  .  .  .  .  .  .  .  .  .  .  .  .  .  .  .  .  .  .  .  .  .  . 45

           4.5.       Programme 5: Educational Enrichment Services .  .  .  .  .  .  .  .  .  .  .  .  .  .  .  .  .  .  .  .  .  .  .  .  .  .  .  .  .  .  .  .  .  .  . 58

Part C: Links to other plans
5.         Links to long-term infrastructure and other Capital Plans .  .  .  .  .  .  .  .  .  .  .  .  .  .  .  .  .  .  .  .  .  .  .  .  .  .  .  .  .  .  .  .  .  . 66

           5.1.       Accelerated Schools Infrastructure Delivery Initiative (ASIDI .  .  .  .  .  .  .  .  .  .  .  .  .  .  .  .  .  .  .  .  .  .  .  .  .  .  .  . 66

           5.2.       Conditional Grants .  .  .  .  .  .  .  .  .  .  .  .  .  .  .  .  .  .  .  .  .  .  .  .  .  .  .  .  .  .  .  .  .  .  .  .  .  .  .  .  .  .  .  .  .  .  .  .  .  .  . 67

           5.3.        Public Entities  .  .  .  .  .  .  .  .  .  .  .  .  .  .  .  .  .  .  .  .  .  .  .  .  .  .  .  .  .  .  .  .  .  .  .  .  .  .  .  .  .  .  .  .  .  .  .  .  .  .  .  .  .  . 69

           5.4.        Public-Private Partnerships  .  .  .  .  .  .  .  .  .  .  .  .  .  .  .  .  .  .  .  .  .  .  .  .  .  .  .  .  .  .  .  .  .  .  .  .  .  .  .  .  .  .  .  .  .  . 69

Part D: Annexures
6.         Updates in the Department of Basic Education Strategic Plan .  .  .  .  .  .  .  .  .  .  .  .  .  .  .  .  .  .  .  .  .  .  .  .  .  .  .  .  .  .  . 70

7.         Technical Indicator Descriptions .  .  .  .  .  .  .  .  .  .  .  .  .  .  .  .  .  .  .  .  .  .  .  .  .  .  .  .  .  .  .  .  .  .  .  .  .  .  .  .  .  .  .  .  .  .  .  . 70

                                                                                                                                        2016/2017                                                        1
LIST OF ACRONYMS
AIR		      Apparent Intake Rate

AMESA      Association of Maths Educators of South Africa

ANA		      Annual National Assessments

ASIDI		    Accelerated Schools Infrastructure Delivery Initiative

BSNSW		    Board of Studies New South Wales

CAPS		     Curriculum and Assessment Policy Statements

CATs		     Common Assessment Tasks

CD		       Compact Disc

CoE		      Compensation of Employees

DBE		      Department of Basic Education

DPME		     Department of Performance Monitoring and Evaluation

DSD		      Department of Social Development

DVD		      Digital Versatile Disc

ECD		      Early Childhood Development

ECDoE		    Eastern Cape Department of Education

EGRA		     Early Grade Reading Assessment

ELRC		     Education Labour Relations Council

e-LTSM		   Electronic Learning and Teaching Support Materials

EMIS		     Education Management Information Systems

FET		      Further Education and Training

GEM/BEM    Girls and Boys Education Movement

GET		      General Education and Training

GFET		     General and Further Education and Training

GHS		      General Household Survey

HEDCOM     Heads of Education Committee

HEI		      Higher Education Institution

ICT		      Information and Communications Technology

IEEE		     Institute of Electrical and Electronics Engineers

ISPFTED    Integrated Strategic Planning Framework for Teacher Education and   Development

IIAL       Incremental Introduction of African languages

IQMS		     Integrated Quality Management System

ISHP		     Integrated School Health Programme

LDoE		     Limpopo Department of Education

LTSM		     Learning and Teaching Support Materials

MDGs       Millennium Development Goals

 2                       ANNUAL PERFORMANCE PLAN
MIP        Multi-Annual Indicative Programme

MPAT		     Management Performance Assessment Tool

MST		      Mathematics, Science and Technology

MTEF		     Medium-Term Expenditure Framework

MTSF		     Medium-Term Strategic Framework

NDP 		     National Development Plan

NEAC		     National Examinations and Assessment Committee

NECT 		    National Education Collaboration Trust

NEDLAC		   National Economic Development and Labour Council

NEEDU		    National Education Evaluation and Development Unit

NEIMS		    National Education Infrastructure Management System

NICPD		    National Institute for Curriculum and Professional Development

NSC		      National Senior Certificate

NSFAS		    National Student Financial Aid Scheme

NSLA		     National Strategy for Learner Attainment

PED		      Provincial Education Department

PICC		     Presidential Infrastructure Coordinating Commission

PMDS 		    Performance Management and Development Scheme

PPN		      Post Provisioning Norm

QCTO		     Quality Council for Trades and Occupations

QLTC		     Quality Learning and Teaching Campaign

RPL		      Recognition of Prior Learning

SAASTE		   South African Association for Science and Technology Educators

SACE		     South African Council of Educators

SACMEQ		   Southern and Eastern Africa Consortium for Monitoring Educational Quality

SAMF       South African Maths Foundation

SASCE      South African Schools Choral Eisteddfod

SBA        School-Based Assessment

SGB		      School Governing Body

SIAS		     Implementing Screening, Identification, Assessment and Support

SMS		      Senior Management Services

SQA		      Scottish Qualification Authority

TIMSS		    Trends in International Mathematics and Science Study

USB		      Universal Serial Bus

WSE		      Whole School Evaluation

                                                                            2016/2017   3
FOREWORD BY THE MINISTRY OF BASIC EDUCATION The 2015/16 financial year was built upon our determination to improve efficiency and quality in the system. The Constitutional principles of access, redress, equity, remain high on the sector’s agenda. However, the Basic Education sector is seized with the task of improving quality and efficiency. We will continuously work boldly to seek new strategies and interventions that will bring us closer to the desired state of our basic education. The 2016/17 Annual Performance Plan (APP) affords the Department of Basic Education (DBE) the opportunity to reflect on the milestones achieved so far against Government’s broader blueprint: the National Development Plan (NDP). Further, in alignment with the post-2015 development agenda, articulated in the Sustainable Development Goals, especially SDG 4 (four) which has a specific focus on the provision of quality education, the Department will continue to ensure that it is inclusive, equitable and promotes life-long learning opportunities for all. The commitment to this international standard also forms the foundation of the DBE’s role in building the human resource capacity of the South African nation and contributing to its economic potential. While significant gains have been achieved in terms of access, improved learner performance across all grades remains central to all our undertakings. To achieve this we have to continuously ensure optimal performance by all at all levels of the system. A concerted effort directed at uprooting poor performance, especially where support has been provided with no improvement, will be part of our resolve to improve the basic education sector. There has been marked improvement in access, redress and equity as seen in the number of five year-olds attending educational institutions at Grade R which currently is 87.2%; the Apparent Intake Rate (AIR) to Grade 1 which is at 101.4%; the percentage of fourteen (14) to eighteen (18) year-olds attending educational institutions which is at 90.7%; the percentage of five (5) year- olds children with disabilities attending educational institutions currently at 83.9%; seven (7) to fifteen (15) year-olds children with disabilities attending educational institutions is 93.4%; The number of learners who benefit from the National School Nutrition Programme is 9.2 million and the percentage of learners who benefit from the pro-poor policy package, such as No Fee schools, is 80%. While this point to the improvement in access, redress and equity, the Department will work towards ensuring improvement in quality and efficiency in the sector as well. The NDP calls for different parts of the education to work together allowing learners to take different pathways that offer high quality learning opportunities. The year 2016/17 will see the basic education sector laying a solid foundation in preparation for the three tiered school system. The three-tiered school system will consist of the academic, technical vocational and technical occupational streams and will be introduced as a response to the economic needs of our country. While responding to the needs of the country the three-tiered school system will also afford our learners the opportunity to choose different streams based on their strengths and career paths they wish to pursue. This system will be phased in, starting with 58 schools of skills ,and then progressively expanded throughout the country. The NDP proposes a target of 450 000 learners being eligible for a Bachelor’s programme with Maths and Science by 2030. The Department will continue to seek initiatives and strengthen institutional mechanisms such as the Mathematics, Science and Technology (MST) Grant and the Funza Lushaka Bursary Programme to promote teaching and learning of these subjects. The class of 2015 was the largest cohort in the history of our country. The total number of candidates who registered for the November 2015 NSC examinations was 799 306; written by 667 925 full time candidates and 131 381 part time candidates. As a way of responding and in addressing the challenge of learners dropping out of the system, the basic education sector supported progressed learners through various interventions. The basic education sector will continue to support progressed learners and the youth of our country through the Second Chance programme. The Department, together with key stakeholders, has begun a process of remodelling the Annual National Assessments (ANA). The Department is confident that the new model will receive the support of all parties before it is finally presented to the Council of Education Ministers for consideration and adoption. 4 ANNUAL PERFORMANCE PLAN
Timely supply and distribution of high quality Learning and Teaching Support Materials (LTSM) remain a key strategic priority
of the Department. Together with proper and safe school infrastructure, these resources provide an environment which is
conducive for teaching and learning. The department will continue to monitor both the delivery of these key resources in the
system and prudent spending, especially on provincial infrastructure budgets.

The diagnostic reports from our national assessments will form the basis for teacher development programmes. At the Basic
Education Sector Lekgotla held from 20 – 22 January 2016, the conference advocated that the diagnostic report be used as a
starting point to inform subject specific intervention for teacher development programmes.

The Department will continue to use education districts engagements, meetings to ensure that schools receive optimal support
and that early warning systems for speedy resolution of challenges are part of monitoring and evaluation of the sector at all
levels.

The Department will continuously reflect on its pro-poor policies to assess if these are comprehensive enough to alleviate the
plight of the South African learners from disadvantaged backgrounds. We are currently pleased with the number of learners
and communities benefitting from our National School Nutrition Programme (NSNP) and the No Fee School policy.

We are pleased with the continued support that we receive from all our partners and stakeholders in the sector and we
encourage all citizens and different community formations to continue contributing towards improving our education system.

We are confident that the plans articulated in this Annual Performance Plan, as well as in the basic education sector plan,
Action Plan to 2019: Towards the Realisation of Schooling 2030, are a solid step towards improving our education system.

Mrs AM Motshekga, MP					                                     Mr ME Surty, MP

Minister							Deputy Minister

                                                                                  2016/2017                               5
OFFICIAL SIGN-OFF
It is hereby certified that this Annual Performance Plan:
- Was developed by the management of the Department of Basic Education under the guidance of the Minister of Basic
Education;
- Was prepared in line with the current Strategic Plan of the Department of Basic Education; and
- Accurately reflects the performance targets which the Department of Basic Education will endeavour to achieve, given the
resources made available in the budget for 2016/2017.
____________________
N Molalekoa
Chief Financial Officer
_____________________
VC Carelse
Deputy Director-General, Office of the Director-General
_____________________
HM Mweli
Director-General
Approved by:
______________________
Mrs AM Motshekga, MP
Minister
6 ANNUAL PERFORMANCE PLANPART A: STRATEGIC OVERVIEW
The Department has revised its five-year Strategic Plan to ensure that the strategic objectives are measurable. A new set of
indicators linked to the core functions and the budget of the Department were also developed.
This Annual Performance Plan represents the second year of activities towards achieving the objectives as contained in the DBE
Strategic Plan 2015/16-2019/20. The DBE’s Strategic Plan is anchored on the government’s Medium Term Strategic Framework
(MTSF 2014-2019)
1. UPDATED SITUATIONAL ANALYSIS
1.1 PERFORMANCE DELIVERY ENVIRONMENT
Access to Educational Institutions
Fig 1: Percentage of 7 to 15 year old children attending educational institution, 2002-2014
Compulsory education: There is an increase in the percentage of 7 to 15 year old children attending educational institutions in 2014 to 99%.
Source: Stats-SA General Household Survey (GHS: 2014) DBE calculations.
Table 1: Percentage of 16 to 18-year-old learners attending educational institutions by province, 2002 to 2014
Province 2002 2003 2005 2006 2007 2008 2009 2010 2011 2012 2013 2014
EC 83.0 78.5 80.9 83.9 85.4 83.0 80.9 81.8 83.3 85.1 84.4 82.6
FS 85.4 86.0 88.7 83.3 90.7 85.8 83.8 83.9 86.3 87.2 86.4 91.4
GDE 87.7 86.5 84.2 80.6 82.2 85.6 87.2 85.1 81.7 85.7 85.0 87.5
KZN 79.3 81.9 81.4 83.3 83.7 84.6 80.7 80.5 85.7 85.3 87.7 86.5
LMP 88.2 89.3 87.4 89.3 92.1 90.0 91.5 92.0 93.1 94.2 94.5 93.2
2016/2017 7Province 2002 2003 2005 2006 2007 2008 2009 2010 2011 2012 2013 2014
MP 86.2 57.7 86.7 85.5 93.2 87.1 84.5 85.2 86.7 85.4 84.4 86.3
NW 81.2 80.8 83.9 84.1 81.6 79.1 81.4 79.2 84.9 81.9 84.5 79.9
NC 71.0 67.7 75.4 71.9 77.8 76.0 73.4 79.6 79.2 80.6 82.7 76.3
WC 72.6 73.2 69.7 66.0 73.7 71.6 73.7 73.6 76.4 80.4 78.6 81.1
National 82.9 79.3 82.4 82.5 85.0 83.9 82.9 82.9 84.9 85.9 86.1 86.1
Source: (GHS: 2014) DBE calculations.
The SASA, 1996 requires parents to ensure that their children attend school from the first school day of the year in which they
turn 7 years old, until the last school day of the year in which they turn 15 years old, or the end of Grade 9, whichever comes first.
In 2014, the Stats SA General Household Survey findings show that 99% of 7- to 15-year-old children were attending educational
institutions. In 2014, approximately 530 589 children aged 7 to 18 were not attending any education institution, of which the
majority (4 in 5) were in the 16 to 18 age group; and 1 in 5 were disabled. While there has been improvement in access, there
is a small gap (1,2%) that still needs to be bridged to ensure that all children have access to compulsory basic education. For the
secondary education, there is an increase in the percentage of 16 to 18 year old children attending educational institutions in
2014 to approximately 86.1%.
• Contribution to the South African Economy
The South African economy relies heavily on the availability of human capital; and the education sector is looked upon as the
centre from which skills should be attained in key subjects that drive the development of a healthy economy. There is a need
for the sector to improve the learning outcomes; especially because the sector still has a high portion of government spending.
In nominal terms, education spending more than tripled from 2000/01 to 2013/14. The current situation is that the quality
of education for black children is still largely poor, meaning employment, earning potential and career mobility is reduced
for these learners. This in itself limits the growth of the South African economy; hence there is pressure on the sector to turn
around this status quo by improving its learning outcomes in scarce skills subjects like Mathematics, Science and Technology.
Figure 2 below shows that between 35-65% of the 20-60 year-olds have no income, and these are South Africans who have no
schooling at all, or at least have a Grade 12 certificate; while between 20-25% of the same age-groups, who have no income,
either have Diplomas of Bachelors degrees.
Fig2: Correlation between income, age and levels of education achieved
Source: (GHS), 2002-2014.
8 ANNUAL PERFORMANCE PLANDeriving from the Minister of Finance’s budget policy statement in 2016, the context of delivery is one characterized by fiscal
and other constraints. The global economic crisis has been more severe and persistent than anyone could have foreseen.
The economy has continued to grow at a slow pace, reflecting global and domestic factors, but it will still be necessary to
enable growth and structural reforms over the medium term. South Africa has set goals towards eradicating poverty, reducing
inequality and growing the economy. The NDP articulates that education, training and innovation are critical in the attainment
of goals the country has set for itself.
• Partnerships in Education Delivery
The sector can only implement the transformational reforms with a clear plan and a determination to act with urgency. The NDP
provides a platform for building new national partnerships that involve government, the private sector, labour and civil society.
In response, the NECT has been established, which is a joint partnership of business, government and civil society to work on a
whole-district developmental approach to the schooling system.
• Building an Efficient State
Initiatives are already underway to strengthen infrastructure planning and implementation, to attack inefficiency, waste and
fraud, and to strengthen public procurement. Cost containment measures are continuously being implemented to limit elements
of the recurring spending in the public sector. The Department utilises the performance management systems to make sure
that all senior managers sign Performance Agreements. During the 2016/17 financial year these Performance Agreements will
be linked to the Annual Performance Plan indicators and targets as a way of improving accountability.
Accountability for what is done, how it is done, and the quality of learning outcomes is paramount to the basic education
system. With the large interventions introduced in the last five years (CAPS, ANA, workbooks and infrastructure), the focus will
be on how these are translated into improvements in classrooms and in schools across the country – particularly those that
serve the poorest of our learners. Everything that happens in the basic education system will be related to shifting the system
in support of the sector plan. District managers and school principals will be held accountable for school administration and
curriculum implementation.
• Benchmarking Learner Performance: Participation in International Assessments
The basic education sector continues to be committed to its participation in international examination/assessments such as
Trends in Mathematics and Science Studies (TIMSS), Progress in Reading and Literacy Study (PIRLS) and the Southern Africa
Consortium for Monitoring Educational Quality (SACMEQ). In fact, it is a commitment by the Department which lies behind the
realisation among policymakers around 2005 that the sector needed to change its strategies fundamentally if quality schooling
for all is to be achieved. The department is keenly awaiting finalisation of the 2015 SACMEQ results which was done in 298
schools. The fieldwork for TIMSS 2015 study has been completed.
• School Infrastructure Development
School infrastructure should provide a safe environment for effective teaching and learning. While funding has been made
available to deal with school infrastructure backlogs, Provincial Education Departments (PEDs) have not been able to drive school
infrastructure projects with the anticipated momentum, hence the National Department was tasked with the responsibility of
eradicating mud and unsafe school structures through the ASIDI project to bring about dignity in education. The ASIDI project
in its current form is coming to an end in 2017/18 .
2016/2017 91.2 ORGANISATIONAL ENVIRONMENT • Structure of the Institution During 2015/16, the DBE made significant progress in the process of reconfiguring the organisational structure to meet the needs of the sector, especially to take full responsibility for monitoring and overseeing the implementation of programmes by provinces. The Department has moved expeditiously towards filling all vacant posts as a result of the restructuring process. During this year, a substantive post of Director-General was filled for the appointee to take the responsibilities of the Accounting Officer and to give impetus to the delivery of education in this current five-year term. The Department is in the process of internal reconfiguration stemming from the mandate of the Minister after the 2014 elections. Branch heads have made inputs in terms of staffing requirements and the re-organisation of branches to meet the strategic intent of the Department. All employees have been consulted on the reconfigured structure, and inputs have been provided to the task team working on this matter. The Department is in the process of finalising the organisational structure and following through all due processes in terms of tabling the structure at a workplace forum once the proposal has been finalised. Capacity building of employees is continuously done through the Workplace Skills Plan and the personal development plans of officials in the DBE. Training interventions for employees are informed by the Department’s performance management outcomes, as well as the demands of the Action Plan to 2019. Furthermore, in response to natural attrition at middle and senior management (SMS) team levels, the Department has put in place a development plan to address the issues related to career-pathing and succession planning. To this end, the DBE sends over 250 officials a year to attend courses for professional and personal development. The Departmental administrative systems, i.e. Human Resource Management, Financial management, Internal Audit and Risk Management and Strategy development, have not performed very well as reflected in the Management Performance Assessment Tool (MPAT 1.4) results of the 2014/15 financial year. The Department is moving towards including MPAT indicators in the Performance Agreements of senior managers. • The DBE’s Oversight Role and Responsibility to Provinces The past term has seen the DBE having to implement section 100(1)(b) in two provinces due to concurrent functions that were not clearly managed. The Department improved accountability in the system through current engagement structures with the provinces and districts, hence during 2015/16, section 100 (1)(b) was lifted in the case of the Limpopo Department of Education. Working closely with provinces has enabled the DBE to assess management at classroom, school, district and provincial levels. This engagement will continue in the 2015 to 2020 period to heighten accountability at all levels of the system. A more deliberate effort will be made to strengthen the DBE’s capacity to monitor and support provincial departments. Provincial support visits, especially in PEDs that performed poorly in the 2015 NSC Examination, will be undertaken to ensure that learning outcomes are improved. 10 ANNUAL PERFORMANCE PLAN
•         Overall Performance of the Department in the Last Five-Year Term

The National Department of Education, being responsible for a concurrent function, has made strides in monitoring specific
areas of performance: The figures below reflect an overview of that performance as expressed in the 2014 GHS.

Fig 3: Percentage of 5 year old children attending educational institution, 2002 – 2014

Grade R participation: There is an increase in the percentage of 5 year old children attending educational institutions in 2014 to 87% (GHS:
2014) DBE calculations.

                                                                                             2016/2017                                   11
Fig 4: Percentage of disabled children attending school (irrespective of age), 2002 to 2014
6,0
5,2
5,0 4,8
4,5 4,3 4,6
4,0 3,5
Percentage
3,0
2,0
1,1 1,1 1,1 0,9 1,3
1,0 0,6 0,6
0,0
2002 2003 2004 2005 2006 2007 2008 2009 2010 2011 2012 2013 2014
Of the total population of learners attending schools, approximately 5% were learners with disabilities. There is a slight decrease in the
percentage of 5 year old children with disabilities attending educational institutions in 2014 to almost 84% in 2014. The percentage of 16 to
18 year old children with disabilities is 54% in 2014 (GHS: 2014) DBE calculations.
Adult Literacy
Table 2: Adult Literacy coverage from 2008 to 2014
Learners per Province 2008 2009 2010 2011 2012 2013 2014
Eastern Cape 109 633 148 084 135 141 136 799 129 999 114 647 34 827
Free State 15 406 52 323 52 409 54 781 49 834 45 601 35 100
Gauteng 31 827 81 152 87 043 85 543 86 402 87 497 85 679
KwaZulu Natal 72 032 135 443 131 359 145 475 129 357 119 886 145 613
Mpumalanga 28 792 58 624 51 786 55 577 50 894 47 761 106 516
Northern Cape 31 928 8 141 8275 12 839 8 785 14 098 31 777
Limpopo 45 928 106 463 100 965 97 217 97 164 90 283 143 788
North West 34 317 30 607 31 532 35 803 32 685 32 157 80 000
Western Cape 11 999 13 166 12 771 15 415 15 044 14 434 20 700
Total 381 862 634 003 611 281 639 449 600 164 566 364 684 000
Total graduates (2008-2013) 3 433 123
The sector is on its way to achieving its target of reaching 4.7 million adults through Kha Ri Gude Mass Literacy Programme (DBE: Kha Ri
Gude 2008-2014).
12 ANNUAL PERFORMANCE PLANRedress
Table 3: Number and percentage of learners and schools benefiting from the No-fee School Policy by province, 2014
Learner numbers Total no fee Percentage no Schools in Total no fee Percentage no
Province
in 2014* learners fee learners 2014* schools fee schools
EC 1 728 456 1 612 873 93.3% 5 554 5 336 96.1%
FS 621 488 500 591 80.5% 1 306 1 146 87.7%
GP 1 836 220 1 163 008 63.3% 2 070 1 338 64.6%
KZN 2 636 562 1 925 783 73.0% 5 915 4 981 84.2%
LP 1 665 516 1 600 609 96.1% 3 929 3 831 97.5%
MP 973 385 888 940 91.3% 1 762 1 632 92.6%
NC 265 993 180 302 67.8% 551 412 74.8%
NW 784 184 685 095 87.4% 1 515 1 372 90.6%
WC 962 724 554 523 57.6% 1 458 887 60.8%
TOTAL 11 474 528 9 111 724 79.41% 24 060 20 935 87.0%
66% of learners attending schools were not paying school fees. The percentage of earners who are paying between R 1 to R 100 is almost 5%,
this could include voluntary payments. Therefore overall, 71% of learners could be benefiting from the no fee school policy (DBE: Financial
Planning 2014).
National School Nutrition Programme Reach, 2014
Table 4: Percentage of learners with access to the School Nutrition programme
Province 2010 2011 2012 2013 2014
Eastern Cape 75.3 82.9 85.3 86.7 88.3
Free State 65.8 75.3 77.0 78.7 78.0
Gauteng 53.8 55.3 55.3 59.8 63.4
KwaZulu-Natal 67.5 76.0 79.2 80.5 79.4
Limpopo 84.7 94.4 94.7 93.5 94.3
Mpumalanga 75.5 84.2 85.9 85.7 88.8
North West 69.6 80.7 83.4 82.8 85.3
Northern Cape 89.3 89.7 88.0 84.7 84.0
Western Cape 66.7 64.0 63.4 66.0 65.0
National 69.9 76.2 77.4 78.7 79.7
Overall, approximately 79% of learners were benefitting from National School Nutrition Programme (NSNP) in 2014. Limpopo has the highest
percent of learners benefitting from NSNP at 94%, while Gauteng has the lowest percentage of learners partaking in the NSNP at 63% (DBE:
National School Nutrition Programme).
2016/2017 13Quality Fig 5: Number of NSC Bachelor passes, 2008 – 2014 The quality of the National Senior Certificate results have been improving with greater number of Bachelor passes expressed in 2013 (DBE: Assessments and Examinations). Efficiency Fig 6: Percentage of Repeaters by Grade 2009 to 2014 Overall, the percentage of learners repeating a class has decreased to 11% in 2014. Repetition of class in Grades 9 to 11 remains high. The average primary class repetition is 8% in 2014, while the average secondary class repetition is 15% in 2014. The greatest current challenge is to ensure that the approximately 15% of South African children who do not complete Grade 9 do so, and improving retention rates for learners, especially in the FET band (Grades 10 to 12) (GHS: 2014) DBE Calculations. 14 ANNUAL PERFORMANCE PLAN
Textbooks and Workbooks

Fig 7: Percentage distribution of workbooks by Grade

Access to Language Workbooks is 96% in 2014, while for Mathematics Workbooks it is approximately 97% in 2014. Access to textbooks in all
subjects is almost 78% in 2014. The overall percentage of learners who indicated they had experienced a lack of books at school has decreased
to approximately 4% in 2014 (GHS: 2014) DBE Calculations.

•      Challenges in the Education System

Human Resource Management

Poor Human Resource Development Strategies (Teacher Development Programmes in particular): Numerous strategies for the
development of officials in the system are in place; and training has always been prioritised and budgeted for, but the return on
investment is not commensurate with the benefit derived from the trained employees.

Inappropriate and the wrong appointment of personnel at different levels

This is largely prevalent in schools, hence the call by the National Development Plan to make sure that principals are appointed
on merit based on competency tests.

Poor retention strategy of personnel: The education system is not able to retain a good number of its employees, especially at
school level, which is the core education delivery point. Officials continue to empower themselves in other areas, and leave the
system soon after qualifying for other professions. In critical areas of teaching such as Mathematics and Science, such officials
leave the sector to work and specialise in science-related professions outside education. Retention strategies and incentives
are either not attractive enough or not in place to retain the skills set in the system.

Leadership and Management

Poor teaching, leadership and lack of accountability: At school level, pockets of poor teaching in schools, which leads to
poor results, is still persistent. Part of the problem resides with management capacity at school level to deal decisively with
monitoring and management of curriculum delivery. Some principals are not equipped with skills relating to accountability at
that level, and this leads to poor administration and management, hence the need for leadership and management training.

                                                                                            2016/2017                                   15
No consequences for poor performance and wrong doing: Accountability is the core function of al managers in the system at
the various levels existent in the sector. Wrong doing, failure to comply with legislation, under-performance and poor financial
management are just some of the areas that need tight accountability by those in charge, and this is lacking in a number of
institutions, districts and schools.
Systems for Managing Concurrent Functions
The Department has concurrent functions with provinces, and to enable the entire system to be managed efficiently, the
national Department must put in place Norms and standards for all programmes and services for the sector. These norms are
not yet developed in all areas of the system, and this makes it difficult to hold provinces accountable for poor delivery or lack
thereof. Norms and standards would also ensure a uniform implementation of laws and policies. Secondly, for the various
functions of the Department, there is a lack of clearly delineated business processes at all levels of the system. This creates
unnecessary blockages for service delivery.
Poor Audit Outcomes
In the last three to four years, the audit outcomes of the sector have not been reflective of a system that is improving, especially
in the area of pre-determined objectives. Three provinces have been consistent with good performance but the National
Department and the rest of the provinces need to improve their performance information management systems and strategies
during this five-year term.
• Opportunities for the System
Partnerships: the establishment of the National Education Collaboration Trust (NECT) affords the Department with an
opportunity to join hands with the private sector in delivering education, especially for these partnerships to venture into areas
that are not easily penetrated by the education system.
The National Development Plan, as a broad government plan ensures that education deliverables are understood by the public
not only to attract the interest of the broader public to partner with education for education delivery, but also to create a sense
of urgency in the sector to deliver quality services within the existing budget constraints.
Operation Phakisa as a broad strategy to unlock service delivery in the public sector, enables the education sector to work
collaboratively with other Departments and the private sector to unlock blockages in the system and to give impetus to finding
creative strategies of delivering quality education to all learners. Through Operation Phakisa , a key service delivery area is
identified and officials from the sector, private sector and NGOs all came together for about 4-8 weeks to unpack the challenges
within the system. Through consultation with the political leadership of other government Departments that are also affected
by this challenge, a three feet detailed plan is drawn up. In the sector, ICT in Education is the area that has been identified. A 6
week lab has already been held on 6 September – 2 October 2015 and the draft plan is in place.
Threats to the System
Resignation of personnel (teachers in particular) to cash their pensions: In the last year, the sector has been experiencing
resignation of teachers in pursuit of pension funds due some misunderstanding of the review of Pension Fund administration.
For some teachers, this has marked the end of their careers, leaving the system with teacher shortages which were unplanned
for.
Small schools that are not educationally and economically viable: The sector continues to have small schools across provinces,
especially in rural areas, which are not viable for teaching and learning. This affects the distribution of resources in the sector,
and such resources are not always optimally utilised. In terms of teacher provisioning, the allocation models do not respond
adequately to the needs of such schools, and the quality of teaching and learning is compromised. Continued provision of
resources to these schools is counter-productive because it is expensive.
16 ANNUAL PERFORMANCE PLANPoor involvement of civil society in education: Education is a societal issue, and participation of all stakeholders is critical.
The continued absence or inadequate participation of the citizenry creates a gap in the input and benefits that would have
benefitted the primary client, the learner.
2. REVISIONS TO LEGISLATIVE AND OTHER MANDATES
2.1. REGULATIONS
There are no significant changes to the legislative and other mandates.
2.2. PENDING COURT CASES
Basic Education for all and Others Versus Minister of Basic Education and Others
The judgment in this matter was delivered on 2 December 2015.
In this matter, the Court had to determine whether or not the right to basic education includes the right of every learner at
public schools to be provided with a textbook for each subject in time for the commencement of the teaching of the curriculum
at the beginning of the school academic year. The Court’s answer to this question is in the affirmative; and it declares that
section 29(1)(a) of the Constitution entitles every learner at public schools to be provided with every textbook prescribed for
his or her grade before commencement of the teaching of the course for which the textbook is prescribed.
In terms of this court ruling, Provincial Education Departments (PEDs) will have to ensure that textbooks are ordered in time
and delivered to public schools prior to the opening of such schools for the new academic year in January. This case will also
have budgetary implications for PEDs in that they will have to ensure that their budgets are sufficient to provide for the needs
of all learners.
2016/2017 1718
3. OVERVIEW OF 2016/2017 BUDGET AND MTEF ESTIMATES
3.1 EXPENDITURE ESTIMATES
Adjusted
Audited Outcomes Medium-term expenditure estimate
appropriation
Programme R’000 R’000
R’000
2012/13 2013/14 2014/15 2015/16 2016/17 2017/18 2018/19
1. Administration 317 328 366 500 380 799 360 297 377 893 396 603 418 553
Curriculum Policy, Support
2. 1 398 906 1 469 592 1 685 219 1 844 922 1 936 100 1 909 648 2 019 006
and Monitoring
Teachers, Education Human
3. Resources and Institutional 820 577 1 010 829 1 314 462 1 163 353 1 163 742 1 219 284 1 290 555
Development
Planning, Information and
4. 6 897 873 8 435 609 10 428 875 11 974 032 12 500 176 13 334 175 14 106 751
Assessment
Educational Enrichment
5. 5 451 200 5 728 564 5 719 548 5 943 822 6 291 684 6 611 329 6 994 731
ANNUAL PERFORMANCE PLAN
Services
TOTAL 14 885 884 17 011 094 19 528 903 21 286 426 22 269 595 23 471 039 24 829 5963.2. RELATING EXPENDITURE TRENDS TO STRATEGIC OUTCOME-ORIENTED GOALS
Over the Medium-Term Expenditure Framework (MTEF) period, the Department of Basic Education will focus on: improving
school infrastructure; improving curriculum delivery; reducing illiteracy and increasing the number of learners completing
grade 12 (Matric); ensuring the adequate supply of quality teachers; and assessing the quality of teaching and learning. It will
also continue to offer the National School Nutrition Programme.
The Department’s Compensation of Employees’ budget has been reduced by R30.7 million for 2017/18 and R48.6 million for
2018/19, as part of the Cabinet’s decision to lower the national aggregate expenditure ceiling. After consultation with the
Department of Public Service and Administration and National Treasury, the Department will develop and implement a plan to
manage its personnel expenditure within its reduced personnel budget.
Improving School Infrastructure
Sub-outcome 2 (improve the quality of teaching and learning through the provision of infrastructure and learning materials)
of outcome 1 (quality basic education) of the 2014-2019 Medium-Term Strategic Framework (MTSF) commits Government
to invest in school infrastructure and school maintenance, and to ensure that every school meets the required Norms and
Standards for effective learning and teaching. Infrastructure activities account for the bulk of the Department’s spending over
the medium term, particularly in the Planning, Information and Assessment programme.
Through the School Infrastructure Backlogs Grant, the Department expects to have replaced 510 inappropriate and unsafe
schools, and provided water to 1 120 schools, sanitation to 741 schools and electricity to 916 schools across South Africa by
2018/19. R2.4 billion is allocated for this purpose in 2016/17 in the Infrastructure subprogramme. The School Infrastructure
Backlogs Grant will shift to the Education Infrastructure Grant from 2017/18. This grant is transferred to provinces and explains
the decrease in the Department’s budget for buildings and other fixed structures over the medium term. R35.9 billion over
the medium term is allocated to provinces through the Education Infrastructure Grant. A funding window will be provided in
the Education Infrastructure Grant for the completion of School Infrastructure Backlogs projects contracted by the national
Department prior to the shifting of the funds. Projects include building new schools, upgrading and maintaining existing
infrastructure, and providing school furniture. The balance of the funds will be used for specific purposes such as school
maintenance or to replace unsafe structures at schools.
The Department has issued minimum Norms and Standards for school infrastructure, which all schools are expected to meet
by March 2017. The Education Infrastructure Grant to provinces provides funding for meeting these Norms and Standards, and
the provinces make co-contributions.
Improving Curriculum Delivery
Ensuring access to high quality learning and teaching support materials is key to improving curriculum delivery. The Department
plans to print and distribute approximately 180 million workbooks to schools over the MTEF period at a projected cost of R3.2
billion, funded in the Curriculum and Quality Enhancement Programmes subprogramme in the Curriculum Policy, Support and
Monitoring programme. The workbooks provide activities that ensure that learners work to the required standard, and assist
teachers to pace their work so that all elements of the curriculum can be completed on time. The Department has appointed
eight officials on annual renewable contracts at deputy and assistant director levels to assist provinces with project co-ordination
and monitoring, and to ensure that the correct workbook deliveries are made to districts. These officials, stationed in the
provinces, will also investigate and report on any challenges to the correct delivery of workbooks.
The Department will also provide infrastructure, equipment and teacher training to improve participation and success rates
in Mathematics, Science and Technology, including structured training programmes in technical Maths and Science for subject
advisors and teachers. This is projected to cost 1.2 billion over the MTEF period, and is funded from the Maths, Science and
Technology Grant in the Curriculum Implementation and Monitoring subprogramme.
2016/2017 19Reducing Illiteracy and Increasing the Number of Learners Completing Grade 12 (matric) The Kha Ri Gude Mass Literacy Programme is aimed at reducing adult illiteracy through teaching learners aged 15 and older basic literacy and numeracy skills in the eleven official languages. Kha Ri Gude reached 3.9 million illiterate adults at a cost of R2.97 billion between the programme’s inception in 2008/09 and 2014/15. The Department expects to reach the remainder of the targeted 4.7 million by 2016/17, after which the programme will be phased out and funds redirected to the Second Chance matric programme. This explains the decrease over the medium term in the budget of the Kha Ri Gude Literacy Project subprogramme of the Teachers, Education Human Resources and Institutional Development programme and the increase of 129.4 per cent in the Curriculum Implementation and Monitoring subprogramme of the Curriculum Policy, Support and Monitoring programme, where the Second Chance programme is located. A new focus for the Department over the medium term is the Second Chance matric programme, which gives learners an opportunity to rewrite the National Senior Certificate examination. The Department plans to enrol between 10 000 and 30 000 learners in the Second Chance programme by 2018/19. Implementation will cover four areas: direct tuition, technology and electronic media, learner and teacher support materials, and self-study. The pilot will start in 2016/17, offering direct tuition in two districts per province at two schools per district. The districts selected will be those with a high number of learners qualifying for supplementary examinations. Teachers from the best performing schools in these districts will provide the tuition. About 10 000 of the approximately 120 000 learners who qualify to write the supplementary examinations every year will be involved in the pilot, which will focus on seven subjects that have a high failure rate. The pilot will reach additional learners through the programme’s technology and electronic media activities. The pilot will cost R50 million in 2016/17. These funds will be used for advocacy, to launch and advertise the programme, to reimburse teachers for direct tuition, and to provide learner and teacher support materials. Ensuring the Adequate Supply of Quality Teachers The Department aims to increase the number of qualified teachers aged 30 and below entering the public service from 8 000 in 2014/15 to 10 800 in 2018/19. The Department expects to award 38 000 Funza Lushaka bursaries over the medium term at a cost of R3.3 billion to prospective teachers in priority subject areas such as Mathematics, Science and Technology. The allocation for the bursaries increases by inflation, but the President has proclaimed a zero increase in university fees in 2016. Hence the allocation can support 500 more bursaries (14 000) than the initial target of 13 500 for 2016/17. These bursaries are provided through the National Student Financial Aid Scheme (NSFAS), funded by transfers from the Department through the Education Human Resources Development subprogramme in the Teachers, Education Human Resources and Institutional Development programme. Assessing the Quality of Teaching and Learning One of the education sector’s goals is to assess the quality of teaching and learning below grade 12, with the aim of identifying schools that need support and the type of support they need. This is in line with sub-outcome 3 (conducting regular Annual National Assessments to track performance across the system) of the 2014-2019 MTSF, Over the medium term, the Department’s ANA process will track the progress of approximately nine million learners. The Department will set, print and moderate question papers for the NSC examinations and the ANA, which accounts for the high proportion of expenditure on travel and subsistence (for examiners and moderators) and stationery and printing in the National Assessments and Public Examinations subprogramme in the Planning, Information and Assessment programme over the medium term. This allocation has been reduced by R 300 million over the MTEF period, as part of the Cabinet decision to lower the national aggregate expenditure ceiling. The Department will use the R376.3 million that has been set aside over the period for the ANA to administer the assessments. A new model for this process is under discussion. National School Nutrition Programme The Department’s National School Nutrition Programme will continue to contribute to the National Development Plan’s priority of eliminating poverty and supporting food security by providing meals to 19 800 schools each year. This is projected to cost R19 billion over the MTEF period through the National School Nutrition Programme Grant in the Educational Enrichment Services programme. 20 ANNUAL PERFORMANCE PLAN
PART B: PROGRAMME AND SUB-PROGRAMME PLANS
4.     DEPARTMENTAL PROGRAMMES: STRATEGIC OBJECTIVES, PROGRAMME
       PERFORMANCE INDICATORS AND ANNUAL TARGETS FOR 2016/2017
Changes to the Budget Programme Structure:

None

4.1. PROGRAMME 1: ADMINISTRATION

Programme Purpose: To provide strategic leadership, management and support services to the Department. Sub-programmes:
Ministry; Department Management; Corporate Services; Office of the Chief Financial Officer; Internal Audit and Risk
Management; and Office Accommodation.

Strategic Objective:

•      To improve the administrative and governance systems through compliance to the key legislations governing
       administration, in order to support the delivery of education and to strengthen accountability

Programme Performance Indicators and Annual Targets for 2016/2017 to 2018/2019

The Programme: Administration is responsible for managing the Department through the provision of strategic leadership,
management and support services to the Department. The programme contributes to quality in the basic education system
through effective institutional service delivery processes, planning and provisioning. Vacancy management, human resources
development and performance management have been prioritised to increase the efficiency and capacity of the Department
to deliver its mandate in terms of delivery of services to the public and the professional development of staff. The indicators
in this programme are directed towards performance improvement and development, compliance, accountability and sound
financial systems. The activities of the programme support Action Plan to 2019: Towards the Realisation of Schooling 2030 and
cut across all its goals.

Key processes will be strengthened in 2016 to support the Department in respect of administrative procedures and systems.
The Management Performance Assessment Tool (MPAT) is co-ordinated by the Department of Performance Monitoring and
Evaluation (DPME). The DPME conducts annual assessments of the quality of generic management practices in Departments. The
aim of these assessments is to get managers to monitor regularly the effectiveness of their management practices and to
implement improvement plans where necessary. Following through on the recommendations of the 2015 MPAT and responding
to the findings of the Auditor-General in respect of institutional performance improvements will be priorities in the 2016/2017
financial year.

The Department will strengthen the use of and systems associated with performance information and data in 2016, with the
assistance of the office of the Chief Information Officer and internal auditing procedures, to improve institutional management
and outcomes at national level and in PEDs.

The Department will strive for an unqualified audit report with no matters of emphasis. The Internal Audit function will be
supported to strengthen good governance and control processes and compliance with regulations. The Department will
strengthen the management of litigation through its legal unit, which will provide legal advice and monitor and support PEDs
in the management of court cases.

The Department will avail cutting edge staff development programmes to improve skills and capacity.

                                                                                   2016/2017                               21
Strategic Objective Annual Targets for2016/2017 to 2019/2020
22
Estimated
Audited/Actual performance Medium-term targets
Strategic objective performance
2012/13 2013/14 2014/15 2015/16 2016/17 2017/18 2018/19 2019/20
1.1 To improve the administrative and governance
systems through compliance to the key 55% MPAT 65% MPAT 54% MPAT 56% MPAT 58% MPAT 60% MPAT 62% MPAT 64% MPAT
legislations governing administration in order scores at scores at scores at scores at scores at scores at scores at scores at level
to support the delivery of education and to level 3 and 4 level 3 and 4 level 3 and 4 level 3 and 4 level 3 and 4 level 3 and 4 level 3 and 4 3 and 4
strengthen accountability
Programme Performance Indicators and Annual Targets for 2016/2017 to 2018/2019
Strategic Estimated
Audited/Actual performance Medium-term targets
Strategic objective Programme Performance Indicator Plan performance
Target 2012/13 2013/14 2014/15 2015/16 2016/17 2017/18 2018/19
1.1 To improve administrative Percentage of Service providers within
and governance systems the procurement unit paid within 30 100% - - - - 100% 100% 100%
ANNUAL PERFORMANCE PLAN
through efficient corporate days.
services in order to support
Percentage of received misconduct cases
the delivery of education and 90% - - 50% 75% 80% 85% 85%
resolved within 90 days
to strengthen compliance
and accountability Percentage of received grievances cases
90% - - 70% 70% 75% 80% 80%
resolved within 30 days
Reporting Annual target Quarterly targets
Programme Performance Indicator
period 2016/17 1st 2nd 3rd 4th
1.1.1 Percentage of Service providers within the procurement unit paid within 30
Annual 100% 100% 100% 100% 100%
days.
1.1.2 Percentage of received misconduct cases resolved within 90 days Quarterly 80% 80% 80% 80% 80%
1.1.3 Percentage of received grievances cases resolved within 30 days Quarterly 75% 75% 75% 75% 75%Reconciling Performance Targets with the Budget and MTEF
Adjusted
Audited Outcomes Medium-term expenditure estimate
appropriation
Sub-Programme R’000 R’000
R’000
2012/13 2013/14 2014/15 2015/16 2016/17 2017/18 2018/19
Ministry 22 875 29 748 27 423 25 640 27 163 28 830 29 476
Departmental Management 53 571 61 831 81 190 65 478 63 756 68 862 71 631
Corporate Services 72 226 86 114 54 078 50 176 54 227 54 626 57 946
Office of the Chief Financial Officer 25 301 34 495 55 847 47 515 51 948 54 374 58 538
Internal Audit and Risk Management 4 317 5 397 5 608 5 370 5 877 6 243 6 596
Office Accommodation 139 038 148 915 156 653 166 118 174 922 183 668 194 321
Total 317 328 366 500 380 799 360 297 377 893 396 603 418 553
Economic Classification
Current payments 291 017 334 453 363 818 341 700 366 910 385 091 406 374
Compensation of employees 95 316 114 402 125 057 129 246 135 296 145 212 153 087
Goods and services 141 919 169 761 189 779 164 930 185 293 191 242 201 829
Computer services 16 253 18 349 22 080 16 168 17 990 17 135 18 129
Lease payments 804 941 732 1 222 1 470 1 532 1 631
Property payments 73 863 84 188 93 063 99 826 119 059 125 067 132 309
Travel and subsistence 17 622 15 262 16 398 17 906 15 065 16 808 17 805
Interest and rent on land of which: 51 465 50 290 48 982 47 524 46 321 48 637 51 458
2016/2017
Transfers and subsidies 12 271 15 421 638 420 195 205 217
Departmental agencies and accounts 184 167 177 185 195 205 217
Foreign Government and International Organisations 11 987 15 063 - - - - -
Households 108 191 461 235 -
2324
Adjusted
Audited Outcomes Medium-term expenditure estimate
appropriation
Sub-Programme R’000 R’000
R’000
2012/13 2013/14 2014/15 2015/16 2016/17 2017/18 2018/19
Payments for capital assets 16 391 16 621 16 343 18 177 10 788 11 307 11 962
Buildings and other fixed structures 6 623 5 700 13 473 14 225 7 216 7 577 8 016
Machinery and equipment 9 703 10 739 2 870 3 852 3 444 3 596 3 804
Software and other intangible assets 65 182 - 100 128 134 142
Payments for financial assets - 5 - - - - -
Total 317 328 366 500 380 799 360 297 377 893 396 603 418 553
ANNUAL PERFORMANCE PLANPerformance and Expenditure Trends: Programme 1
The bulk of spending in this programme over the medium term is in the Office Accommodation sub-programme, from where
the public-private partnership unitary fee is paid for the office building the Department occupied in February 2010.
The Department’s Compensation of Employees budget has been reduced by R30.7 million for 2017/18 and R48.6 million
for 2018/19, as part of Cabinet’s decision to lower the national aggregate expenditure ceiling. After consultation with the
Department of Public Service and Administration and the National Treasury, the Department will develop and implement a plan
to manage its personnel expenditure within its reduced personnel budget.
4.2. PROGRAMME 2: CURRICULUM POLICY, SUPPORT AND MONITORING
Programme Purpose: Develop curriculum and assessment policy and support; monitor and evaluate curriculum implementation.
Sub-programmes: Programme Management: Curriculum Policy, Support and Monitoring; Curriculum Implementation and
Monitoring; Curriculum Enhancement Programmes; Kha Ri Gude Literacy Project.
Strategic Objectives:
• Develop and distribute digital content annually to promote e-learning in schools;
• Develop printing and distribution workbooks to schools annually for Grades R to 9 in order to support teaching and
learning;
• Monitor and support the implementation of the National Curriculum Statements (NCS) on Reading in Grades R-9 each
year in order to improve teaching and learning;
• Develop and review the Mathematics, Science and Technology (MST) Framework to support provinces in improving
learner performance in MST subjects; and
• Deliver the Kha Ri Gude Mass Literacy programme to reduce the number of illiterate adults by 4.7 million by end of
2016/17.
2016/2017 25Programme Performance Indicators and Annual Targets for 2016/2017 to 2018/2019
Action Plan Goals on Learner Performance
Goal 1 ► Increase the number of learners in Grade 3 who, by the end of the year, have mastered the minimum language
and numeracy competencies for Grade 3.
Goal 2 ► Increase the number of learners in Grade 6 who, by the end of the year, have mastered the minimum language
and Mathematics competencies for Grade 6.
Goal 3 ► Increase the number of learners in Grade 9 who, by the end of the year, have mastered the minimum language
and Mathematics competencies for Grade 9.
Goal 4 ► Increase the number of Grade 12 learners who become eligible for a Bachelor’s programme at a university.
Goal 5 ► Increase the number of Grade 12 learners who pass Mathematics.
Goal 6 ► Increase the number of Grade 12 learners who pass Physical Science.
Goal 7 ► Improve the average performance of Grade 6 learners in languages.
Goal 8 ► Improve the average performance of Grade 6 learners in Mathematics.
Goal 9 ► Improve the average performance of Grade 8 learners in Mathematics.
Goal 10 ► Ensure that all children remain effectively enrolled in school at least up to the year in which they turn 15.
Goal 11 ► Improve the access of children to quality Early Childhood Development (ECD) below Grade 1.
Goal 12 ► Improve the grade promotion of learners through Grades 1 to 9.
Goal 13 ► Improve the access of the youth to further Education and Training (FET) beyond Grade 9.
Early Childhood Development (ECD)
• The focus is on improving the quality of the current Grade R by strengthening the provisioning of Grade R workbooks
in all schools, and making sure that Grade R incorporation in public schools reaches 100%. Secondly, there is a need to
prepare for the implementation of the two-year pre-Grade 1 programme;
• Mediation and support for implementation of Grade R resource toolkit and workbook;
• Conduct an audit to identify curriculum needs of Grade R practitioners;
• Foundation Phase and Grade R subject advisors will be capacitated to implement the NCS by using the resources
effectively;
• Development of a 3-year costed sector plan for the provision of an additional year before Grade R;
• Development of the guidelines for implementation of the National Curriculum Framework (NCF) for Children from Birth
to 4;
• Development of training guidelines to support the capacity of provinces to improve the provision of accredited training
of practitioners in registered ECD centres;
• Development of advocacy and communication materials for parents, practitioners and civil society;
• Development of integrated monitoring, support and research to support the implementation of the NCF;
• Strengthen inter-sectoral, inter-departmental and inter-provincial collaboration in improving the quality of ECD
provisioning related to training and curriculum implementation;
• Enroll Grade R practitioners in either the B.Ed-Foundation Phase or Diploma in Grade R teaching
26 ANNUAL PERFORMANCE PLANYou can also read