ANNUAL PERFORMANCE PLAN 2020 - MAY 2020 - Walter Sisulu University
←
→
Page content transcription
If your browser does not render page correctly, please read the page content below
ANNUAL PERFORMANCE PLAN 2020                 Page 0

                               ANNUAL
                               PERFORMANCE
                               PLAN 2020

                                  MAY 2020
ANNUAL PERFORMANCE PLAN 2020 Page 1
TABLE OF CONTENTS
Foreword ..................................................................................................................... 2
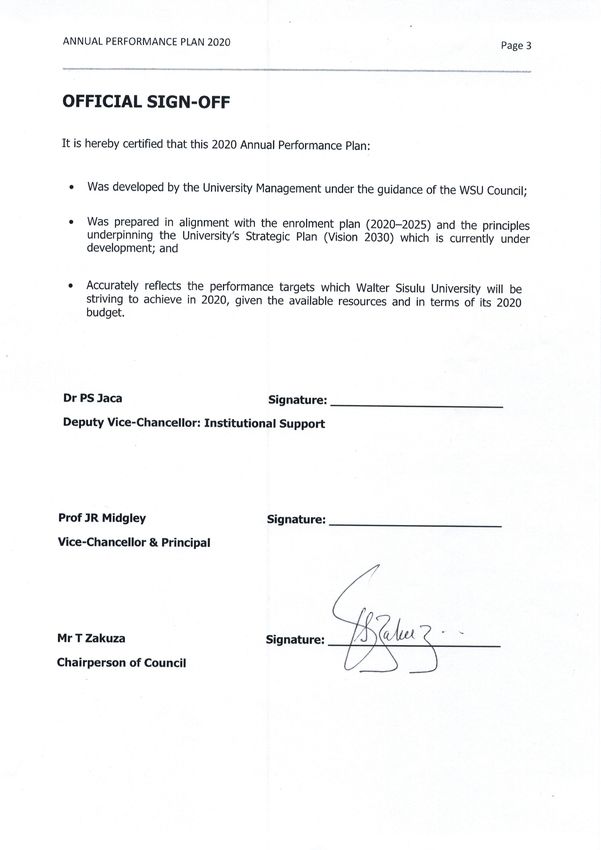
Official sign-off ............................................................................................................ 3
1. Strategic Context .................................................................................................... 4
1.1. Vision and Mission............................................................................................ 4
2. Situational Analysis ................................................................................................. 5
2.1. The Academic Project ....................................................................................... 5
2.1.1 Learning and Teaching ...................................................................................... 5
Headcount Enrolments ..................................................................................... 6
Success Rates .................................................................................................. 7
Attrition, Retention, and Throughput ................................................................. 7
2.1.2 Research and Innovation ................................................................................... 8
Research Development ..................................................................................... 9
Research Output .............................................................................................. 9
Innovation...................................................................................................... 10
2.1.3 Community Engagement ................................................................................... 12
3. Key Performance Indicators .................................................................................... 13
3.1 Access ........................................................................................................... 13
3.2 Success .......................................................................................................... 14
3.3 Efficiency ....................................................................................................... 15
3.4 Research Output ............................................................................................. 15
3.5 Innovation...................................................................................................... 16
3.6 Community Engagement ................................................................................. 16
3.7 Operational Efficiency ...................................................................................... 17
4 Budget Considerations ........................................................................................... 27
4.1 Assumptions in preparing the budget................................................................ 27
4.2 The Budget for 2020/21................................................................................... 28
5. Institutional Risk Register ....................................................................................... 31WALTER SISULU UNIVERSITY Page 2 FOREWORD This 2020 Annual Performance Plan (APP) of Walter Sisulu University (WSU) is prepared and submitted to the Department of Higher Education and Training (DHET) in accordance with the requirements as outlined in the Regulations for Reporting by Public Higher Education Institutions, as gazetted in the Government Notice, 464 of 9 June 2014. This plan is aligned to the approved enrolment plan for 2020 to 2025. Our understanding is that our reporting of performance against this APP will also take care of the reporting the major commitments made and contained in the enrolment plan. It also means that the new enrolment planning cycle 2020 to 2025 has officially commenced. This APP is developed at a time when the University is in a process of developing its Strategic Plan to guide it in performing its operations and statutory functions through to 2030. It is possible to have some alignment of this APP to the new University strategic goals, objectives and performance indicators because these are already at the advanced stage of development. Nonetheless, the APP is aligned to provisions of the draft strategic goals and aspirations, as well as national targets as contained in the NDP 2030, provincial goals as outlined in the provincial development plan 2030 and the United Nations Sustainable Development Goals. As a University located in the African continent, we continue to reinvent and position ourselves through making our programmes and research relevant and responsive to societal needs. The University seeks to produce graduates who are competitive at a global level and who will make a sustainable impact. At the same time our focus is on ensuring a sustainable and viable institution, with efficient and effective corporate governance and management systems being top priorities. The University is committed to building a stable environment and a platform that will propel the University forward. We aim to put sound administrative systems in place and in particular, to improve the infrastructure for proper living and learning conditions for our students. We also need to ensure peace and stability on all our campuses. The University finances have steadily improved over the past four years and although our financial performance is still short of ideal, our expenditure is within income levels and our cash flows have remained in positive territory. We are living within our means and will continue implementing austerity measures and financial discipline.
WALTER SISULU UNIVERSITY Page 4
1. STRATEGIC CONTEXT
The University has just completed a five-year strategic cycle (2015 to 2019) and is at
present finalising its next planning cycle, which will extend ten years, to 2030. Work on
the University’s 2030 Strategic Plan started in October 2018 and Council will consider the
Strategic Plan 2030 during 2020, after which it shall come into effect immediately.
The 2015 to 2019 Strategic Plan was in essence a recovery plan, the University having
been placed under administration in 2012, with normal operations resuming in 2015. The
University remains mindful of its recent experiences and the need to ensure that the future
is informed by the past. However, having successfully completed its recovery, WSU is now
at a juncture where it can re-imagine its institutional identity and its operational processes.
Ideally, the 2020 APP should be located within and aligned to an approved strategic vision.
However, given that the 2030 Plan is still being developed, this APP is based on provisional
Vision, Mission, Values and Strategic Goals that still need final Council approval.
1.1. VISION AND MISSION
The following Vision and Mission informs this APP:
Vision:
A value-driven, technology infused African university providing a gateway for local talent to be
globally competitive and making a sustainable impact.
Mission:
Through quality teaching, learning, research, innovation and community engagement, WSU
responds to societal needs and delivers future-ready graduates who are responsible citizens
able to address complex challenges in critical, ethical, scholarly, sustainable and entrepreneurial
ways.
Purpose Statement:
WSU’s purpose is to address societal grand challenges and change people’s lives through:
Graduating versatile, work-ready individuals;
Producing relevant, innovative and impactful research; and
Championing sustainable development and in particular, social justice.
Core Values:
Inspired by our icon tat’uWalter Sisulu and guided by our country’s foundational values, WSU
accepts the following core values:ANNUAL PERFORMANCE PLAN 2020 Page 5
Academic freedom;
Honesty and Integrity;
Quality and Excellence;
Dignity and Respect for person and property;
Humility, Selflessness and uBuntu-Botho; and
Caring service and Striving for the greater good.
2. SITUATIONAL ANALYSIS
2.1 THE ACADEMIC PROJECT
The University is acutely aware of its location and role in society and its obligations to
contribute to the country and the region in which it is located; and especially, its role in
providing access to quality educational opportunities to members of its surrounding
communities. It sees itself as operating within a developmental paradigm, ensuring that the
three core pillars of the academic project – Learning and Teaching, Research and Innovation,
and Community Engagement – are aligned and contribute towards the University being
relevant and engaged.
The University is primarily an access institution. Whether viewed from a household financial
perspective, the nature of the Institution’s academic programmes , or its strategic positioning
in the eastern part of the Eastern Cape Province, WSU is often the only tertiary educational
option for students from poor and rural households of the Province. The reality is that by far
the majority of our students come from the eastern part of the Eastern Cape and the southern
part of KwaZuluNatal, primarily from rural areas; and that the socio-economic conditions of
families in these regions are severely compromised. Despite their potential and talent, these
students often do not meet entrance requirements at other institutions. Access to, and a
qualification from WSU therefore serves as an entry point to the job market, or a springboard
towards another academic qualification – often at the very institutions for which they did not
qualify in the first instance. For this reason, the University becomes a gateway to the world
of work or to academia for many people.
WSU wishes to promote innovative research which supports its teaching and learning and
community engagement mandates and which impacts on society. So, as well as promoting
excellence in undergraduate and postgraduate studies, and research, the University will also
strive for excellence in addressing some of complex societal challenges our communities face.
In so doing we would follow and live out the vision of tat’uWalter Sisulu:
“The battle shall have been won if by the turn of the next century poverty, squalor,
degradation and disease shall remain but a distant and fading memory.”
The academic endeavour also needs to be cutting edge. Society is not static and to be relevant,
the University needs to be aware of and address environmental pressures and the increasing
use of technology in the way in which the world operates.WALTER SISULU UNIVERSITY Page 6
“Scholarship of Engagement”, as depicted in the diagram below, is used to provide a coherent
and cohesive academic project, and an alignment of the above-mentioned three core pillars.
Learning
and
Teaching
Scholarship
of
Engagement
Research
Community
and
Engagement
Innovation
The scholarship of engagement is achieved through scholarship of Teaching and Learning,
Engaged Research and Service or Experiential Learning/WIL and it is through such scholarship
that the three pillars intersect, thus enabling the University to function as an engaged African
University which addresses complex societal challenges in a scholarly manner.
The concept also provides a framework for developing areas of activity and performance
criteria within each of these key functional areas. Where any two of the three pillars intersect
some outcomes are yielded. When learning and teaching intersect with research and
innovation, scholarship of teaching and learning improves and becomes an outcome. When
research and innovation intersects with community engagement, engaged research improves
and becomes an outcome. Lastly, at the intersection of community engagement and learning
and teaching, service/experiential learning/WIL becomes an outcome.
This brief contextual overview illustrates the considerations that influenced and shaped the
sections that follow.
2.1.1 LEARNING AND TEACHING
The primary goal for learning and teaching at WSU is to promote student access while
improving student success and throughput. We understand this to be aligned to the
DHET’s broader goals in terms of the 2020 to 2025 enrolment planning cycle. The University’s
overall learning and teaching philosophy is problem-based learning, which various
departments and faculties have implemented and tested, and for which the Faculty of Health
Sciences, in particular, has become well known.ANNUAL PERFORMANCE PLAN 2020 Page 7 HEADCOUNT ENROLMENTS Learning and teaching at WSU takes place at four campuses, each with various delivery sites. The table below provides a summary of students enrolled at each campus from 2015 through to 2019. Out of the four campuses, Mthatha is the biggest in terms of student enrolments, and Queenstown the smallest. Campuses 2015 2016 2017 2018 2019 Buffalo City 6 651 6 921 7 342 7 462 8 090 Butterworth 5 514 5 965 6 359 6 633 6 827 Mthatha 12 216 13 411 14 126 14 892 15 380 Queenstown 1 612 2 284 2 690 3 153 3 342 Grand Total 25 993 28 581 30 517 32 140 33 639 The University comprises twelve faculties across all its campuses and the table below presents student enrolments in each faculty during the last five years. Faculties 2015 2016 2017 2018 2019 Buffalo City 6 651 6 921 7 342 7 462 8 090 Business Sciences 3 748 3 851 3 979 3 956 4 181 Science, Engineering & Technology 2 903 3 070 3 363 3 506 3 909 Butterworth 5 514 5 965 6 359 6 633 6 827 Education Butterworth 1 190 1 296 1 327 1 465 1 473 Engineering and Technology 1 916 2 067 2 211 2 298 2 405 Management Sciences 2 408 2 602 2 821 2 870 2 949 Mthatha 12 216 13 411 14 126 14 892 15 380 Commerce and Administration 2873 3 191 3 401 3 560 3 603 Educational Sciences 5047 5 334 5 418 5 770 6 110 Health Sciences 1294 1 478 1 610 1 587 1 693 Humanities, Soc. Sci and Law 2192 2 453 2 753 2 993 2 889 Natural Sciences 810 955 944 982 1 085 Queenstown 1 612 2 284 2 690 3 153 3 342 Economics & Info Sys Technology 1 373 1 787 1 982 2 160 2 215 Education (Queenstown) 239 497 708 993 1 127 Grand Total 25 993 28 581 30 517 32 140 33 639 In recent years WSU substantially exceeded its approved enrolment targets, primarily as a result of an increase in returning students who previously had been financially excluded but subsequently benefited through NSFAS’s payment of historic debt. Our aim in 2020 is to keep FTEN enrolments steady and to decrease the overall enrolments through natural attrition (throughput and graduation of returning students), stricter registration controls using an electronic admission and registration system and more disciplined implementation of academic exclusion rules.
WALTER SISULU UNIVERSITY                                                                     Page 8

SUCCESS RATES

The table below presents a picture of the University’s overall success rate which has dropped
from 81.1% in 2015 to 79% in 2018. Furthermore, the University’s academic enterprise
structure changed in 2015 from four faculties in 2014 to twelve faculties from 2015 onwards.

 Row Labels                                2014   2015        2016      2017       2018      2019
 Business Sciences                                 82,7%      81,4%      80,0%      80,6%     80,2%
 Commerce and Administration                       78,6%      76,5%      75,6%      76,0%     74,5%
 Economics & Info Sys Technology                   74,0%      77,3%      75,5%      72,9%     74,6%
 Education (Queenstown)                            90,0%      93,2%      91,9%      89,1%     90,9%
 Education Butterworth                             91,3%      92,1%      91,6%      93,1%     93,8%
 Educational Sciences                              83,2%      83,2%      81,1%      78,4%     84,3%
 Engineering and Technology                        73,3%      75,7%      75,7%      73,8%     68,9%
 FAC OF BUS- MAN SCIENCES & LAW           80,0%
 FACULTY OF EDUCATION                     84,8%
 FACULTY OF ENG AND SCIENCE               74,5%
 FACULTY OF HEALTH SCIENCES               88,5%
 Health Sciences                                   90,0%      87,7%      82,4%      84,9%     83,0%
 Humanities, Soc. Sci and Law                      77,9%      76,0%      73,7%      75,0%     74,9%
 Management Sciences                               80,1%      81,3%      82,4%      81,9%     80,2%
 Natural Sciences                                  73,4%      67,4%      65,5%      72,7%     65,7%
 Science, Engineering & Techno                     75,3%      74,4%      75,6%      78,0%     74,6%
 Grand Total                             81,1%    80,5%       80,3%     79,1%      79,0%     79,0%

The Faculty of Education at the Butterworth Campus is currently the best performing, in terms
of success rates, sitting at 93.1% in 2018. The Faculty of Natural Sciences has been the worst
performing faculty for the past three years in a row, although its success rate has improved
from 65.5% in 2017 to 72.7% in 2018, but again in 2019 performance went down to 65.7%.

ATTRITION, RETENTION AND THROUGHPUT

The University has improved its throughput rate of the enrolled cohort from 8% in 2015 to
14% in 2018, after the first year of study in all its programmes combined. On average, the
attrition rate from the enrolled cohort has been constant at 15% from 2015 through to 2018.

                                        Year 1     Year 2       Year 3       Year 4       Year 5
                                         2015       2016         2017         2018         2019
 2015 Baseline Cohort                    10 824      10 824      10 824        10 824       10 824
 Cumulative Graduates                       867       1 609          3 360       5 428       5 592
 % Cumulative Graduates                     8%         15%           31%         50%         52%
 Cumulative Drop-outs                         0       1 596          2 271       2 844       3 371
 % Cumulative Drop-outs                     0%         15%           21%         26%         31%
ANNUAL PERFORMANCE PLAN 2020 Page 9
Year 1 Year 2 Year 3 Year 4 Year 5
2015 2016 2017 2018 2019
Enrolments (Retained) 9957 7 619 5 193 2 552 1 861
% Enrolments (Retained) 92% 70% 48% 24% 17%
2016 Baseline Cohort 10 530 10 530 10 530 10 530
Cumulative Graduates 1 084 1 706 3 387 3 597
% Cumulative Graduates 10% 16% 32% 34%
Cumulative Drop-outs 0 1 500 2 353 2 922
% Cumulative Drop-outs 0% 14% 22% 28%
Enrolments (Retained) 9 446 7 324 4 790 4 011
% Enrolments (Retained) 90% 70% 45% 38%
2017 Baseline Cohort 10 483 10 483 10 483
Cumulative Graduates 1 244 1 966 2 060
% Cumulative Graduates 12% 19% 20%
Cumulative Drop-outs 0 1 613 2 343
% Cumulative Drop-outs 0% 15% 22%
Enrolments (Retained) 9239 6904 6080
% Enrolments (Retained) 88% 66% 58%
2018 Baseline Cohort 11 182 11 182
Cumulative Graduates 1 561 1 694
% Cumulative Graduates 14% 15%
Cumulative Drop-outs 0 1 628
% Cumulative Drop-outs 0% 15%
Enrolments (Retained) 9621 7860
% Enrolments (Retained) 86% 70%
Lastly, the University retention rate after the second year of study for the four-year period
starting from 2015 through to 2018 has been sitting at 69% on average.
Our aim in 2020 is to focus on the already identified obstacles to success: to ensure that
remedial action plans are in place for those courses with high failure rates, build on current
student assistance programmes, and to continue with our staff skills development
programmes.
2.1.2 RESEARCH AND INNOVATION
The Institutional Research and Innovation Strategy that will guide the University in its research
and innovation endeavours for the next five years is currently being developed. Flowing from
the understanding that research and innovation has not been a University strength in past
years, the main goals for 2020 are to intensify the researcher development support and
improve postgraduate supervision practices that will lead into improving research quality and
research and innovation outputs.WALTER SISULU UNIVERSITY Page 10
DEVELOPMENT OF POSTGRADUATE STUDIES
Postgraduate studies at WSU suffers in respect of two fundamental prerequisites: the shortage
of accredited postgraduate programmes on the University’s postgraduate programme
qualification mix (PQM) and a shortage of suitably qualified supervisors. In addition, a poor
policy environment has compromised academic integrity and quality.
As indicated, postgraduate outputs are affected by the restricted number of approved
programmes on the University PQM. The University has improved its number of Master’s
graduates, but the number of research Master’s graduates remains small. For example, in
2018 the University graduated 46 Master’s students, but only 11 of them completed a research
Master’s degree. The table below presents Research Master’s and Doctoral graduates from
2014 to 2018.
2014 2015 2016 2017 2018
Research Master’s graduates 10 12 8 8 11
Doctoral graduates 8 15 12 9 6
To improve our research regulatory framework, key postgraduate management policies are
being developed which will be presented to Council for approval during 2020.
In a further effort to improve fundamental conditions for postgraduate studies development,
a concerted effort will be made to improve the University’s postgraduate PQM.
In addition, the University is focusing on active postgraduate recruitment and pipeline
development programmes, which should grow postgraduate numbers and also improve
throughput success in future.
To improve students’ graduate attributes and so impacting on quality, the University
inaugurated postgraduate peer-to-peer research skills-sharing encounters between PhD and
Master’s candidates from WSU and other universities which will develop, support and
mainstream intra- and inter-institutional (including international) postgraduate research. This
programme will be developed further in 2020.
Most academics at WSU are not published scholars and accordingly are inadequately equipped
to infuse fresh research-based pedagogical ‘instincts’ into their courses and supervision
practices. As such, postgraduate students are taught and in many instances supervised by
unpublished academics, resulting in them graduating without having acquired the confidence
and critical finesse to operate in a competitive and knowledge-driven world. The First-time
Author Support Programme, launched in 2019 and which will continue in 2020, aims to
overcome this challenge.ANNUAL PERFORMANCE PLAN 2020 Page 11
RESEARCH DEVELOPMENT
Research output at WSU in terms of publication units (for accredited book chapters,
conference proceedings and journal articles) is poor, both in terms of numbers and of quality.
In 2014 accredited output amounted to 26.7 units. There has been some improvement of this
low base since then, reaching 74 units in 2017 and 63.97 units in 2018. These figures would
have been substantially better had the trend at WSU to publish in predatory journals been
arrested earlier. For two years running, a number of articles submitted for accreditation were
rejected for want of quality.
The research regulatory framework will be improved in 2020. Key research policies are
currently under review and will be presented to Council for approval during the course of the
year. In addition, the University is developing trans-, inter- and multi-disciplinary research
niche areas focusing on cutting-edge innovation-driven research that will improve research
output and quality and lead into registration of intellectual property rights.
Another important intervention, launched in 2019, is a First-time Author Support Programme
that seeks to empower academics to become published authors in quality journals, through
structured mentorship. The programme will continue in 2020, with the first tranche of tangible
results likely to be seen in 2021. This specific intervention seeks to ensure that every WSU
academic becomes a published researcher within the next few years: it will lead to an
exponential growth in the University’s research productivity profile.
Several other research productivity-focused interventions are underway, including a revamped
postdoctoral research fellowship system, programmes to grow the number of NRF-rated
researchers, new coaching initiatives aimed at empowering our researchers to become strong
research fundraisers, and enlistment of experienced adjunct researchers to add verve to our
research mentorship and output enhancement initiatives – to name just a few.
INNOVATION
The Office of Technology Transfer (OTT), funded by NIPMO through the DST, became fully
functional in 2018. The activities of the OTT include the promotion of innovation and the
registration of intellectual property rights. The table below indicates the improvement in this
regard since 2017.
2017 2018 2019
Invention Disclosures 0 2 2
Patent Applications 0 0 2
Copyright and Trademark Applications 0 1 0
Prototypes Developed 2 0 2
Innovation Projects Funded 4 4 4WALTER SISULU UNIVERSITY Page 12 Notable recent invention outcomes include a set of indigenous knowledge-based herbal tea prototypes known as Creation Nervine (with sedative effects to calm mental disorders) and Creation Arthritis (to relieve inflammation and pain associated with arthritis) developed by Prof Adebola Oyedeji’s research team with funding assistance from the Technology Innovation Agency (TIA). Other major innovations are two ground-breaking inventions of prosthetic devices to assist below-knee amputation casualties by two Medical Orthotics and Prosthetics students, Zanodumo Godlimpi and Siphosethu Mgwili; and an aneaerobic biogas prototype for alternative renewable energy use developed by Dr Frank Unuofin’s research team. Our aim in 2020 is to build on these developments and improve the above statistics even further by encouraging staff, students and community members to think innovatively and to make use of the facilities that we have on offer to register their inventions. 2.1.3 COMMUNITY ENGAGEMENT Given our pedagogical philosophical focus on Problem-based Learning, community engagement (CE) has become an integral part of Learning and Teaching at WSU, through Work Integrated Learning (WIL), Service Learning and Experiential Learning initiatives. As a result, a number of academic programmes require students to spend time in the workplace so as to integrate the theory they learn in the classroom with practice in the field. In some instances, the University also places unemployed WSU graduates for internship with the help of funding from the SETAs and NGOs. CE has also been infused into research and innovation at WSU, as can be seen from the inventions presented under the innovation section above. A number of University entities focus on CE initiatives. These include the National Pollution Laboratory, the Risk and Vulnerability Centre, Chair in Rural Development, the Institute for Advanced Tooling, the ICT for Rural Development CoLab, the e-Waste Recycling Project, the Insurance Assessors Training Programme and the Supplier Development Initiative. All the above-mentioned initiatives will continue in 2020 and our intention is to expand their reach. In addition, two new CE projects will be launched in 2020: The Agribusiness Centre and a Centre for Entrepreneurship Rapid Incubator.
ANNUAL PERFORMANCE PLAN 2020                                                                                     Page 13

3. KEY PERFORMANCE INDICATORS

3.1. ACCESS

                        Calendar Year             2018                      2019             2020
Key Performance Indicator               T arget      Actual       T arget      Provisional T arget          Strategies/Activities/Projects to achieve the set target
A. Access (Enrolments)
Student Headcount T otals                  29 100        32 123      29 715         33 600      30 269 Implement exclusion policy and enrolment only on accredited programmes.
Foundation First-Time Entering               1 500        1 309        1 700         2 203          1 675 Enrol only in approved Foundation programmes
First-Time Entering Undergraduate            7 300        7 056        7 400         7 176          7 100 Enforce quota restrictions, monitor enrolment and daily reporting.
Headcount Total UG                          27 500       29 788       28 000        30 887      27 819 Enforce all of the above strategies
Headcount Total PG                           1 600        2 335        1 715         2 713          2 450 Targeted marketing to pipeline UG students to build appetite for PG studies.
Enrolments by Major Fields of Study        29 100        32 123      29 715         33 600      30 269 Quota transfer only allowed across faculties/departments in similar CESM groups
SET                                          8 602        8 515        9 354         9 389          8 778
BUS/MAN                                      8 864       10 062        8 189        10 235          9 383
EDUCATION                                    6 217        5 679        6 366         5 844          5 146
OTHER HUM                                    5 417        7 866        5 806         8 132          6 962

The University set its headcount enrolment target for 2020 at around 30,000, which is 3,000 lower than the 2019 actual enrolments, because
of a stricter enforcement of exclusion rules.

In order to maintain the planned shape, a university has to monitor its enrolment and manage this process carefully, while ensuring that it
meets its set quotas and not over-enrol at the same time. WSU will further ensure that we maintain our academic shape and where transfer
of quotas between faculties and/or academic departments is inevitable, this will be done within the same parameters that were initially set in
our enrolment plan.
WALTER SISULU UNIVERSITY Page 14
3.2. SUCCESS
Calendar Year 2018 2019 2020
Key Performance Indicator T arget Actual T arget Provisional T arget Strategies/Activities/Projects to achieve the set target
B. Success
Overall Degree Credit Success 75% 79,0% 75,0% Not available 80,0% Initiatives to improve student success include:
Degree Credit Success UG 75% 80,1% 75,0% Not Available 81,0% - FYE project, Extended degree programmes,Tutorship and PAL programmes
Degree Credit Success PG 75% 61,6% 75,0% Not Available 65,0% - Writing centres to improve student writing skills, and Academic support
Success Rate by Fields of Study
SET 74% 76,7% 73,8% Not Available 77,5%
BUS/MAN 71% 76,3% 71,3% Not Available 76,9%
EDUCATION 84% 82,7% 84,6% Not Available 85,9%
OTHER HUM 73% 79,3% 73,3% Not Available 80,4%
T otal Graduates 6 605 7 130 6 928 Not Available 7 068 Early warning system and Students at Risk are just some projects to improve student throughput
Graduates UG 6 210 6 371 6 510 Not Available 6 491 and ensure that intervention is made early enough before students drop-out of their programmes.
Graduates PG 396 759 417 Not Available 577
Undergraduate Output by Scarce Skills
Engineering 234 369 255 Not Available 266
Life and Physical Sciences 124 98 144 Not Available 148
Animal Sciences 0 0 0 Not Available 0
Human Health 238 262 259 Not Available 260
Teacher Education 959 1 454 975 Not Available 1 096
The University views success from a number of dimensions. It is important to highlight the progression of students in terms of their academic
journey, retaining students until they complete their qualifications within acceptable time, the completion of the qualifications, and the time
to completion. Success targets for the 2020 academic year have been set as follows: overall success rate at 80%; and undergraduate
programmes success rate at 81%. The support that the University receives from DHET through various grants enables the University to
implement various projects and initiatives to ensure that the students it attracts develop the required skills to progress academically and
graduate within acceptable time limits.ANNUAL PERFORMANCE PLAN 2020 Page 15
3.3. EFFICIENCY
Calendar Year 2018 2019 2020
Key Performance Indicator T arget Actual T arget Provisional T arget Strategies/Activities/Projects to achieve the set target
C. Efficiency
Instructional/Research Professional Staff - 878 - 888 - Discretionary grant funding set aside to enrol staff for teaching qualifications:
Headcount of Permanent Instr./Res. Staff 636 620 650 623 589 - Wits and Rhodes programmes for academic staff to improve teaching qualifications
FTE for Instr./Res. Staff 760 816 762 784 750 - nGap programme supported through earmarked grant from DHET.
% Staff with Doctoral Degrees 15% 12,6% 16,9% 15,3% 14%
% Staff with Masters Degrees 36% 38,2% 36,2% 38,0% 40%
Number of nGap Staff 4 11 4 16 4
FTE Ratio of Students to Staff 31,0 34,1 31,5 35,2 33,8
The University views efficiency in terms of the FTE ratios of students to staff, the quality of teaching and learning within the Institution, our
throughput and success rates, the calibre of graduates, and the quantity and quality of our research outputs. The University therefore now
controls FTEN enrolments in terms of realistic enrolment targets, and invests effort in different programmes to ensure that we have qualified
academics with the requisite skills to produce the desired efficiencies. To improve the number of staff with Master’s qualification the University
does not appoint any individual with less than a Master’s degree, and it has also opened up fair opportunities for all academic staff with lesser
qualification to study further.
3.4. RESEARCH OUTPUT
Calendar Year 2018 2019 2020
Key Performance Indicator Target Actual T arget Provisional T arget Strategies/Activities/Projects to achieve the set target
D. Research Output
Publication Units 65 64 70 Not Available 90 First-time Author Support Programme
New research funding/incentive framework, and stipulation and monitoring of minimum publication
Publication Units per Permanent Instr./Res. Staff 0,10 0,10 0,10 Not Available 0,15
output per staff, as part of new institutional research strategy
Masters Graduates (Research only) 20 8 26 Not Available 31 Active PG recruitment and pipeline development programme
Doctoral Graduates 10 3 14 Not Available 12 PG Peer-to-Peer research skills-sharing encountersWALTER SISULU UNIVERSITY Page 16
WSU has reverted to a ‘back to basics’ approach to improving research productivity. The University is starting afresh by building its foundation
in research and innovation, through intensifying researcher development support and improving postgraduate supervision practices. Secondly,
the University will develop its research and innovation niche areas. Our aim is to improve research productivity incrementally over time,
building upon the work that has been ongoing in recent years and the implementation of the strategies indicated in the table above.
3.5. INNOVATION
The promotion of innovation and the registration of intellectual property rights form part of the Office of Technology Transfer (OTT)’s functions.
The aim for 2020 is to build on and take further the work that started in 2017 and continued through to 2019 by encouraging staff, students
and community members to think innovatively and to make use of the facilities that we have on offer to register their inventions.
2017 2018 2019 2020
Description
Actual Actual Actual Target
Invention Disclosures 0 2 2 3
Patent Applications 0 0 2 3
Copyright and Trademark Applications 0 1 0 2
Prototypes Developed 2 0 2 3
Innovation Projects Funded 4 4 4 5
3.6. COMMUNITY ENGAGEMENT
Community engagement at WSU seeks to address community and country needs, especially in the rural communities it serves. As such, the
establishment and maintenance of strong and mutually benefitting relationships with communities are essential. The ultimate goal of
Community Engagement at WSU is development. The engagement activities and projects falling under community engagement are classified
according to four broad categories: Engagement through Outreach and Community Service; Engagement through Professional/Discipline-
based Service Provision; Engagement through Teaching and Learning; and Engagement through Research and Scholarship. WSU is hosting
and managing National Water Pollution Laboratory – testing water quality along SA Coastal Waters (KZN, EC, WC and NC) and islands in theANNUAL PERFORMANCE PLAN 2020 Page 17
Southern Ocean for safety for consumption, fishing and swimming. WSU is also a centre for implementing the International Society of
Hypertension project where it measures blood pressure, weight and height in the communities; the purpose is to give health advice and refer
people who have hypertension and are not on treatment to hospitals for attention.
Key Objective High level Indicators 2020 Strategies/projects/activities to achieve output
Target
Ensure that 50% of all undergraduate Percentage of infusion of 50% Faculty-based workshops on the infusion of Community Engagement will
programmes contain a credit-bearing community engagement be held. The community engagement committees of departments and
community engagement component. faculties will monitor and oversee the infusion of community engagement
into the curriculum.
Ensure that 100% of students are timeously Percentage of students timeously 90% Partnerships with communities, public and private sectors will be
placed for service learning and/or work placed for service learning and/or strengthened. Students will be compelled to attend all student
integrated learning in all relevant work integrated learning in all preparedness programmes. The community engagement committees of
programmes. relevant programmes departments and faculties will monitor and oversee WIL and Service
Learning programmes.
Increase the number of research projects A number of research projects that 40 The community engagement and research committees of departments
that address the prioritized community address the prioritized community and faculties will monitor and oversee the work of the departments in the
needs to at least one per department. needs. development of the research projects with the communities (e.g. industry
partners).
All academic programmes infuse rural Number of academic programmes 30% Faculty-based workshops on the infusion of rural development will be
development in their content. with infused rural development held. The rural development committees will monitor and oversee the
infusion of the rural development into the curriculum.
Full implementation of all MoU’s to reinforce Percentage implementation of 80% Intensify the roll-out of projects flowing from the current MoU’s/MoA’s.
partnership agreements at all times. MoU’s with key partners. The community engagement committee will review the MoU’s and assist
the departments and faculties in identifying new projects and partners.ANNUAL PERFORMANCE PLAN 2020 Page 18
3.7. OPERATIONAL EFFICIENCY
Management of operations at WSU has for some time been sub-optimal. Following a period
of imposed external administration, the University is operationally back on track, with a
strong emphasis on reducing leakages caused by inefficient operations. To date, the focus
has been on the following operational areas:
Governance: Governance at WSU is generally good and Council and other
governance structures like the Institutional Forum function effectively and
efficiently. An outstanding issue for completion in 2020 is the finalization of our
Institutional Rules.
External audit: For a number of years the University has consistently had qualified
audit opinions and in 2018 we had a disclaimed opinion. The target is a clean audit
for 2020, but given the declared national Disaster and consequent huge disruptions
to university operations this target may be difficult to achieve; and to submit the
documents to the DHET within the deadlines.
Academic Administration: Poor administration, especially around admissions and
registrations, is a major cause of student protest action and unfortunately also
opens opportunities for untoward practices. The University has a definitive
management policy direction to move all academic administrative operations from
manual processes to online systems.
o The migration of admission and registration processes was implemented in
2019 for 2020, but resulted in many teething problems which need to be
ironed out before 2021 admission and registration processes commence.
o Enrolment practices have improved over the past few years. First-year
enrolments are generally well managed, but controls over returning student
numbers are inadequate. Students who were previously excluded financially
were able to return when NSFAS covered their historic debt, causing a bulge
in returnees, but these students are beginning to graduate and we expect
the pressure from this quarter to slow down in future. Our focus in 2020
will be to implement our exclusion rules more strictly, in the hope that this
not only frees up space for better performing students to be admitted, but
will also encourage pipeline students to take their studies more seriously.
o Online progression and exclusion processes will be implemented in 2020.
o Online submission of examination papers by academic staff is being
developed.
Human Resources: Operations within this major expenditure area are carefully
monitored, although a risk of budget overruns remains real. The divisional
management model in terms of which the University’s Institutional Office and its
four Campuses operate is naturally more labour intensive than structures found at
unitary institutions, which forces human resource operations to be on the high side
of the expenditure matrix.
o Recent expenditure has been close to the 58%–62% norm and the
University continues of use standard this as its expenditure target.ANNUAL PERFORMANCE PLAN 2020 Page 19
o The University has streamlined its organizational structure, although there
is room for further efficiencies once academic programmes have been
assessed for quality, uptake (need) and relevance.
o Applications to fill existing positions and/or for new posts are carefully
scrutinized before permission is granted for them to be advertised.
o To improve academic leadership and academic qualification mix, all
professorial vacancies have been and are being advertised.
o We have a concerted staff qualification improvement programme in place
and academic staff are being supported to upgrade their qualifications with
our aim being to improve the number of doctoral qualifications.
Student Issues: The focus in 2020 will be on improving student support services.
o Personal safety and security
o Health and wellbeing, especially improved clinic and mental health services
o Student development programmes
o Improved living conditions
Property Management: Proper living conditions have been a major bone of
contention for many years, and possibly also the single-most source of conflict and
protest action. Large-scale inefficiencies and opportunities unacceptable practices
and loss of income have been found in this area. The University has accordingly
reconstructed the business management of its property operations and
consolidated them in a single business entity.
o The newly formed Estates Division will manage all aspects around student
residences, staff accommodation, leased properties and revenue generation
from WSU infrastructure stock. The Division will be staffed and fully
operational by the end of 2020.
o A system of online residence allocation has been in place for a few years,
but it has not been functional, leading to frustration and student protest
action. The system will be re-imagined in 2020 for smoother implementation
in 2021.
o The management of private student accommodation is a mess. An
appropriate lease management system will be developed in 2020 for
implementation in 2021. All 2021 leases will be in place by December 2020.
o The management of staff accommodation has been left unmonitored.
Allocations appear to be made ad hoc, records are incomplete, unauthorized
sub-letting exists and fringe benefit tax issues have arisen. The Estates
Division will regularize all these aspects in 2020.
Financial : Efficiencies will be effected in the following areas:
o Allocation of the limited resources of the University to support the
achievement of the University’s strategic objectives so as to allow
expenditure to be in line with approved budget;
o Improved balance sheet: Dec 2019 vs Dec 2020:
Increase in reserves:
Reduction in bad debt;WALTER SISULU UNIVERSITY Page 20
o Cash flow managed without using overdraft facilities;
o Functional separate management systems for council-controlled and
residence finances;
o Improve the administration of financial aid unit and recovery of amounts
due from funders;
o Implement reporting tools and dashboards to assess and monitor financial
performance;
o Improve financial policy environment and address outstanding audit
matters;
o Limit the unsustainable increase in student debtors through consistent
application of the minimum initial payments and special cases registration;
o Online procurement processes implemented and automation of all other
business processes and effective use of ERP system;
o Functional asset management system; and
o Improved third-stream income.
Infrastructure Management: Efficiencies will be effected in the following areas:
o Improved management of infrastructure grants, ensuring that allocated
funds have been spent and no existing grant with unspent money is older
than 5 years;
o Institutional and Campus infrastructure development master plans
developed;
o Iphulo refurbishment complete;
o KTC and KGB refurbishment 50% completed;
o Potsdam residence complex refurbished; and
o Butterworth water supply project completed.
ICT: The following projects will be completed:
o Ubiquitous Wifi on all campuses;
o Migration from Groupwise to Office 365 completed;
o ITS functional throughout the University’s operations;
Facilities: Improved occupational health and safety on all campuses.ANNUAL PERFORMANCE PLAN 2020 Page 21
Description 2018 Actuals 2019 Actuals 2020 Target
Governance and Academic
Administration
- Institutional Rules No institutional rules in place. No institutional rules in place. Institutional rules in place.
- Online Applications for Number of online applications: 0 Number of online applications: 10% Number of online applications: 100%
Admission.
- Online Programme Number of online registrations: Number of online registrations: Number of online registrations: 100%
Registrations 70.1% 83.5%
Human Resources
- Leave Management Manual leave system. Online leave management Analyze and report leave across the
implemented. University.
- Single and harmonized Personnel structure not Personnel structure not harmonized. Implement a harmonized Personnel
University structure. harmonized. structure.
- Personnel costs 66% 64% Maintain expenditure within 62%
Management norm.
- Improve academic staff Master’s = 36%; PhD’s = 16% Master’s = 36%; PhD’s = 17% Increase Master’s to 39%; PhD’s to
qualifications (Master’s and 19%
PhD’s)
- Ensure the ration of 60:40 60:40 60:40
academic staff to support
staff costs is at 60:40
Property and Infrastructure Management
- Property Management Manual Residence allocation Piloted Residence allocation system Enhance Residence allocation system
(RAS) (RAS) to address system glitches.
Establish Estates Division to manage
WSU property.
Develop Lease Management System
Conveyancing of WSU Properties –
80%WALTER SISULU UNIVERSITY Page 22
Description 2018 Actuals 2019 Actuals 2020 Target
- Infrastructure Management Potsdam residence complex: Iphulo residence: 75% completed Student Residences
* Refurbishments 50% completed Zamukulungisa 200 and 400 seater Old Potsdam Student residence
Butterworth water supply auditoriums (R64m): 100% complex (R22m): 70% completed
project: 0% completed Completed Iphulo Student Residence (R54m):
Iphulo residence: 0% completed 100% completed
KTC and KGB residence: 0% Zamukulungisa Student Residence
completed (R100m) – 20% Completed
Ibika Student Residence
Refurbishment (R20m) – 50%
Maintenance and new
Infrastructure Provision
Mthatha NMD Sewer Reticulation
Systems & Water Reticulation
Systems Refurbishment (R10m):
100% Complete
Mthatha NMD Roads Infrastructure
Refurbishment (R11m): 100%
Complete
Butterworth, Ibika Campus Sewer
Reticulation Systems (R1.5m) –
100% Complete
Butterworth, Ibika Campus Water
supply Project (R10m) – 100%
Completed
Butterworth Disabled Access-Elec
Engineering Blg (R700k): 100%
CompleteANNUAL PERFORMANCE PLAN 2020 Page 23
Description 2018 Actuals 2019 Actuals 2020 Target
Potsdam Solar Farm (R10m): 90%
Complete
WSU Security Upgrade (R1.8m):
100% Complete
Butterworth Res Maintenance and
Fencing (R5m): 100% Complete
Refurbishment of East Teaching
Malls (R8m): 70% Complete
Research, Learning and Teaching
Spaces:
Upgrade and expansion of the
DWESA Research Station (R10m):
100% Complete
Refurbishment and expansion of the
National Pollutions Lab (R5m): 100%
Complete
Upgrade of Natural Sciences
Laboratories at NMD (R20m): 90%
Complete
New Ibika Education Lecture venues
(R80m): 20% Complete
Mthatha Faculty consolidation (R 137
184 700.00): 30% Complete
Mthatha Electronic
Resources/Computer Lab (R12m):
90%
Butterworth Well founded Labs
(R4m): 100%WALTER SISULU UNIVERSITY Page 24
Description 2018 Actuals 2019 Actuals 2020 Target
Entrepreneurial Hubs:
The Centre for Entrepreneurship
Rapid Incubator (WSU- CfERI) in
conjunction with SEDA (R1.5m):
100%
The Small Enterprise Development
center for Agricultural Businesses
Projects (R3.5m): 100%
Information and
Communication Technology
(ICT)
- Ubiquitous WiFi on all WiFi installation on Hotspot areas WiFi installation on Common areas WiFi presence 100% on all campuses
campuses
- Offsite Data backup storage The process of building the The process of building the offsite A fully functional offsite backup data
(As the strategy for disaster offsite data backup storage backup storage fully completed. center.
recovery plan) stared
- Oracle Database Cloud The implementation of the cloud- The implementation and A fully functional cloud-based data
based data backup solution based data backup solution deployment of the cloud-based data backup solution for ITS
(As the strategy for disaster backup solution was 100%
recovery plan) completed (IST is data backup is
hosted on this cloud-based facility)
- Migration email system to Groupwise email system Groupwise email system Email system fully migrated to Office
Office 365 365
- The Indoor WIFI
The Indoor WIFI installation
installation (Student 50% of indoor WIFI must be
(Student residents and Classrooms
residents and Classrooms completed.
and other WSU facilities)
and other WSU facilities)ANNUAL PERFORMANCE PLAN 2020 Page 25
Description 2018 Actuals 2019 Actuals 2020 Target
- WSU website revamp A fully completed WSU revamped
The process of revamping the website.
- Replacement of old university website was initiated
Network core switches (in Replacement of all old Network Core
order to reduce network Replacement of old Network core switches.
downtimes) switches
Technology infusion in T&L Technology: WiseUp based on Technology: Blackboard Mobile App Technology: Blackboard Analytics
Blackboard platform and Bb Collaborate are fully functional Usage:
Usage: Usage: Active Courses: 4 792 (Actual) –
Active Courses: 967 Active Courses: 1 779 4684 (target) target exceeded
Active Instructors: 1 139 Active Instructors: 1 122 because of new courses introduced
in 2020 academic year.
Active Instructors: 1 438
(actual) – target (4 684)
Number of e-resources available e-books: 9 000+ e-books: 15 000 e-books: 15 000 + Free E-Books/ E
as unlimited access to staff and e-journals: 122 000+ e-journals/e-articles: 190 000 textbooks (Covid19 Publisher’s treat)
students through the library e-research tools: Workshop for staff e-research tools: Open access granted e-journals/ e-articles: 200 000
website /HelpDesk/ Digital and PG students on ‘Turn-it-in’ and to staff and PG students on ‘Turn-it-in’.: e-research tools: 15 platforms
Library. ‘Endnote’: 10 platforms 15 platforms
Finance
Build reserves R44m TBA Achieve a surplus of 3% to 5% on the
operating budget annually
Automation and utilisation Key systems not optimally used Key systems not optimally used and Implement and optimize the following
of ERP and processes are manual processes are manual modules:
Requisitioning
Financial aid
InvoicingWALTER SISULU UNIVERSITY Page 26
Description 2018 Actuals 2019 Actuals 2020 Target
Improve the liquidity of the Overdraft facility used Overdraft facility not used in 2019 No use of overdraft facility
University Working capital reserves of R200m Increase working capital reserves by
R200m
Increasing throughput - Throughput rate 15% Increase throughput and post graduate
output by 5% pa
Improve third stream R30m R20m Increase third stream income by R10m
income
Tuition fees are set at levels Tuition fees increased by CPI Tuition fees increased by CPI Evaluate viability of programmes and
that financially viable propose adjustments to fees to a break-
even position for all programmes
Residences achieve a Loss position on residences Loss position on residences Break even position by 2022
break-even position at a
minimum
Limit the unsustainable Outstanding debt increased by Outstanding debt increased by R64m in Reduction of outstanding debt by +/-5% pa
increase in student debtors R203m in 2019 2019
Improve and optimize the - 1121 out of 23 280 students were Students incorrectly approved for NSFAS
NSFAS claims incorrectly approved for funding by FAB funding to decrease by 10%
Achieve payroll spending Payroll costs 62.0% of recurring Payroll costs 62.8% of recurring income Payroll costs within 58-62% of recurring
ratios income incomeANNUAL PERFORMANCE PLAN 2020 Page 27
4. BUDGET CONSIDERATIONS
The South African economy has performed poorly and the fiscal environment is therefore
constrained. For historical and legacy reasons, the University operates from a very low
financial base. To achieve financial viability, all departments have been requested to make
a concerted effort to cut costs, improve cost efficiencies and exercise financial discipline.
As with the prior year, a break-even budget has been prepared for 2020, but it is becoming
increasingly difficult to maintain expenditure within revenue. Funding from government
and tuition fees have been limited to inflation, while compensation and other costs have
increased at a rate exceeding inflation.
In addition to living within our means in 2020, or aim is to ensure a positive cash flow in
2020 and to build suitable reserve to cover expenditure for the first three months in 2021.
A further target is to control the escalation of student debt and to improve our debt
collection as compared to 2019.
4.1 ASSUMPTIONS IN PREPARING THE BUDGET
The Finance Division has modelled the likely scenario with regard to key revenue and cost
variables as follows:
a. Subsidy income (the block grant allocation, based on 2018 data incorporating
teaching input units, teaching output units, research output units representing 56%
of total income, is expected to increase by only 5% on 2019 actual subsidy earned;
b. Tuition Fee income, representing 43% of total income, is estimated to remain at
the same level as 2019. Although tuition fees are expected to increase by 5.4%
(CPI) on 2019, this will be offset by the decrease of 4.3% in enrolments;
c. Other revenues, representing 1% of total income, are estimated to increase by
46%. The significant increase is due to the very low base from 2019;
d. Staffing costs, representing 64% of total costs, are estimated to increase by 6.4%
(based on the 3-year deals negotiated with the union); and
e. Other specific operational costs, such as utilities and contracted services have been
estimated to increase by between 5 and 6% (depending on the cost type).
Applying the above, and in order to achieve a break-even budget, require that other costs,
such as general expenses and travel, need to remain at the same level as 2019.
The key assumptions in preparing this budget are:
a. CPI of 5.4%;
b. Agreed salary increase for 2020 (6.4%);
c. Tuition fee increase of 5.4% (CPI); and
d. Residence fees – overall fee increase of 7.4%.WALTER SISULU UNIVERSITY Page 28
4.2 THE BUDGET
The following table reflects the WSU budget for the 2020 financial year, split between
council-controlled academic and administrative operations and student housing
management operations.
Council Controlled Residences Total
R'000 R'000 R'000
Government grants - Council Controlled 997 918 - 997 918
Residence fees - 660 287 660 287
Student Fees 764 020 - 764 020
Sundry income 25 000 - 25 000
Total revenue 1 786 938 660 287 2 447 225
Bad debts 107 264 6 681 113 945
Computer expenses 48 538 - 48 538
Hire: Leased residences - 527 896 527 896
Employee expense - Academic 686 208 - 686 208
Employee expense - wages 451 879 33 382 485 261
Depreciation 33 920 - 33 920
General expenses 224 067 497 224 564
Research and innovation 17 488 - 17 488
Contracted services 115 224 26 083 141 308
Municipal charges 29 221 46 660 75 880
Capital expenditure 54 823 - 54 823
Repairs and maintenance 53 131 7 048 60 179
Travel - local 30 452 - 30 452
Total expenditure 1 852 215 648 246 2 500 461
Surplus including capital expenditure (65 277) 12 041 (53 236)
Add back capital expenditure 54 823 - 54 823
Surplus excluding capital expenditure (10 454) 12 041 1 587ANNUAL PERFORMANCE PLAN 2020 Page 29
The table below presents WSU’s overall budget for 2020, indicating the percentage
variance between 2019 forecast and 2020 budget.
2019 Budget 2019 Forecast Variance 2020 Budget Variance
('19 Budg - R'000 ('19 Fore to
R'000 R'000 '19 Fore) '20 Budg)
R'000 R'000
Government grants - Council Controlled 954 822 954 822 0% 997 918 5%
Residence fees 452 355 613 822 36% 660 287 8%
Student Fees 735 158 765 486 4% 764 020 0%
Sundry income 20 966 17 145 (0) 25 000 46%
Total revenue 2 163 301 2 351 275 9% 2 447 225 4%
Bad debts 16 890 123 560 632% 113 945 -8%
Computer expenses 45 265 45 576 1% 48 538 6%
Hire: Leased residences 354 529 493 839 39% 527 896 7%
Employee expense - Academic 646 616 613 595 -5% 686 208 12%
Employee expense - wages 457 264 433 913 -5% 485 261 12%
Depreciation 24 000 32 000 33% 33 920 6%
General expenses 248 230 224 564 -10% 224 564 0%
Research and innovation - - 0% 17 488 0%
Contracted services 126 575 132 808 5% 141 308 6%
Municipal charges 67 156 71 993 7% 75 880 5%
Capital expenditure 79 100 51 720 -35% 54 823 6%
Repairs and maintenance 60 500 56 559 (0) 60 179 6%
Travel - local 27 271 30 452 0 30 452 -
Total expenditure 2 153 395 2 310 579 7% 2 500 461 8%
Surplus including capital expenditure 9 906 40 696 (53 236) -231%
Add back capital expenditure 79 100 51 720 54 823 6%
Surplus excluding capital expenditure 89 006 92 416 1 587 -98%You can also read