Appen Limited
2021 Half Year Results Presentation
26th August 2021
←
→
Page content transcription
If your browser does not render page correctly, please read the page content below

Appen Limited 2021 Half Year Results Presentation 26th August 2021

Important information

    The forward-looking statements included in these materials involve subjective judgement and analysis and are subject to significant uncertainties,
    risks and contingencies, many of which are outside the control of, and are unknown to, Appen Limited. In particular, they speak only as of the date
    of these materials, they are based on particular events, conditions or circumstances stated in the materials, they assume the success of Appen
    Limited’s business strategies, and they are subject to significant regulatory, business, competitive, currency and economic uncertainties and risks.

    Appen Limited disclaims any obligation or undertaking to disseminate any updates or revisions to any forward-looking statements in these
    materials to reflect any change in expectations in relation to any forward-looking statements or any change in events, conditions or circumstances
    on which any such statement is based. You should monitor any announcements by the company lodged with the ASX. Nothing in these materials
    shall under any circumstances create an implication that there has been no change in the affairs of Appen Limited since the date of these
    materials. Organisation structure is subject to change.

    No representation, warranty or assurance (express or implied) is given or made in relation to any forward-looking statement by any person
    (including Appen Limited). In particular, no representation, warranty or assurance (express or implied) is given in relation to any underlying
    assumption or that any forward-looking statement will be achieved. Actual future events and conditions may vary materially from the forward-
    looking statements and the assumptions on which the forward-looking statements are based. Given these uncertainties, readers are cautioned to
    not place undue reliance on such forward-looking statements. To the maximum extent permitted by law, Appen disclaims all liability and
    responsibility (including without limitation, any liability arising from fault or negligence) for any direct or indirect loss or damage which may arise or
    be suffered through use or reliance on anything contained in, or omitted from, this presentation.

    All amounts are in US$ unless stated otherwise.

    Appen Limited ACN 138 878 298 - 9 Help Street, Chatswood, NSW 2067, Australia

2
Market expansion
The data annotation market is expected Appen's core market Adjacent AI markets
to grow from $2.5B to more than $5B by 2021 2024E
2024, ~25% CAGR1
Appen revenue CAGR of 38% 1H16-1H21
New Markets revenue growth of 31.5%
1H21 vs 1H20, driven by new customer ~$110B
segments and AI use cases $5B opportunity in a
~$2.5B
broader AI
Global Product revenue up 15.2% as
market2
Global customers use our products to
enable their new AI investments
AI training
10.8% of 1H21 revenue invested in data market
product development to tap the
expanding market and new opportunities
1. Market research 2. IDC Worldwide Artificial Intelligence Spending Guide 2020
3
Accelerating our transformation

Appen is transforming                          FROM                    TO
into an AI powered
provider of AI data     Data type          Language data             AI data
and solutions
                        Delivery model       Service led           Product led

Delivering greater
capabilities,           Revenue             Project based           Committed

broader application,                                              All industries &
                        Customers           Major US tech
better unit economics                                              geographies

                        Org structure    Functional alignment   Customer alignment

4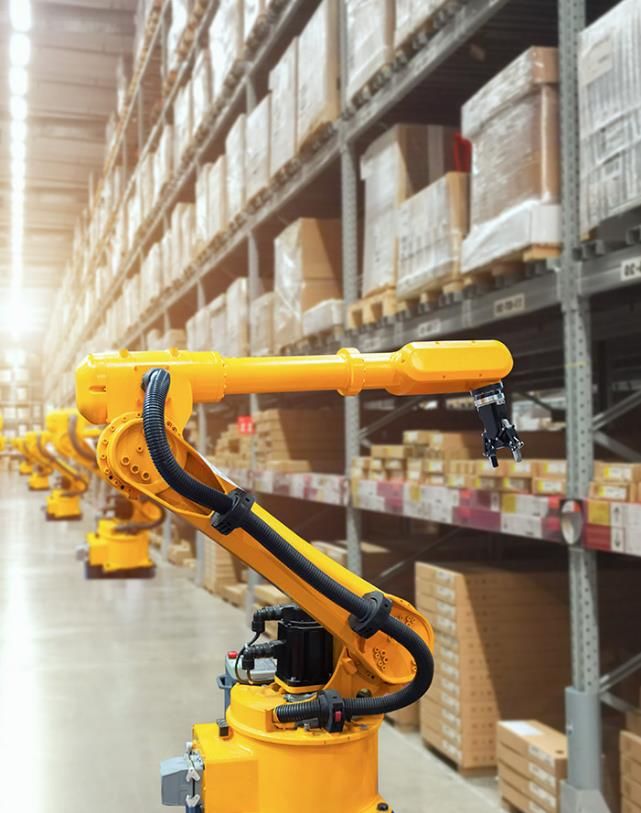
1H21 result overview
As expected, 1H21 growth rate impacted by the skew
US$ 1H21 vs 1H20 in project delivery to 2H21 and the strong pcp result
Global Services revenue lower due to Global
Group revenue $196.6M (2.0%)
customers’ allocation of resources to new and non-
advertising related projects in 1H21
Global Services1 $148.8M (9.2%)
New Markets revenue up 31.5% due to product led
New Markets2 $47.8M 31.5% growth and growing customer base, now 24% of
total revenue up from 18% in 1H20
Underlying EBITDA3 $27.7M (14.3%)
Underlying EBITDA and margins impacted by the
fully annualised cost base for FY20 growth
Underlying EBITDA margin 14.1% vs 16.1%
investments and 1H21 investment in New Markets
Dividend per share (A$) 4.5c Flat Strong balance sheet - $66M in cash and no debt
as at 30 June 2021
Interim dividend A$ 4.5 cents per share, flat on 1H20
1. Revenue from major US technology customers (Global customers) through their platforms
2. Revenue from Global Product (Global customers using the Appen platform and tools) and Enterprise,
China and Government customers
3. Underlying EBITDA excludes restructure costs, transaction costs and acquisition-related share-based
payment expenses, and for 1H20, the earnout adjustment relating to the Figure Eight acquisition
5
Key focus
areas

    Global leader in data
    annotation and collection for AI

    Grow in attractive new markets and geographies and
    leverage our capabilities across a broad customer base

    Build scalable products and processes to deliver
    high-quality training data, faster, with improved unit economics

6
1. Strong core Global leader in data annotation and collection for AI Track record of high growth - 38% revenue CAGR 1H16-1H21 Industry-leading AI-enabled annotation technology Flexible, diverse crowd of 1m+ annotators in 170+ countries with expertise in 235 languages Unrivalled customer relationships including the world’s largest technology, social media and e-commerce companies in the US and China Continued growth in demand for high-quality training data fueled by investment and growth in AI/ML applications 7

Supporting Global customers’ evolving needs
Global Services Global Product
Global customer revenue through customers’ platforms Global customer revenue through Appen’s platform and tools
US$M US$M
163.9
148.8
26
22
32%1 19
Revenue 13
EBITDA
42.3 7
34.4
1H20 1H21 1H19 2H19 1H20 2H20 1H21
Global Services revenue of $148.8M, down 9.2%, Global Product revenue of $22.3M, up 15.2%
due to Global customers’ prioritisation of new on 1H20, 32% CAGR 1H19-1H21
products as they diversify beyond ad-related Growth driven by new product capabilities
products and respond to data privacy changes and ability to serve Global customers’
EBITDA down 18.6% to $34.4M evolving needs
Global Product now 13% of total Global
customer spend, up from 11%
1. Annualised CAGR from 1H19 to 1H21
8
Project diversity supports revenue growth
Global Revenue1 Global Revenue1
Projects related to advertising2 All other projects
US$M
140
Non-ad related revenue is now 75% of total
revenue from Global customers, reflecting their
120 accelerated investment in new AI products and
applications
100
In 1H21 non-ad projects largely returned from
the 4Q20 slowdown, and the revenue growth
80 trend is expected to continue as Global
customers diversify
60
Ad-related projects returned at a slower pace
in 1H21 and revenue was impacted by
40 customers’ reprioritisation of projects and
resources, and data privacy changes
20
Ad related projects are expected to grow in
2H21, but at a lower rate than non-ad projects
0
1H18 1H19 1H20 1H21 1H18 1H19 1H20 1H21
1. Total revenue from Global customers (Global Services plus Global Product)
2. Revenue from projects that directly support the optimisation of digital advertising. Data is based on internal classification
9
Growth in new projects due to expertise, capabilities
1H21 Global 1H21 Global
revenue (US$M) project count
Projects that Working with Global customers on 100 new
20.3
commenced in projects since Jan 2021, reflecting our expertise
2021 and evolving capabilities
100
New projects have lower revenue per project
early in their lifecycle, but are a strong
foundation for future revenue growth
97 of the new projects are not ad-related,
Projects that
commenced prior
reflecting Global customers’ product
150.8
to 2021 diversification
185 Potential to support Global customers on new
ad-related projects as they develop solutions
that respond to data privacy changes
10New projects with Global customers
AR/VR Capture of household actions to
help AI understand hand motions
e.g., toy assembly
AR/VR Data collection of categories of
motion without distinct boundaries
e.g., liquid, gas, light, wind
Geolocation Point-of-Interest and business
validation data
Smart glasses Collection/annotation of video to
help machine learning models
understand indoor spaces
e-commerce Product clustering to help AI
identify where products are similar
or different
Software Audio data of overlapping
conversations to improve virtual
meeting UX
112. New market expansion Grow in attractive new markets and geographies and leverage our capabilities across a broad customer base Global Product – leveraging our annotation platform and tools to expand the business we do with Global customers China – capturing share in the high growth China market Enterprise – using our product suite and AI-driven automation to serve new customers and AI use cases Government – serving the emerging AI training data needs of government departments 12
New Markets delivered strong growth and new customers
New Markets Customer wins
Global Product, Enterprise, Government, and China #
US$M
46
47.8 42
36.3 36
32
30
Revenue
EBITDA 24
1H20 1H21
1Q20 2Q20 3Q20 4Q20 1Q21 2Q21
-7.9 -7.4
1H21 revenue of $47.8M, up 31.5% 74 new customers in 1H21, further
EBITDA loss reduced by 5.8% to -$7.4M expanding our customer base
Growth driven by China, new Enterprise 320+ active1 customers across diverse
customer wins and new product-led projects industries, geographies
with Global customers
1. Paid for Appen products and services in the last 12 months
13New Markets revenue breakdown
Global Product Enterprise, China, Government
Global customers using Appen platform US$M
US$M
26 27
25
22 27%1 22
32%1 19
17
16
13
7
1H19 2H19 1H20 2H20 1H21 1H19 2H19 1H20 2H20 1H21
1H21 revenue of $22.3M, up 15.2% from 1H20 1H21 revenue of $25.5M, up 50.1% from
32% CAGR 1H19-1H21 1H20
Growth due to Global customers’ use of our 27% CAGR 1H19-1H21
annotation platform and tools Growth driven by China and new project
wins from Enterprise customers
1. Annualised CAGR from 1H19 to 1H21
14New Markets driving committed revenue
Annual contract value (ACV) Revenue by type
At end of period During the period
US$M US$M
119.6
103.0 98.7
69% 69%
93% 88%
97% Project
Committed
25.0
31% 31%
3% 7% 12%
2H19 1H20 2H20 1H21 1H19 2H19 1H20 2H20 1H21
ACV of $119.6M, up 16% from 1H20 $61.8M of committed revenue in 1H21,
Increase underpinned by the expansion of 31% of total revenue
enterprise-wide platform agreement with an Product led focus driving valuable
existing Global customer committed revenue
15Capturing share in the
high growth China market
China revenue 1H21 revenue of US$7.5M, 5.8x 1H20
US$M
60% compound growth rate 1Q20-2Q21
4.5
Strong result driven by growing business with tech
+60%
QoQ
giants plus new logo wins
2.9 Winning new deals in speech and image annotation and
speech data collection in local and global languages
2.1
Strong position in autonomous vehicles
1.4
0.9 Growing China crowd
0.4
Standalone tech stack and separate local management,
engineering and sales teams
1Q20 2Q20 3Q20 4Q20 1Q21 2Q21
Expanded to four locations - Beijing, Shanghai,
Wuxi, Dalian
Gross margin continues to improve
16Growing our Enterprise New Enterprise projects
customer base
Automotive Technology Online retail
Product
Growing customer base Driver activity Translation pair
categorisation and
monitoring evaluation
search relevance
Continued project expansion
Average revenue per project up 18% year on
year Professional Healthcare Academia
Expansion supported by investments in services Data collection and
annotation platform and tools Classification and Handwriting data
annotation of
named entity collection
patient events
Return to on-site projects and data collection recognition
in the US and Europe post lockdowns
Sales and marketing cadence returning post
Online food
lockdowns Telco Retail
ordering
Home interior
Fashion annotation Product ontology video collection
and categorisation
17Growing opportunities
with Government
New partnerships with leading government
contractors and integrators
New engagements with government research labs
Increased opportunities in space and mapping
projects
Launched new tiled imagery tool to support
geospatial annotation
Longer sales and budget cycles impacted by
early-stage market dynamics
183. Product led Build scalable products and processes to deliver high-quality training data, faster, with improved unit economics Our product suite expands our addressable market and customer base, and enables us to support the long tail of companies that are investing in AI Adding machine learning models and automation functionality increases productivity, reduces unit cost Product revenue streams drive ACV and committed revenue Products are the foundation for future capabilities 10.8% of revenue invested in product development in 1H21 19
Building scalable products

                                                                              New products

      Appen              Appen Data                  Appen                      Appen                         Appen
     Connect          Annotation Platform          Intelligence            In-Platform Audit                  Mobile

  Match our global      Collect and annotate   Empower Appen products       Organise and analyse         Engages, enables and
 crowd workforce to         training data      with proprietary machine    training data to identify        expands crowd
  annotation tasks                                  learning models       quality, distribution & bias

20
ML-powered automation project deployments in 1H21
Automatic Speech Recognition
20% efficiency gain
model for video transcription
Computer vision model for 200% annotation speed
e-commerce improvement
Object detection model for 29% efficiency gain
2D video 22% quality improvement
ML for automated audio 93% accuracy without human
segmentation intervention
7x more effective than manual
Worker fraud detection model
detection
50% increase in crowd
Targeted task allocation
conversion
21Quadrant acquisition
A global leader in mobile location and Point-of-Interest data
Location analytics and
intelligence market to
reach $29.8B1 by 2027
29.8
+14%
CAGR
Hydra Geolancer QCMP
Leading location data High-fidelity crowd sourced Consent management
intelligence provider with Point-of-Interest data platform to track location data 11.9
global data presence origination
Used in location-based For last-mile delivery, real Utilises blockchain technology
advertising, urban planning estate, retail search and to verify data as authentic and
and transport optimisation mapping transparent
1. Research and Markets: Location Intelligence Market Size 2020 – 2027
22Quadrant unlocks new market potential for Appen
Strategic rationale Acquisition details
Quadrant’s highly-scalable approach to US$25M upfront, funded from existing cash
data capture and processing aligns to reserves
Appen’s product-led strategy
Potential additional payment of up to
Provides Appen’s customers with access to US$20M in Appen shares to be issued on
additional high-quality location data assets achievement of revenue milestones
Combining Quadrant’s location technology Appen intends to increase investment in
with Appen’s global crowd will rapidly scale Quadrant’s product and market expansion to
breadth and depth of data collection further accelerate growth
capabilities
Opportunity to expand Appen services into
Quadrant’s strong Southeast Asia footprint
231H21 sustainability highlights
Multi-year partnership with the World
Economic Forum on Responsible AI
helping to develop and promote responsible
AI standards
Calculated our 2019 and 2020 carbon
footprint in accordance with the GHG
Protocol; and have a low emissions intensity
3.16g CO2e/$ revenue
Disclosed to CDP - provided data for Scope
1, 2 and 3 (business travel, accommodation
and waste) emissions
Strengthened risk and procurement
processes for modern slavery and published
our first Modern Slavery Statement
Appen’s Impact Sourcing projects provide digital micro-work – image courtesy of cLabs, Toca
24Making an impact through digital work
Impact Pulse Survey of our crowd1
40% 1 in 5 39% 69%
relied on our work from home were long-term unemployed relied on Appen as their use their Appen earnings to
model due to barriers to (>1 year) before joining Appen primary source of income support their household or to
accessing traditional work e.g., pay for education
family, health, cultural reasons
12 new Impact Partnerships with community organisations
World Food Lions Club of Konexio READI-net
Program London Sourcing low-resource Providing work to people
language, Nyanja, while with disabilities in the US
Piloting digital work for youth in Working with Autism Hounslow providing opportunities to
Kibera, a large urban informal to offer data collection work refugees in Malawi
settlement in Kenya using the Appen Mobile App
1. Survey of Appen contractors, March 2021
25Revenue and EBITDA summary
% Challenging pcp comparison with 1H20 revenue split at
US$M 1H21 1H20 change 49%, significantly higher than historic split and FY21
forecast, coupled with the higher cost base in 1H21
Global Services 148.8 163.9 (9.2%)
1H21 revenue impacted by Global customers’ allocation of
New Markets 47.8 36.3 31.5% resources to new and non-advertising related projects
Other 0.0 0.3 Gross profit margin impacted by customer and project mix
Total revenue 196.6 200.5 (2.0%) 1H21 expenses higher due to the fully annualised impact of
FY20 growth investments and 1H21 investment in New
Statutory EBITDA 25.2 33.4 (24.6%) Markets, partly offset by share-based payment true up
Underlying EBITDA1 27.7 32.3 (14.3%) adjustment
Underlying EBITDA margin 14.1% 16.1% Underlying EBITDA margins impacted by lower revenue and
gross margin and the higher cost base
Statutory NPAT 6.7 14.9 (55.1%) Underlying NPAT impacted by increased amortisation
Underlying NPAT 2 12.5 19.3 (35.0%) associated with investment in product development
Numbers are subject to rounding $2.3M restructure charge reflects 1H21 costs and provision
for costs that will be incurred in 2H21
1. Underlying EBITDA excludes restructure costs, transaction costs, acquisition related share-based Effective tax rate reduced to 20.5% from 22.8% mainly due
payment expenses, and for 1H20, fair value (consideration) adjustments relating to the Figure
Eight acquisition to the tax effect of share-based payments and overseas
2. Underlying NPAT excludes after tax impact of items relating to restructure and acquisition related tax rate differential. Normalised tax rate (excluding share-
costs, including acquisition related intangibles, share-based payments and transaction costs, and
for 1H20, consideration adjustments relating to the Figure Eight acquisition
based payment related items) is ~28%
26Core productivity has improved, growth investments continue
Expenses as % of revenue
30%
25%
20%
Gap between total expense and core expense
driven by incremental growth investments and
investments in New Markets
15%
10% Core expenses include service delivery, IT,
recruitment, HR and corporate costs, and have
5% decreased as a percentage of revenue,
reflecting improved operating scale
0%
H2 2018 H1 2019 H2 2019 H1 2020 H2 2020 H1 2021
Total expense as % of revenue Core expense as % of total revenue
27Investment in product development
Investment in product development1
US$M 1H21 investment of $21.2M reflects increased focus
Product development as a % of revenue
on product development to drive customer wins,
scalability, repeatability, quality and margin
8.6%
10.8% expansion
4.0%
Increase in FY203 vs FY19 due to strategic focus on
35.3 engineering, with new engineering staff added to
develop new products and enhance existing
products
18.7
21.2 Approximately 53% of product spend was capitalised
14.8
in 1H21 (consistent with FY20), reflecting investment
11.2 53% capitalised
in platform development, new tools and products
9.9
16.6 10.8% of revenue was reinvested in product
10.0 47% expensed development in 1H21
4.9
2H21 quantum and capitalisation percentage
FY19 2 FY20 3 1H21
expected to be in line with 1H21
1. Product development relates to investment in engineering to ensure that the annotation platform and tools support our customers and their use cases, and drive efficiencies and scale
2. FY19 includes amounts capitalised related to the acquisition of Figure Eight
3. FY20 spend includes annualisation of Figure Eight engineering spend (acquisition completed April 2019)
28Conservative approach to amortisation
Product development is amortised over 3 years. Amortisation expense has increased due to the
strategic focus on product development.
100%
Year of US$’000 90%
origination of Year of amortisation3
Amounts amortised 80% 2018 2019 2020 2021
capitalised
Amount
spend 70%
capitalised 2018 2019 2020 1H21
60%
20171 288 96 96 96 -
50%
2018 762 247 254 261 -
40%
20192 9,925 - 3,168 2,950 1,629
30%
2020 18,712 - - 6,063 3,118
20%
1H21 11,217 - - - 1,928
10%
Total 40,904 343 3,518 9,370 6,675 0%
1
Figures may vary from period to period due to the impact of foreign currency translation 2017 2018 2019 2 2020 1H21
Year of origination of capitalised spend
1. Amortisation of 2017 capitalised spend commenced in 2018
2. 2019 includes capitalised amounts relating to the acquisition of Figure Eight
3. 2017 to 2020 amortisation rates have been annualised
29Strong and resilient balance sheet
US$M Jun 2021 Dec 2020 Strong balance sheet with no debt
Cash 66.0 60.5 $66.0M in cash at 30 June 2021, increased from
Receivables 41.1 50.6
31 Dec 2020 as a result of effective cash
collection, contributing to the reduction in
Contract assets1 28.2 31.5 receivables
Other current assets 16.0 12.2
Non-current assets include $202.6M of goodwill
Non-current Assets 297.4 306.8 and identifiable intangible assets of $72.7M
Total assets 448.7 461.6 Impairment testing as at 30 June 2021 resulting in
Current liabilities 52.9 60.0 adequate headroom
Non-current liabilities 23.0 28.3 Total liabilities lower due to reductions in accounts
Total liabilities 75.9 88.3 payable and deferred tax liability
Net assets 372.8 373.3 Interim dividend of A$ 4.5 cps, 50% franked, in line
Total equity 372.8 373.3
with 2020 interim dividend
Numbers are subject to rounding
1. Relates to services completed that the Group is yet to receive an unconditional right to the
amount due, as the relevant invoices in respect of the completed work are pending
satisfaction of the customers’ billing milestones or billing period. All contract assets were
subsequently invoiced and the majority paid after 30 June 2021
30Effective cash flow conversion
US$M 1H21 1H20 1H20 cash flow from operations benefitted from
Receipts 210.4 219.3 favourable receipt timing differences
Payments and other (182.5) (169.8) Closing cash balance reduced by $20.7M,
impacted by repayment of borrowings of $23.5M in
Cash flow from operations
before interest and tax
27.9 49.5 August 2020
Net interest (0.3) (0.3) Net cash from operations reduced in 1H21 due to
higher cost base and lower revenue
Taxes (1.5) (2.3)
Cash was used for product development and
Net cash from operations 26.1 46.9
operating costs, and to pay tax and dividends
Cash flows - investing activities (12.3) (33.2)
Cash conversion rate from EBITDA was 101%
Cash flows - financing activities (7.5) 20.2
Net cash flow for the period 6.3 33.9
Cash flow reconciliation (US$M) 1H21 1H20
Opening cash balance 60.5 52.8
Underlying EBITDA 27.7 32.3
FX impact (0.8) (0.0)
Working capital 0.2 17.2
Closing cash balance 66.0 86.7
Cash flow from operations before
Numbers are subject to rounding 27.9 49.5
interest and tax
Underlying EBITDA cash conversion 101% 153%
31Outlook
Full year underlying EBITDA will be impacted by the planned investment in Quadrant1 – and reduces the
guidance provided in February and May of $83M - $90M, by $2M, to $81M - $88M
Full year underlying EBITDA expected to be at the low end of the range due to ad-related project impacts
Year-to-date revenue plus orders in hand of ~$360M at August 2021, 10% above pcp of ~$328M which was
79% of FY20 full year revenue2
Forecast supported by stronger order book, higher confidence in pipeline, and expected H2 21 revenue
skew (weighted to Q4) due to customer delivery schedule for e-commerce, digital ads and search programs
H2 21 revenue in line with historic splits (ex. FY20) – full year revenue growth of mid to high single-digits for
Global Services, circa 25% for New Markets
Gross margin expected to improve in H2 21 consistent with FY20, due to higher revenue and the customer
and project mix
Moderate expense growth in H2 21, restructure-related cost savings of ~$15M in FY22 will be largely
reinvested to drive product development and growth
Full year underlying EBITDA margins in line with FY20
1. Appen intends to increase investment in Quadrant’s product and market expansion for the remainder of 2021 and in 2022, to further accelerate growth
2. Year-to-date revenue and orders in hand in August 2020 was ~A$475M, equivalent to ~US$328M at the FY20 average AUD/USD FX rate of 69.04
32Strongly positioned for the long term
Largest global player in AI training data
collection and annotation
Strong AI industry tailwinds – growing adoption,
use cases
Market-leading crowd, technology and Strong New market Product
expertise - capabilities aligned with Global core expansion led
customers’ evolving needs
Growth investments in New Markets delivering
revenue growth, more customers, higher ACV
AI-enabled product suite opening new markets
and delivering automation and scalability
33Appendix: Summary financials
CAGR
US$’000 2015-2020 2015 2016 2017 2018 2019 2020
Revenue 46% 62,136 81,655 127,742 272,415 372,181 412,996
Underlying EBITDA 48% 10,462 12,811 21,592 52,839 70,176 75,439
Underlying EBITDA margin - 16.8% 15.7% 16.9% 19.4% 18.9% 18.3%
Underlying NPAT 49% 6,241 7,812 15,145 36,663 44,902 45,276
Underlying diluted EPS cps 42% 6.42 7.84 15.23 33.87 37.33 36.61
CAGR
US$’000 1H16-1H21 1H16 1H17 1H18 1H19 1H20 1H21
Revenue 38% 39,311 55,868 117,925 173,179 200,487 196,562
Underlying EBITDA 34% 6,509 9,632 19,754 32,740 32,319 27,688
Underlying EBITDA margin - 16.6% 17.2% 16.8% 18.9% 16.1% 14.1%
Underlying NPAT 26% 3,945 6,122 13,726 20,947 19,257 12,511
Underlying diluted EPS cps 20% 3.98 6.19 12.71 17.86 15.70 10.01
34appen.com/investors 35
You can also read