Arctic winter warming due to cloud feedbacks in warm climates
←
→
Page content transcription
If your browser does not render page correctly, please read the page content below
Arctic winter warming due to cloud
     feedbacks in warm climates
       (also: a word on warming of mid-latitude
                Pliocene upwelling sites)
                    EGU 2021
                    Eli Tziperman

                Collaborators:
  Camille Hankel, Minmin Fu, Dorian Abbot,
Nathan Arnold, Tim Cronin, Harrison Li, Zeyuan
      Hu, Dave Randall, Mark Branson
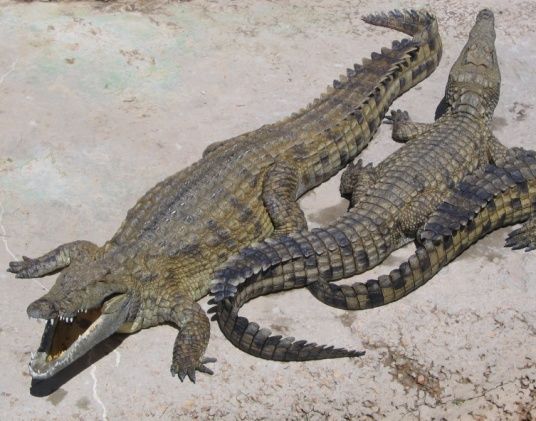
Warm climates during ~146-34 Ma
Above-freezing min winter temperatures @ 60N, interior of N. America (present day: −40°C);

 Crocodiles in Greenland, Palm trees in Wyoming!

Crocodiles need: Mean annual
T>14.2°C & Cold month mean >5.5°C
[Markwick, 1998]

Warm climates during ~146-34 Ma
Above-freezing min winter temperatures @ 60N, interior of N. America (present day: −40°C);

 Crocodiles in Greenland, Palm trees in Wyoming!

                                                            Cold air mass passing over
                                                            Minnesota, January 2014.
Crocodiles need: Mean annual
T>14.2°C & Cold month mean >5.5°C                           −40C to −54C wind chills
[Markwick, 1998]                                            http://blogs.mprnews.org/updraft/2014
Warm climates during ~146-34 Ma
Above-freezing min winter temperatures @ 60N, interior of N. America (present day: −40°C);
Crocodiles in Greenland, Palm trees in Wyoming!
vi v e
s u r
h e y t s ?
l d t ve n
c o u n e
w us i o
: h o i n t r
t i o n ai r
u e s o l a r
Q g p
u ri n
d Cold air mass passing over
Minnesota, January 2014.
Crocodiles need: Mean annual
T>14.2°C & Cold month mean >5.5°C −40C to −54C wind chills
[Markwick, 1998] http://blogs.mprnews.org/updraft/2014conditions. Snapshots of the vertical profile of temperature and an initial surface warming of only 20 °C relative to the reference
clouds are shown every 2 d over a 14-d period. Cooling and simulation (Fig. 1C). These dramatic results amount to a sup-
Suppression of Arctic air formation for warmer ocean
condensation near the surface lead to formation of an optically pression of Arctic air formation in a much warmer climate.
[Cronin & Tziperman 2015]
A B C
AND PLANETARY SCIENCES
EARTH, ATMOSPHERIC,
D
E
Fig. 1. Single-column simulation results of polar air formation for cold and warm initial atmospheric columns. A reference simulation with initial 2-m air
temperature T2 ð0Þ = 0° C is shown in A and by purple lines in C−E. A simulation with much warmer initial 2-m air temperature T2 ð0Þ = 20° C is shown in B andconditions. Snapshots of the vertical profile of temperature and an initial surface warming of only 20 °C relative to the reference
clouds are shown every 2 d over a 14-d period. Cooling and simulation (Fig. 1C). These dramatic results amount to a sup-
Suppression of Arctic air formation for warmer ocean
condensation near the surface lead to formation of an optically pression of Arctic air formation in a much warmer climate.
[Cronin & Tziperman 2015] (A) Simulating single-column (WRF) air
A B with initial 2-m air temperature
C T2(t=0) =
AND PLANETARY SCIENCES
0°C going from ocean to over high-
EARTH, ATMOSPHERIC,
latitude land in winter, no solar forcing.
Results: surface temperature cools by
60C in 2 weeks, strong inversion
D
develops. (following Curry 1983)
E
Fig. 1. Single-column simulation results of polar air formation for cold and warm initial atmospheric columns. A reference simulation with initial 2-m air
temperature T2 ð0Þ = 0° C is shown in A and by purple lines in C−E. A simulation with much warmer initial 2-m air temperature T2 ð0Þ = 20° C is shown in B andconditions. Snapshots of the vertical profile of temperature and an initial conditions.
surface warming of only
Snapshots of 20
the°C relative to the
conditions.
vertical profile ofreference
Snapshots of theand
temperature verticalanprof
ini
clouds are shown every 2 d over a 14-d period. Cooling and simulationclouds
(Fig. are
1C).shown
These every
dramatic
2 d resultsa amount
clouds
over to a sup-
are period.
14-d shown every 2 dand
Cooling over simula
a 14-d
Suppression of Arctic air formation for warmer ocean
condensation near the surface lead to formation of an optically pression of Arctic air formation
condensation near the in a much
surface warmer climate.
condensation
lead to formationnearofthe
an surface
opticallylead pressio
to fo
[Cronin & Tziperman 2015] (A) Simulating single-column (WRF) air
A B with initial 2-m air temperature
C A T2(t=0) = A B B
AND PLANETARY SCIENCES
0°C going from ocean to over high-
EARTH, ATMOSPHERIC,
latitude land in winter, no solar forcing.
Results: surface temperature cools by
60C in 2 weeks, strong inversion
D
develops. (following Curry 1983)
(B) Warmer initial conditions:
E T2(t=0) =
20°C Day-1 cooling similar to above, but
further surface cooling is suppressed by
LW effects of low cloud layer! No surface
inversion develops.
Green bands: low clouds w/large emissivity & a greenhouse effect; prevents further cooling
Fig. 1. Single-column simulation results of polar air formation for cold and warm initial atmospheric
temperature T2 ð0Þ = 0° C is shown in A and by purple lines in C−E. A simulation with much warmer
temperature
columns. Asimulation
Fig. 1. Single-column
initialT2-m
2 ð0Þ air
reference results
= 0°temperature
C is shown in
simulation
Fig.of
T2Að0Þ
and
with
1. polar
= 20°
by C
initial
air
is shown
purple
temperature T2lines
2-msimulation
formation
Single-column
inin
ð0Þ =
airfor coldresults
BC−E.
0° and
C
and warm
A simulation
is shown in A andwith
ini
of pola
by mu
pumore liquid water in clouds (Fig. 1E).
The reduced rate of cooling in response to higher initial tem-
Time-to-freezing increases nonlinearly with initial temperature
perature T2 ð0Þ is robust with respect to the microphysics scheme
used, as seen in the difference between the initial temperature and
the time mean 2-m air temperature over the duration of the sim-
ulation, ΔT2 = T2 ð0Þ − T2 (Fig. 2A). The average surface cooling
across microphysics schemes for T2 ð0Þ = 0 °C is ΔT2 ≈ 38 °C, and is
reduced by 21 °C to ΔT2 ≈ 17° C for T2 ð0Þ = 20° C. The suppres-
sion of Arctic air formation thus amplifies warming of the initial B
Tatmospheric state by over a factor of two.
Cold initial The time taken for the 2-m air temperature to drop below
conditions freezing, τ0, is less than 0.5 d if T2 ð0Þ < 10° C, but rises steeply to
∼10 d for T2 ð0Þ = 20° C (Fig. 2B). This nonlinearity is a conse-
0° quence of the differential surface cooling rates under clear and
cloudy skies as well as the usetimeof a threshold-crossing metric; the
surface initially cools rapidly under clear skies, but cools much more
slowly once clouds form, with a temperature plateau for many days
(solid orange line in Fig. 1C). Thus, for T2 ð0Þ < 10° C, the surface
drops below freezing before clouds form and τ0 is relatively in-
Warm initial Tsensitive to T2 ð0Þ, but for T2 ð0Þ > 10° C, the surface drops below
freezing after clouds form, and τ0 is much more sensitive to T2 ð0Þ.
conditions Sensitivity tests allow us to decompose the reduced rate of
cooling into contributions from cloud radiative effects, latent
0°heat release, and clear-sky longwave radiation effects. The dash-
time in Fig. 2A indicates the
dotted line marked “no microphysics”
cooling that takes place in simulations where no phase change of
water is allowed, and thus no cloud formation or latent heat
release. The modestly reduced cooling of this case at higher
T2 ð0Þ owes to the decrease in clear-sky surface radiative cooling
Fig. 2. Simulation results for (A) average surface cooling over 2-wk period,
with higher atmospheric temperature (see also Fig. 1D, com- ΔT2 (° C), and (B) number of days taken for the 2-m air temperature to drop
paring initial surface longwave cooling rates). The dash-dotted below freezing, τ0, both as a function of T2 ð0Þ. Black line (“multi-μphysics
line marked “no CRF” in Fig. 2A shows the cooling that takes mean”) indicates an average across the solid-line microphysics parameteri-
place when phase change of water is allowed, but clouds have no zations, which contain both liquid- and ice-phase processes. Dash-dotted
effect on radiative transfer calculations. The difference between lines show unrealistic microphysics assumptions used to diagnose the re-
Time-to-freezing increases rapidly for T (t=0)>10C
the “no microphysics” and “no CRF” 2 simulations thus indicates
that the influence of latent heat release on the reduction of
sponse mechanism; “no microphysics” indicates no phase change of water
(Cronin & Tziperman, 2015, PNAS; extension to
allowed, and thus no clouds at all; “no CRF” indicates that clouds are
because plateau occurs above freezing point then
surface cooling is only ∼ 3° C at T2 ð0Þ = 20° C. The large differ-
ence between the no CRF dash-dotted line and the set of solid
a 2d column cloud resolving model: Cronin, Li,
allowed to form but do not affect radiative transfer; “No ice (Kessler)” in-
dicates a microphysics scheme that has only liquid condensate, regardless of
lines, including the black multimicrophysics mean line, shows Tziperman, 2017, JAS)
temperature. A quadratic fit to the solid black line in A is shown in blackmore liquid water in clouds (Fig. 1E).
The reduced rate of cooling in response to higher initial tem-
Time-to-freezing increases nonlinearly with initial temperature
perature T2 ð0Þ is robust with respect to the microphysics scheme
used, as seen in the difference between the initial temperature and
the time mean 2-m air temperature over the duration of the sim-
ulation, ΔT2 = T2 ð0Þ − T2 (Fig. 2A). The average surface cooling
across microphysics schemes for T2 ð0Þ = 0 °C is ΔT2 ≈ 38 °C, and is
reduced by 21 °C to ΔT2 ≈ 17° C for T2 ð0Þ = 20° C. The suppres-
sion of Arctic air formation thus amplifies warming of the initial B
Tatmospheric state by over a factor of two.
Cold initial The time taken for the 2-m air temperature to drop below
conditions freezing, τ0, is less than 0.5 d if T2 ð0Þ < 10° C, but rises steeply to
∼10 d for T2 ð0Þ = 20° C (Fig. 2B). This nonlinearity is a conse-
0° quence of the differential surface cooling rates under clear and
cloudy skies as well as the usetimeof a threshold-crossing metric; the
surface initially cools rapidly under clear skies, but cools much more
slowly once clouds form, with a temperature plateau for many days
(solid orange line in Fig. 1C). Thus, for T2 ð0Þ < 10° C, the surface
drops below freezing before clouds form and τ0 is relatively in-
Warm initial Tsensitive to T2 ð0Þ, but for T2 ð0Þ > 10° C, the surface drops below
freezing after clouds form, and τ0 is much more sensitive to T2 ð0Þ.
conditions Sensitivity tests allow us to decompose the reduced rate of
cooling into contributions from cloud radiative effects, latent
0°heat release, and clear-sky longwave radiation effects. The dash-
time in Fig. 2A indicates the
dotted line marked “no microphysics”
cooling that takes place in simulations where no phase change of
water is allowed, and thus no cloud formation or latent heat
release. The modestly reduced cooling of this case at higher
Initial cooling
T2 ð0Þ owes to the decrease in clear-sky surface radiative cooling
with higher atmospheric temperature (see also Fig. 1D, com-
Fig. 2. Simulation results for (A) average surface cooling over 2-wk period,
ΔT2 (° C), and (B) number of days taken for the 2-m air temperature to drop
paring initial surface longwave cooling rates). The dash-dotted
before low clouds
line marked “no CRF” in Fig. 2A shows the cooling that takes
below freezing, τ0, both as a function of T2 ð0Þ. Black line (“multi-μphysics
mean”) indicates an average across the solid-line microphysics parameteri-
place when phase change of water is allowed, but clouds have no zations, which contain both liquid- and ice-phase processes. Dash-dotted
effect on radiative transfer calculations. The difference between lines show unrealistic microphysics assumptions used to diagnose the re-
Time-to-freezing increases rapidly for T (t=0)>10C
the “no microphysics” and “no CRF” 2 simulations thus indicates
that the influence of latent heat release on the reduction of
sponse mechanism; “no microphysics” indicates no phase change of water
(Cronin & Tziperman, 2015, PNAS; extension to
allowed, and thus no clouds at all; “no CRF” indicates that clouds are
because plateau occurs above freezing point then
surface cooling is only ∼ 3° C at T2 ð0Þ = 20° C. The large differ-
ence between the no CRF dash-dotted line and the set of solid
a 2d column cloud resolving model: Cronin, Li,
allowed to form but do not affect radiative transfer; “No ice (Kessler)” in-
dicates a microphysics scheme that has only liquid condensate, regardless of
lines, including the black multimicrophysics mean line, shows Tziperman, 2017, JAS)
temperature. A quadratic fit to the solid black line in A is shown in blackmore liquid water in clouds (Fig. 1E).
The reduced rate of cooling in response to higher initial tem-
Time-to-freezing increases nonlinearly with initial temperature
perature T2 ð0Þ is robust with respect to the microphysics scheme
used, as seen in the difference between the initial temperature and
the time mean 2-m air temperature over the duration of the sim-
ulation, ΔT2 = T2 ð0Þ − T2 (Fig. 2A). The average surface cooling
across microphysics schemes for T2 ð0Þ = 0 °C is ΔT2 ≈ 38 °C, and is
reduced by 21 °C to ΔT2 ≈ 17° C for T2 ð0Þ = 20° C. The suppres-
sion of Arctic air formation thus amplifies warming of the initial B
Tatmospheric state by over a factor of two.
Cold initial The time taken for the 2-m air temperature to drop below
conditions freezing, τ0, is less than 0.5 d if T2 ð0Þ < 10° C, but rises steeply to
∼10 d for T2 ð0Þ = 20° C (Fig. 2B). This nonlinearity is a conse-
0° quence of the differential surface cooling rates under clear and
cloudy skies as well as the usetimeof a threshold-crossing metric; the
surface initially cools rapidly under clear skies, but cools much more
slowly once clouds form, with a temperature plateau for many days
(solid orange line in Fig. 1C). Thus, for T2 ð0Þ < 10° C, the surface
drops below freezing before clouds form and τ0 is relatively in-
Warm initial Tsensitive to T2 ð0Þ, but for T2 ð0Þ > 10° C, the surface drops below
freezing after clouds form, and τ0 is much more sensitive to T2 ð0Þ.
conditions Sensitivity tests allow us to decompose the reduced rate of
cooling into contributions from cloud radiative effects, latent
0°heat release, and clear-sky longwave radiation effects. The dash-
time in Fig. 2A indicates the
dotted line marked “no microphysics”
cooling that takes place in simulations where no phase change of
water is allowed, and thus no cloud formation or latent heat
release. The modestly reduced cooling of this case at higher
Initial cooling Plateau of suspended Fig. 2. Simulation results for (A) average surface cooling over 2-wk period,
T2 ð0Þ owes to the decrease in clear-sky surface radiative cooling
with higher atmospheric temperature (see also Fig. 1D, com-
before low clouds cooling due to low clouds
ΔT (° C), and (B) number of days taken for the 2-m air temperature to drop
paring initial surface longwave cooling rates). The dash-dotted
2
below freezing, τ , both as a function of T ð0Þ. Black line (“multi-μphysics
0 2
line marked “no CRF” in Fig. 2A shows the cooling that takes mean”) indicates an average across the solid-line microphysics parameteri-
place when phase change of water is allowed, but clouds have no zations, which contain both liquid- and ice-phase processes. Dash-dotted
effect on radiative transfer calculations. The difference between lines show unrealistic microphysics assumptions used to diagnose the re-
Time-to-freezing increases rapidly for T (t=0)>10C
the “no microphysics” and “no CRF” 2 simulations thus indicates
that the influence of latent heat release on the reduction of
sponse mechanism; “no microphysics” indicates no phase change of water
(Cronin & Tziperman, 2015, PNAS; extension to
allowed, and thus no clouds at all; “no CRF” indicates that clouds are
because plateau occurs above freezing point then
surface cooling is only ∼ 3° C at T2 ð0Þ = 20° C. The large differ-
ence between the no CRF dash-dotted line and the set of solid
a 2d column cloud resolving model: Cronin, Li,
allowed to form but do not affect radiative transfer; “No ice (Kessler)” in-
dicates a microphysics scheme that has only liquid condensate, regardless of
lines, including the black multimicrophysics mean line, shows Tziperman, 2017, JAS)
temperature. A quadratic fit to the solid black line in A is shown in blackArctic air suppression in a 3-dimensional atmospheric GCM
present-day
SST
a
S T
d S
i b e
sc r s
re
p nar i o
s c e b
c
very warm
SST
d
Extension to a 3D
GCM: Hu, Cronin,
Tziperman, 2018.T2m_1%min
Arctic air suppression in a 3-dimensional atmospheric GCM
T2m std
T2m_1% T2m_1% - T2m_1%min
d continental surfacee f
temperature increases
present-day
SST c) SSTn=20
PDFs of continental
ECP2300
a RCP2090
g h i temperatures: cold
PI
T a b c winter conditions
S S
e d eliminated
c ri b
re s i o s
p nar
sc e b
dj k
e fl
c
very warm g h i
SST
d
e) Extension to a 3D
GCM: Hu, Cronin,
Tziperman, 2018.
j k lT2m_1%min
Arctic air suppression in a 3-dimensional atmospheric GCM
T2m std
T2m_1% T2m_1% - T2m_1%min
d continental surfacee f
temperature increases
present-day a b c
SST c) SSTn=20
PDFs of continental
ECP2300
a RCP2090
g h i temperatures: cold
PI
T a b c winter conditions
S S
e d eliminated
ri b
re sc
i o s d e f
p nar
sc e b
dj k
e fl
g h i
c Low clouds appear
change
very warm g h i
SST
e) Extension to a 3D
jd k l
GCM: Hu, Cronin,
Tziperman, 2018.
j k lT2m_1%min T2m std
Arctic air suppression in a 3-dimensional atmospheric GCM T2m_1% T2m_1% - T2m_1%min
d continental surfacee f
temperature increases
present-day a b c
SST c) SSTn=20
ECP2300
PDFs of continental
a RCP2090
g h i temperatures: cold
PI
T a b c winter conditions
S S
e d eliminated
ri b
re sc
i o s d e f
p nar
sc e b
dj k
e fl
g surface inversion
h i
c Low clouds appear eliminated with
change
warm SST
very warm g h i
SST
e) Extension to a 3D
jd k l
GCM: Hu, Cronin,
Tziperman, 2018.
j k l
Coldest temperatures warm (mean&pdf), more low clouds over land,
Temperature profile without inversion - all consistent w/ Arctic air suppressionRelevance to future projections: Arctic amplification
& lapse-rate “feedback”
In tropics, greater warming in upper troposphere than at surface ➨ a
negative feedback, result of moist adiabatic lapse rate;
In Arctic, warming is enhanced in lower atmosphere ➨ a
positive feedback, still not well understood [Pithan & Mauritsen 2014]
σTe4 σTe4
Standard:
ze Increased CO2 ze
TOA warming needed
Z to balance ∆CO2 Z
Tropics Arctic
surface surface
T T
Low clouds that suppress arctic air formation, also explain this high-
latitude lapse-rate response as climate warms!Some Air trajectories in Arctic air formation events pass over Arctic ocean
Air trajectories leading to polar air
formation often pass over Arctic; if it is
sea-ice covered, Arctic air suppression
wont work because air arriving to North
America would be too cold and dry.
➔ Must eliminate winter Arctic sea
ice, to allow air to accumulate
moisture and suppress Arctic air
formation over land, allowing
crocodiles and palm trees to survive…
Walsh et al 2001Arctic warming & multiple equilibria due to convective cloud Arctic feedback
convecting convective, cloudy,
surface temperature
warm warm state
cold
non-convecting
non convective, A 2-level model used to
Multiple-equilibria! clear sky, cold state analyze convective cloud
feedback
Abbot & Tziperman, 2009
CO2 (normalized)
[Abbot, Tziperman +et al, 2008–12: QJRMS, GRL, JAS, J. Climate; Arnold et al 2014: PNAS]Arctic warming & multiple equilibria due to convective cloud Arctic feedback
convecting convective, cloudy,
surface temperature
warm warm state
cold
non-convecting
non convective, A 2-level model used to
Multiple-equilibria! clear sky, cold state analyze convective cloud
feedback
Abbot & Tziperman, 2009
CO2 (normalized)
Convecting winter-time Arctic is a surprising state, can help keep Arctic warm and
ice free during winters in warm climates & was seen at 4xCO2 in column model,
CMIP3, SP-CESM. And now also for CMIP5/RCP8.5: next slide.
[Abbot, Tziperman +et al, 2008–12: QJRMS, GRL, JAS, J. Climate; Arnold et al 2014: PNAS]Winter-time Arctic convection in CMIP5 models, RCP8.5 2000-2300
showing convective precipitation as a function of year & latitude
only one CMIP5 model
does not show winter-
time Arctic convection
in extended RCP8.5
projection
Hankel and Tziperman 2021, in prepWarming of Mid-latitude Pliocene upwelling sites
Proxy observations: coastal upwelling sites near
most continents warmer by up to 10C from present
Step 1: prescribe wet conditions over coastal area;
➨ cooling ➨ weakening of zonal pressure gradient
➨ weakening of geostrophic along-coast winds prescribed wet
conditions lead to
cooling over land
Fu, Cane, Molnar, Tziperman 2021a,bWarming of Mid-latitude Pliocene upwelling sites
Proxy observations: coastal upwelling sites near
most continents warmer by up to 10C from present
Step 1: prescribe wet conditions over coastal area;
➨ cooling ➨ weakening of zonal pressure gradient
➨ weakening of geostrophic along-coast winds prescribed wet
conditions lead to
cooling over land
present climate on left, response to wet land on
right: upwelling wind weakens significantly! Fu, Cane, Molnar, Tziperman 2021a,bWarming of Mid-latitude Pliocene upwelling sites
Step 2: regional change to SST ➨ wetting of coastal areas
Summer precipitation
prescribed near-coastal SST warming
dramatically enhanced
A feedback: weakening of coastal winds ➨ weakening of upwelling ➨ warming SST
➨ further weakening of coastal winds Fu, Cane, Molnar, Tziperman 2021a,bWarming of Mid-latitude Pliocene upwelling sites
Step 2: regional change to SST ➨ wetting of coastal areas
Summer precipitation
prescribed near-coastal SST warming
dramatically enhanced
Mechanism:
✻ Enhanced cyclone track
density near coast and
✻ More MSE and
convection over land
A feedback: weakening of coastal winds ➨ weakening of upwelling ➨ warming SST
➨ further weakening of coastal winds Fu, Cane, Molnar, Tziperman 2021a,bConclusions:
Clouds in warm climates
1. We showed that high-latitude clouds provide a strong, positive warming feedback
at higher CO2 that can explain the warmth suggested by past climate proxies and
fossils both over the arctic and over continental interiors.Conclusions:
Clouds in warm climates
1. We showed that high-latitude clouds provide a strong, positive warming feedback
at higher CO2 that can explain the warmth suggested by past climate proxies and
fossils both over the arctic and over continental interiors.
2. The two mechanisms suggested: convection and high clouds in the Arctic ocean
during polar night, and low clouds over land, amplify each other.Conclusions:
Clouds in warm climates
1. We showed that high-latitude clouds provide a strong, positive warming feedback
at higher CO2 that can explain the warmth suggested by past climate proxies and
fossils both over the arctic and over continental interiors.
2. The two mechanisms suggested: convection and high clouds in the Arctic ocean
during polar night, and low clouds over land, amplify each other.
3. Both mechanisms show signs of occurring during past decades, explain the high
latitude lapse rate feedback, and may amplify as CO2 further increases in future.References Convective cloud feedback • D. S. Abbot and E. Tziperman. A high latitude convective cloud feedback and equable climates. Q. J. R. Meteorol. Soc., 134:165–185, 2008, doi:10.1002/qj.211. download. • D. S. Abbot and E. Tziperman. Sea ice, high latitude convection, and equable climates. Geophys. Res. Lett., 35:L03702, 2008, doi:10.1029/2007GL032286. download. • D. S. Abbot and E. Tziperman. Controls on the activation and strength of a high latitude convective-cloud feedback. J. Atmos. Sci., 66:519–529, February 2009, doi:10.1175/2008JAS2840.1. download. • D. S. Abbot, C. Walker, and E. Tziperman. Can a convective cloud feedback help to eliminate winter sea ice at high CO2 concentrations? J. Climate, 22(21):5719–5731, 2009, doi:10.1175/2009JCLI2854.1. download. • B. D. Leibowicz, D. S. Abbot, K. A. Emanuel, and E. Tziperman. Correlation between present-day model simulation of Arctic cloud radiative forcing and sea ice consistent with positive winter convective cloud feedback. J. Adv. Model. Earth Syst., 4, 2012, doi:10.1029/2012MS000153. download. • N. Arnold, M. Branson, M. A. Burt, D. S. Abbot, Z. Kuang, D. A. Randall, and E. Tziperman. Effects of explicit atmospheric convection at high CO2. Proc. Natl. Acad. Sci. U.S.A., 111(30):10943–10948, 2014. download. Arctic Air suppression • T. W. Cronin and E. Tziperman. Low clouds suppress Arctic air formation and amplify high-latitude continental winter warming. Proc. Natl. Acad. Sci. U.S.A., 112(37):11490–11495, 10.1073/pnas.1510937112, 2015. download. • T. W. Cronin, H. Li, and E. Tziperman. Suppression of arctic air formation with climate warming: Investigation with a 2-dimensional cloud-resolving model. J. Atmos. Sci., 74:2717–2736, 2017, doi:10.1175/JAS-D-16-0193.1. download. • Z. Hu, T. W. Cronin, and E. Tziperman. Suppression of cold weather events over high latitude continents in warm climates. Journal of Climate, 31(23):9625–9640, 2018, doi:10.1175/JCLI-D-18-0129.1. download.
You can also read