As of: 10/2016 - Immofinanz

Page created by Clara Bradley
 
CONTINUE READING
As of: 10/2016 - Immofinanz
As of: 10/2016
As of: 10/2016 - Immofinanz
CONTENT
01 IMMOFINANZ at a Glance & Strategy

02 Combination of IMMOFINANZ and CA Immo

03 Portfolio

04 Financing

05 Q1 2016A Results

06 Appendix

                                           Q1 2016A – 2
As of: 10/2016 - Immofinanz
PORTFOLIO SPLIT – COMMERCIAL REAL ESTATE
PLAYER WITH FOCUS ON EUROPE
ASSET CLASSES                                                                                     PROPERTY PORTFOLIO
                                                                                                                                                    8.2%
                                                                                                           20.0%                 11.4%          Czech             4.1%
                                                                                                           Austria               Poland       Republic       Slovakia

48.4%                                           46.4%                                   5.2%      21.4%               15.7%                 8.8%           8.1%          2.2%
Office                                          Retail                                  Others    Russia             Romania              Hungary    Germany            Non-
                                                                                                                                                                        core
                                                                                                                                                                    countries1

KEY DATA ON THE PROPERTY PORTFOLIO
                                                                                                                                                           31 JULY 2016
Total number of properties                                                                                                                                           361
Rentable space                                                                                                          in sqm                                2,187,976
Occupancy rate                                                                                                            in %                                     86.4%
Gross return on the standing investments                                                                                  in %                                      6.2%
Gross return on the standing investments (occupancy-adjusted)                                                             in %                                      7.2%
                  2
Portfolio value                                                                                                        in MEUR                                      5,405
 Thereof office                                                                                                        in MEUR                                      2,614
 Thereof retail                                                                                                        in MEUR                                      2,510
 Thereof other                                                                                                         in MEUR                                       281

1 In declining order based on the carrying amount: Slovenia, Serbia, Croatia, Bulgaria, Ukraine
2 Including properties held for sale
                                                                                                                                                                  Q1 2016A – 3
As of: 10/2016 - Immofinanz
KEY FIGURES

ASSET DATA                                                                 31 JULY 2016    STOCK EXCHANGE DATA                                          31 JULY 2016
Balance sheet total                                             in MEUR          7,385.4   Book value per share                                in EUR            3.02
Equity as % of the balance sheet total                             in %           39.4%    Share price at end of period                        in EUR            1.95
Net financial liabilities                                       in MEUR          2,751.8   Discount of share price to diluted NAV per share      in %          42.9%
Cash and cash equivalents                                       in MEUR           795.2    Number of shares                                               975,955,651
Loan to value ratio (net)                                          in %           46.2%    Number of treasury shares                                       10,000,000
Gearing                                                            in %           89.1%    Market capitalisation at end of period             in MEUR         1,901.2
Average interest rate on financial liabilities, incl. hedging      in %            3.9%    Earnings per share                                  in EUR            0.02
Average term of financial liabilities                           in years             3.8   Earnings per share (diluted)                        in EUR            0.02

EPRA INDICATORS                                                            31 JULY 2016    EARNINGS DATA                                                   Q1 2016A
EPRA Net Asset Value                                            in MEUR          3,297.6   Rental income                                      in MEUR            76.8
EPRA Net Asset Value per share                                   in EUR            3.41    Results of asset management                        in MEUR            54.5

EPRA Triple Net Asset Value                                     in MEUR          3,195.6   Results of property sales                          in MEUR             0.7
                                                                                           Results of property development                    in MEUR            -1.4
EPRA Triple Net Asset Value per share                            in EUR            3.31
                                                                                           Results of operations                              in MEUR            45.3
                                                                                           Revaluations                                       in MEUR            -8.6
EPRA earnings                                                    in EUR            46.3
                                                                                           EBIT                                               in MEUR            32.8
EPRA earnings per share                                          in EUR            0.05
                                                                                           Financial results                                  in MEUR            10.9
EPRA earnings after                                             in MEUR            36.5
company-specific adjustments                                                               EBT                                                in MEUR            43.7
EPRA earnings per share after                                    in EUR            0.04    Net profit or loss                                 in MEUR            21.9
company-specific adjustments                                                               FFO 1 (excl. results of property sales)            in MEUR             9.3
EPRA Net Initial Yield                                             in %            5.3%    FFO 2 (incl. results of property sales)            in MEUR            10.0

                                                                                                                                                             Q1 2016A – 4
As of: 10/2016 - Immofinanz
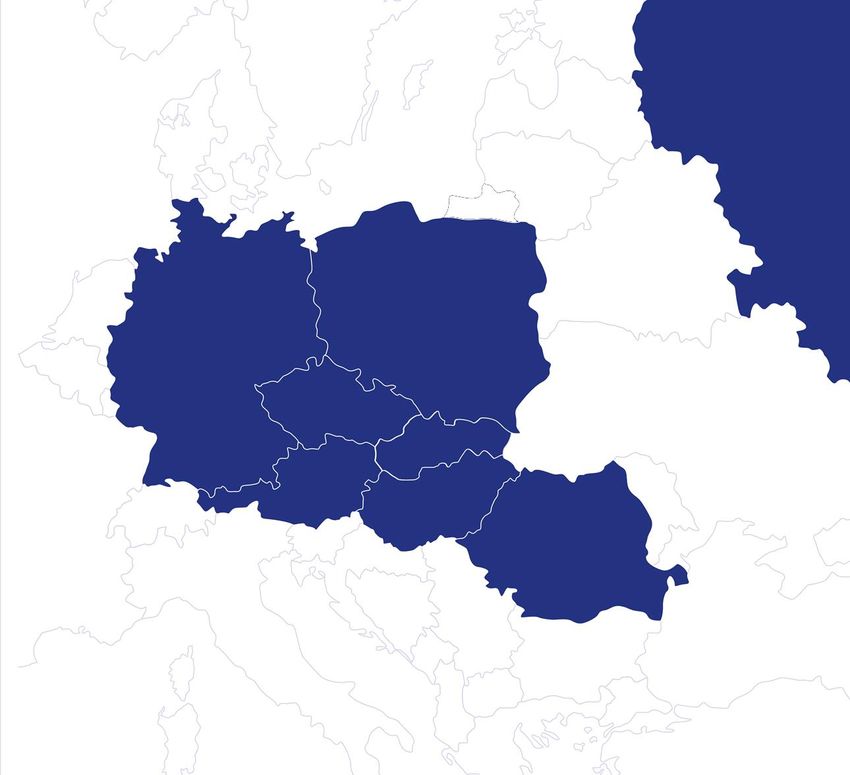
FY 2015/16 – STRATEGIC HIGHLIGHTS
            DISPOSAL OF LOGISTICS PORTFOLIO
             Sale to Blackstone, cash inflows totalling MEUR 305

                            FOCUS ON TWO ASSET CLASSES
                                      Office               Retail

     FY                           SALE OF BUWOG SHARES
  2015/16                          20 million shares placed on the stock exchange
                                   18.5 million shares sold to the investor SAPINDA
  TARGETS
                            GROWTH THROUGH ACQUISITIONS AND DEVELOPMENTS
                              Completions in retail (VIVO! Stalowa Wola and STOP SHOPs)
                              New development projects in Germany
                              Acquisition of a 26% stake in CA Immo

            SUSTAINABLE DIVIDEND POLICY
             Dividend of 6 cents per share decided for 2015/16 and planned for 2016

                                                                                          Q1 2016A – 5
As of: 10/2016 - Immofinanz
FY 2015/16 – OPERATIONAL HIGHLIGHTS
OFFICE RENTALS
                                                Developments                                          New rentals
                                 81.7%           106,000 sqm                                          215,000 sqm
          75.0%
                     +6.7 Pp                                            Total                                               Total
                                                                     421,000 sqm                                         421,000 sqm
                                                                                       Standing                                         Contract
                                                                                       investments                                      extensions
                                                                                       315,000 sqm                                      206,000 sqm
     FY 2014/15                FY 2015/16

                                                RENTABLE                           RENTED               OCCUPANCY                      OCCUPANCY
COUNTRY                                            SPACE                            SPACE                FY 2015/16                     FY 2014/15
Austria                                            354,652                          292,500                      82.5%                       78.5%
Germany                                             56,956                           47,683                      83.7%                       58.0%
Czech Republic                                     146,652                          104,258                      71.1%                       74.2%
Hungary                                            165,785                          131,222                      79.2%                       72.3%
Poland                                             162,063                          143,271                      88.4%                       75.9%
Romania                                            188,748                          166,693                      88.3%                       79.1%
Non-core countries                                  25,638                           13,949                      54.4%                       50.7%
IMMOFINANZ                                       1,100,494                          899,575                      81.7%                       75.0%

                                            RANKING          COUNTRY                  BUILDING                       TENANT                  SQM
                                            1                 Germany                         FLOAT                      Uniper              28,000
                                            2                 Germany                      trivago                       trivago             26,000
LARGEST NEW RENTALS:                        3                   Austria    Geiselbergstrasse 17-19      ibis acam Bildungs GmbH              11,200
                                            4                  Romania                        IRIDE            Local TV provider              9,100
                                            5                 Germany                  Panta Rhei               GEA Real Estate               3,600

                                                                                                                                           Q1 2016A – 6
As of: 10/2016 - Immofinanz
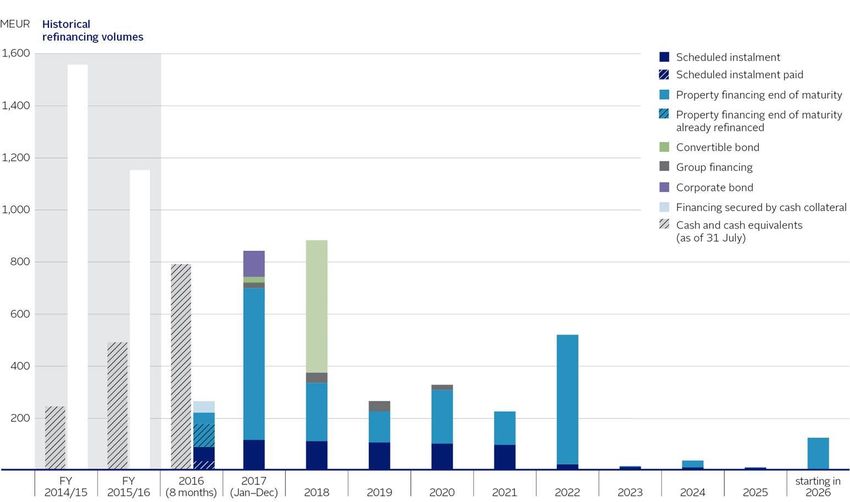
2016 FINANCIAL YEAR – OUTLOOK

            FURTHER PORTFOLIO GROWTH WITH OUR BRANDS

                      FURTHER INCREASE IN OCCUPANCY RATE

     FY
    2016                 PORTFOLIO OPTIMISATION

  TARGETS
                      COST REDUCTIONS

            PLANNED MERGER OF IMMOFINANZ AND CA IMMO

                                                           Q1 2016A – 7
As of: 10/2016 - Immofinanz
PORTFOLIO GROWTH OFFICE
HIGH PRELETTING RATES IN GERMANY
> IMMOFINANZ’s future portfolio in Germany will include premium properties
    in Düsseldorf, Cologne and Aachen
> Construction of corporate headquarters for trivago and Uniper in the Düsseldorfer
    Medienhafen
> Construction of the largest technology cluster within the RWTH Aachen expansion
> Planned development of the German office portfolio:                                                      trivago, Düsseldorf (GER)

RENTABLE SPACE                                    CARRYING AMOUNT                         RENTAL INCOME
in sqm                                            in MEUR                                 in MEUR, p.a.
                            ~192,000                                         ~760.2                                     ~37.0
                    +237%                                           +459%                                  +478%
        ~57,000
                                                         135.9                                    6.4

      FY 2015/16            Mid 2018                   FY 2015/16           Mid 2018          FY 2015/16              Mid 2018

LARGEST PROJECTS                         PRIMARY         PLANNED RENTABLE SPACE        PRELETTING RATE     SCHEDULED COMPLETION
IN GERMANY                                   USE              IN SQM (ROUNDED)                     IN %       (CALENDAR QUARTER)
Gerling Quartier                        Office/Hotel                        30,000                 73%             Q4 2016 to Q1 2018
FLOAT                                         Office                        30,000                 95%                       Q3 2018
RWTH Aachen                                   Office                        28,000                 90%                       Q2 2017
trivago1                                      Office                        26,000                100%                       Q3 2018

1 Project phase I
                                                                                                                             Q1 2016A – 8
As of: 10/2016 - Immofinanz
BRANDS OF IMMOFINANZ

                                          RETAIL                                                             OFFICE

STOP SHOP is our brand for retail parks in   VIVO! is our shopping center brand.            myhive is the new office brand of
Central and Eastern Europe.                                                                 IMMOFINANZ.

These likeable and convenient local          It is designed for cities with a catchment     myhive offices stand for the friendly and
suppliers are located in catchment           area of at least 200,000 residents and         lively atmosphere experienced in a hotel,
areas of 30,000 to 150,000 residents         highlighted by strong anchor tenants and       combined with optimal infrastructure and
and offer a broad range of products          an attractive mix. VIVO! makes shopping a      services. The buildings are characterised by
with good value for money.                   special experience for the entire family.      an inviting and lively atmosphere, attentive
With efficient transport connections         These shopping centers are normally            and helpful staff, easy accessibility and
as well as extensive parking, they           single-storey, have a high recognition value   numerous services, like shops for everyday
concentrate on price-conscious “smart        and are therefore optimally suited for         needs, flexible and serviced offices, tenant
shoppers” who value easy accessibility.      further growth.                                lounges and interesting events.

                                                                                                                                     Q1 2016A – 9
As of: 10/2016 - Immofinanz
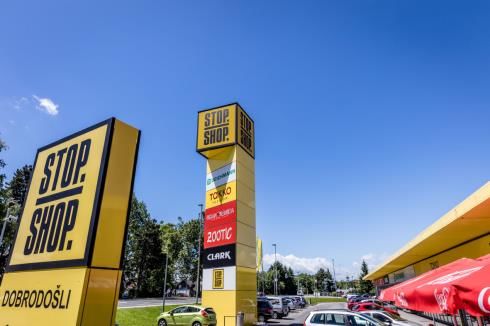
PORTFOLIO GROWTH: STOP SHOP
 581 LOCATIONS IN SEVEN COUNTRIES
> STOP SHOP Serbia:
  3rd location in
  this country opened
  in Valjevo during
  early autumn 2016                                                           55 OBJECTS AS OF 31 JULY 2016
                                                           POLAND1            Rentable space                         367,295 sqm
> STOP SHOP Poland:
                                                                              Occupancy rate                                 95.7%
  Preparation and
  evaluation of five                                                          Carrying amount                         MEUR 517.1
  further locations,                                                          Gross return                                     7.5%
  including the cities of                                                     Gross return (occupancy adj.)                    7.8%
  Pultusk and Gdynia –
  completion in 2017                      CZECH REPUBLIC

> Doubling of the
                                                               SLOVAKIA
  STOP SHOP portfolio
  to more than 100 locations
  over the next five years
                                      AUSTRIA
                                                           HUNGARY

                               SLOVENIA

                                                                     SERBIA

                                                                                  1 Including Swinoujscie, Sczyztno and Valjevo, which
                                                                                    opened after the balance sheet date

                                                                                                                     Q1 2016A – 10
PORTFOLIO GROWTH: VIVO!
   BRAND ROLL-OUT TO FURTHER LOCATIONS
> Roll-out of VIVO! brand to
   existing shopping centers
   currently in progress
> Start of construction works                                  10 OBJECTS AS OF 31 JULY 2016
   for VIVO! Krosno (PL)                                       Rentable space                  284,778 sqm
> Further development                            POLAND        Occupancy rate                       94.6%
   projects and acquisitions                                   Carrying amount                 MEUR 609.0
   under evaluation                                            Gross return                          6.9%
                                                               Gross return (occupancy adj.)         7.3%

                                CZECH REPUBLIC
                                                   SLOVAKIA

                                                              ROMANIA

                                                                                               Q1 2016A – 11
OFFICE: ROLL-OUT OF MYHIVE
 NEW OFFICE CONCEPT INCLUDING 360° CUSTOMER CARE
> International brand concept –
   myhive stands for a strong
   commitment to quality and
   services
                                                                          POLAND                                                  15 OBJECTS AS OF 31 JULY 2016
> First step involves the                                                                                                         Rentable space                                             388.878 sqm
   roll-out of myhive to                                                     Warsaw
                                             GERMANY                                                                              Occupancy rate                                                          83.2%
   20 IMMOFINANZ
   office buildings1 in                                                                                                           Carrying amount                                             MEUR 862.1
   six countries                   Cologne                                                                                        Gross return                                                              5.2%
                                                                                                                                  Gross return (occupancy adj.)                                             6.3%
> Twin Towers in Vienna                                     Prague
   will be relaunched
                                                       CZECH REPUBLIC
   under the myhive
   brand by the end of 2016
> Only capital cities and larger                         Vienna
   office cities in Germany
                                                       AUSTRIA                            Budapest

                                                                        HUNGARY
                                                                                                                           ROMANIA

                                                                                                                                                    Bucharest

                                                                     1 20 properties, including 15 standing investments will be branded as myhive. Two of these standing investments are not listed separately
                                                                     because they are part of the IRIDE Business Park. The other three properties are classified as development projects.

                                                                                                                                                                                             Q1 2016A – 12
INCREASE IN OCCUPANCY RATE

    OCCUPANCY RATE OFFICE                                                                      OCCUPANCY RATE RETAIL
    Values in %                                                                                Values in %

                                                                                                                                                      >95.0
                                                                         >85.0
                                                                                                                                             ~93.0
                                                                                                       92.0           -0.9 Pp
                               6.7 Pp         81.7                                                                                91.1
                75.0                                                                                                                                  Excl.
                                                                                                                                              Incl.    RU
                                                                                                                                               RU

           FY 2014/15                     FY 2015/16                 Forecast end                   FY 2014/15                  FY 2015/16   Forecast end
                                                                       FY 2016                                                                 FY 2016

                                                       OCCUPANCY RATE TOTAL
                                                       Values in %

                                                                                                                       ~90.0
                                                                                                             >88.0

                                                                            2.1 Pp      86.3
                                                                  84.2                                                 Excl.
                                                                                                              Incl.
                                                                                                                        RU
                                                                                                               RU

                                                              FY 2014/15             FY 2015/16              Forecast end
                                                                                                               FY 2016

Assumption: no change in occupancy rate for “Other” asset class
                                                                                                                                                        Q1 2016A – 13
MEDIUM-TERM PORTFOLIO OPTIMISATION

                                                                                         Total
PLANNED SALES BY ASSET CLASS                                                            MEUR
In MEUR as of 30 April 2016
                                                                                       ~1,000.0

 ~560.0                                           ~320.0                      ~120.0
 Office                                           Retail                      Others

PLANNED SALES BY PROPERTY TYPE
In MEUR as of 30 April 2016

 ~800.0                                                              ~200.0
 Buildings                                                           Landbanks

 > Proceeds will finance development activities & portfolio growth

                                                                                          Q1 2016A – 14
COST REDUCTIONS

    REFINANCING
    In MEUR
                                                                          Current
                                                                          bonds as of                      Ø 4.40%     MEUR
                                                                          30.4.2016
                                                            Nominal                                        Interest    27.7          Interest
                                                             value                                                                    savings    Savings
                                                             MEUR                                                                     MEUR      MEUR ~11.0
                                                             628.5                                        Ø 2.60%1     MEUR            11.4
                                                                          Refinancing
                                                                          of bonds after                  Interest     16.3
                                                                          redemption

    PERSONNEL COSTS
    In MEUR
                                                                              50.0
                                                                                                                            41.0
                                                                                                 -18.0%                                          Savings
                                                                                                                                                MEUR ~9.0

                                                                         FY 2015/16                                Future annual forecast

1 Provision of Ø 2.60% coupon based on Ø 5y SWAP as of July 2016 (-0.15) plus a spread of 2.75 (bank indication)
                                                                                                                                                    Q1 2016A – 15
COMBINATION OF IMMOFINANZ AND CA IMMO

         > Acquisition of a 26% stake in CA Immo
  Step     > Merger control clearance received
   1       > Recording of registered shares and closing of acquisition
             executed in August

         > Disposal/spin-off of our Russian portfolio
  Step
           > Spin-off to existing IMMOFINANZ shareholders or disposal to a third party
   2       > Preparations in progress

         > Merger of IMMOFINANZ and CA Immo
  Step     > Start of detailed negotiations about merger after closing of the
             acquisition of the 26% stake
   3       > Invitation to shareholder meetings that have to approve the merger
             planned for summer 2017

                                                                                  Q1 2016A – 16
CONTENT
01 IMMOFINANZ at a Glance & Strategy

02 Combination of IMMOFINANZ and CA Immo

03 Portfolio

04 Financing

05 Q1 2016A Results

06 Appendix

                                           Q1 2016A – 17
Merger update

October 2016
The combination of IMMOFINANZ and CA Immo –
a strategically compelling and value enhancing combination

                                                                                                                                                                                   Pro-forma data as of Sep-2016

                                                    1       Creating a leading commercial real estate company in Europe                                                                        €6.2bn
                                                                                                                                                                                          portfolio value(a)

                                                            Regionally balanced portfolio with leading positions in Germany, Austria and the
                                                    2       main CEE markets, benefitting from strong macro conditions
                                                                                                                                                                                     41% DE/AT vs 59% CEE
                                                                                                                                                                                     73% office vs 23% retail(b)

                                                            High quality, recently built unique German office portfolio with strong development                                    c.€1.5-2.0bn(e) of development
                                                    3       capability and sizeable German landbank
                                                                                                                                                                                      pipeline, predominantly
                                                                                                                                                                                   focused on Germany (c. 75%)

                                                                                                                                                                                        €33mm p.a. pre-tax
                                                    4       Synergetic combination driven through revenue, cost and financing synergies                                             run-rate synergies(c) initially
                                                                                                                                                                                    assessed by IMMOFINANZ,
                                                                                                                                                                                       joint analysis initiated

                                                    5       Enhanced scale and diversity to improve credit profile, aiming to reach investment                                           Targeted range of
                                                            grade rating for combined entity                                                                                              40-45% net LTV

                                                    6       Highly liquid and investable stock with re-rating potential                                                             €2.8bn combined free-float
                                                                                                                                                                                      market capitalisation(d)

Note: Pro-forma data as per September 2016: Q1-16 for IMMOFINANZ and Q2-16 for CA Immo
(a) Including CA Immo at-equity investments, excluding development
(b) Differential of approx five percentage points belongs to ‘Other’ segment (comprises all other business activities that cannot be allocated to the office or retail segments)
(c) Synergies announced by IMMOFINANZ in April 2016 currently under joint review
(d) As of 30-Sep-16, not reflecting a potential impact on market cap of the envisioned Russian disposal from IMMOFINANZ portfolio
(e) Includes landbank for CA Immo and outstanding development costs for both IMMOFINANZ and CA Immo
Source: IMMOFINANZ and CA Immo company information, Bloomberg

                                                                                                                            19
The combination between IMMOFINANZ and CA Immo, planned to be
completed by H2 2017, provides an attractive opportunity of creating a
European leader in commercial real estate

                           2016                                                                  2017

Step 1                               Step 2                            Step 3

 Acquisition of a 26% stake in CA    Disposal/spin-off of             Merger of IMMOFINANZ and CA Immo
  Immobilien Anlagen AG by             IMMOFINANZ Russian portfolio
  IMMOFINANZ AG                                                         Preparations for merger have started
                                      Spin-off to existing
 Antitrust approvals obtained         IMMOFINANZ shareholders or       Statutory merger according to Austrian law
                                       sale to a third party buyer          Exchange ratio based on broad range of customary valuation
 Recording of registered shares                                              methodologies
  and closing of acquisition          Execution in progress: to be         Exchange ratio review by auditor
  executed in August                   completed prior to merger            Merger document and exchange ratio to be published approx. 1
                                                                              month ahead of General Meetings

                                                                                   General Meetings resolving on merger
                                                Ongoing
                                                                                         planned in Summer 2017

                                                                      20
The proposed statutory merger is an opportunity to combine two highly
   complementary portfolios and implement best-in-class corporate governance
                                             Corporate structure                                                                       Structure and governance

                 Shareholders                                                  Shareholders
                                                                                                                      Statutory merger of the two entities
                                74%                                                         94%
                                                           26%
                                                                                                                      IMMOFINANZ exit from Russia prior to the respective
                     CA Immo                                                   IMMOFINANZ                              general meetings
                                                             6%

        Austria                                                        Austria                                      The exchange ratio will be determined by reference to a
        Germany                                                        Germany                                       broad range of customary valuation methodologies
        Poland                                                         Poland
        Romania                                                        Romania
        Czech Republic                                                 Czech Republic                               75% shareholder approval required in both AGMs/EGMs
        Hungary                                                        Hungary
        Other countries(a)                                             Other countries(b)
                                                                        Russia (sale or spin-off pre merger)
                                                                                                                      Details of the structure will be developed by both parties in
                                                                                                                       the best economic interest for the shareholders, including
                                                                                                                       tax considerations

                                                 Shareholders
                                                                                                                      Combined company to operate under a new name
                                                               100%
                                                                                                                      Best-in-class corporate governance
                                                     MergeCo

                                      Austria               Czech Republic
                                      Germany               Hungary
                                      Poland                Other countries(c)
                                      Romania

Source: CA Immo and IMMOFINANZ company information
(a) Slovakia, Slovenia, Serbia, Croatia, Bulgaria
(b) Slovakia, Slovenia, Serbia, Croatia, Bulgaria, Ukraine, Turkey
(c) Slovakia, Slovenia, Serbia, Croatia, Bulgaria, Ukraine, Turkey

                                                                                                                21
Regionally balanced portfolio with leading positions in Germany, Austria and
the main CEE markets, benefitting from strong macro conditions

  Regional distribution (standing assets)                                                                                 Asset classes (standing assets)

                                               Others(a) 8%                                                                                               Others(b) 5%
                          Czech
                       Republic 11%                                  Austria 26%
                                                                                                                                            Retail 23%

                  Hungary 12%
                                                                                                                                                                                 Office 73%
                                                                         Germany
                        Poland 14%                                         15%

                                                           Romania 14%
                                             Total: €6,248m                                                                                               Total: €6,248m

GDP and prime office rental growth per country (%)

Country                                                               2016E GDP growth (%)(c)                                                                Prime office rental growth (%)(c,d)
Austria                                                                                         1.3%                                                                             Vienna, 1.9%

Germany                                                                                         1.4%                                                                              Berlin, 8.9%

Czech Republic                                                                                  2.2%                                                                             Prague, 2.6%

Hungary                                                                                         1.2%                                                                          Budapest, 5.0%

Poland                                                                                          2.9%                                                                           Warsaw (3.0)%

Romania                                                                                         4.2%                                                                          Bucharest, 0.0%

Note: Portfolio including CA Immo pro-rata share of at-equity investments, excluding development and pipeline projects and IMMOFINANZ Russia properties
(a) Bulgaria, Croatia, Serbia, Slovakia, Slovenia, Turkey, Ukraine
(b) Comprises all other business activities that cannot be allocated to the office or retail segments
(c) Data as per EIU
(d) as of March 2016, one-year growth, Bucharest as of Sep 2015
Source: Data as of 31-Jul-16 for IMMOFINANZ and as of 30-Jun-16 for CA Immo; Cushman & Wakefield

                                                                                                                    22
Significant synergy potential in proposed combination

        Revenue synergies                                                Cost synergies              Financing synergies

   Potential additional                                        Reduction of corporate            Reduced financing costs
    acquisition opportunities                                    overheads                          through enlarged
    (better visibility in the                                                                       platform and stronger
    market)                                                     Combination of asset               balance sheet
                                                                 management platforms
   Coordinated letting                                          (as well as country hubs)         Targeted investment
    activities, in particular in                                                                    grade rating of combined       Initial assessment by
                                                                Cash savings on                    entity will help to further     IMMOFINANZ: €33mm
         Eastern European                                                                          improve access to capital
                                                                 maintenance and capex                                              p.a. total run-rate
          capitals lead to                                                                          and will reduce funding         synergy potential(a)
                                                                 from increased
          vacancy reduction                                                                         costs
                                                                 purchasing power and
          and lease up                                                                                                             Joint analysis of
                                                                 improved procurement
          potential                                                                                                                 synergies initiated
                                                                 organisation                      Higher free float and
         #1 “go to” provider of                                                                    trading volume levels of
          class A office space                                  Reduced letting costs              combined entity expected
                                                                 due to better terms with           to reduce cost of equity
                                                                 brokers

(a) Synergies announced by IMMOFINANZ in April 2016 currently under joint review

                                                                                             23
Creating a leading commercial Real Estate company in Europe and the clear
market leader in CEE

Largest listed Continental Europe commercial Real Estate companies                                                                                               Largest listed European commercial Real Estate companies with CEE
by GAV (Total GAV(a), €bn, latest available)                                                                                                                     portfolio by GAV (CEE GAV(a), €bn, latest available)
 33.8

                                                                                                        Largest listed European                                     3,7                                                                       Largest portfolio in CEE (excl.
                                                                                                             commercial real estate                                                       3,5                                                        Russia) vs relevant peers
                                                                                                             company not focused on UK,
                                                                                                             France or Switzerland
                     19,4

                                                                                                                                                                                                              2,6
                                                                                                                                                                                                                       2,3
                                 12,5

                                          11,7

                                                                                                                                                                                                                                    1,4
                                                 8,5

                                                                                                                                                                                                                                               1,2
                                                                                                                                                                                                                                                            1,1
                                                         6,2

                                                                              5,4

                                                                                                                                                                                                                                                                     0,7
                                                                                    3,4

                                                                                                 3,4

                                                                                                        3,4

                                                                                                                  2,8

                                                                                                                            2,6

                                                                                                                                                                                                                                                                                 0,4
                                                                                                                                     2,1

                                                                                                                                              1,8

                                                                                                                                                          1,1

                                                                                                                                                                                                                                                                      S Immo
                                                                                                                                                                                                                                    CA Immo
                                                                                                                                                                                                              Atrium

                                                                                                                                                                                                                                                             GTC
                                                                                                                                                                                                                       IMMOFINANZ

                                                                                                                                                                                                                                                Klepierre

                                                                                                                                                                                                                                                                                 Segro
                                                                                                                                                                     Pro forma CAI & IF

                                                                                                                                                                                          Unibail - Rodamco
                                                                                                        Alstria
                                                                              SFL

                                                                                                                                     S Immo
                                                                                                                  CA Immo
                                                                                    IMMOFINANZ
                                          FdR

                                                                                                 DES

                                                                                                                            Atrium

                                                                                                                                                          GTC
                     Klepierre

                                 Gecina

                                                 Icade

                                                         Pro forma CAI & IF

                                                                                                                                              DIC Asset
 Unibail - Rodamco

Note: Ranking as per last reported GAVs; CA Immo including pro-rata share of at-equity investments; IMMOFINANZ figures exclude Russian properties, GAV including Russia is €4.6 billion; Alstria incl
Deutsche Office; DES has exposure to CEE region via Galeria Baltycka in Gdansk (Poland) and Árkád in Pécs (Hungary), DES CEE GAV na
(a) GAV of investment property/standing assets excl. development
Source: IMMOFINANZ and CA Immo company information, Latest company information of peers

                                                                                                                                                                24
Among the leaders in the major German office markets with strong combined
development capabilities

Geographic breakdown of development pipeline (a)                                                                       Complementary development capabilities

                                                                                                                          Existing landbank reserves secures organic growth strategy over the next decade

             CA Immo                                                                                                      Both companies with successful track record of project development for own use
    Others
                                                                                                                           or disposal to third parties
    ~16%
                                                                                                                          With a combined development pipeline of c. €1.5-2.0 billion with a strong focus on
                                                                                                                           the key European market Germany, the high quality pipeline value will be a
                                                                                                                           significant driver of future stable growth

                           Germany
                            ~84%                              CA Immo + IMMOFINANZ                                    CA Immo
                                                                   Others                                                 High quality landbank of >€300mm in Germany with estimated potential of
                                                                   ~25%
                                                                                                                           c.€2bn valuation when fully developed

                                                                                                                          Focus on office project development in Germany (e.g. Tower One in Frankfurt,
                                                                                                                           Cube in Berlin, Nymphenburg and Neo in Munich)

                                                                                        Germany                       IMMOFINANZ
                                                                                         ~75%
          IMMOFINANZ                                                                                                      Focus on office project development in Germany and retail products /
                                                                                                                           STOP.SHOP & VIVO! in other core countries; significant land bank to use for
    Others                      Germany                                                                                    project development
    ~31%                         ~69%

                                                                                                                      Combined

                                                                                                                          Significant development activities in key growth regions in Germany (Berlin,
                                                                                                                           Cologne, Dusseldorf, Frankfurt and Munich)(b)

Note: IMMOFINANZ excluding pipeline projects and Russia development; figures as of 31-Jul-16 for IMMOFINANZ and 30-Jun-16 for CA Immo
(a) Value of CA Immo development pipeline of approximately €700million (inclusive of landbank and estimated development costs but not including equity accounted development projects) and for IMMOFINANZ of approximately €900
million (inclusive of outstanding development costs) (b) Additional development activities in Germany are in Aachen, Mainz and Regensburg
Source: IMMOFINANZ and CA Immo company information

                                                                                                                25
Highly liquid and investable stock with re-rating potential

  Highly liquid…                                                                                                                                                                                                           …with significant re-rating potential

                                              Daily trading volume CEE players (6m ADTV, €mm)                                                                                                                                                         Re-rating potential to peer group average

                                                                                                                                                                                                        Relative level
        0.34%                                          0.34%                                  0.30%                         0.11%                             0.10%                     0.18%
                                                                                                                                                                                                        of liquidity (a)         Current and
                                                                                                                                                                                                                              potential discount     (34.8%)   (13.0%)         (38.8%) (13.0%)            (37.1%)   (13.0%)
                  8,7                                                                                                                                                                                                            to NAV (%)
                                                                                                                                                                                                                             Current and potential
                                                                                                                                                                                                                             market capitalization
                                                         5,3                                                                                                                                                                        (€mm)
                                                                                                                                                                                                                                                                                                               5,001
                                                                                                      3,4                                                                                                                             5.000

                                                                                                                                    0,7                             0,5                               0,5                                                                           Combined re-
                                                                                                                                                                                                                                      4.500
                                                                                                                                                                                                                                                                                   rating potential

                                                                                                                                                                      S Immo
                                                                                                      CA Immo

                                                                                                                                           Atrium

                                                                                                                                                                                                      GTC
                IMMOFINANZ & CA

                                                          IMMOFINANZ

                                                                                                                                                                                                                                                                                       of 38.4%
                                                                                                                                                                                                                                      4.000
                                                                                                                                                                                                                                                                                                               3.615
                     Immo

                                                                                                                                                                                                                                      3.500

                                                                                                                                                                                                                                      3.000                                         2,870

                                                                                                                                                                                                                                      2.500
  … and investable stock…                                                                                                                                                                                                                                 2,131
                                                                                                                                                                                                                                                                                    2.019
      Continental European commercial Real Estate (free float market cap, €bn)                                                                                                                                                        2.000
                                                                                                                                                                                                                                                          1.596
        23.6

                                                                                                                                                                                                                                      1.500
                                  10,1

                                                                                                                                                                                                                                      1.000
                                              4,7

                                                          3,7

                                                                       2,8

                                                                                              2,4

                                                                                                           1,8

                                                                                                                  1,7

                                                                                                                              1,6

                                                                                                                                                    1,2

                                                                                                                                                              1,2

                                                                                                                                                                      0,7

                                                                                                                                                                               0,5

                                                                                                                                                                                          0,4

                                                                                                                                                                                                        0,4

                                                                                                                                                                                                               0,2

                                                                                                                                                                                                                                        500
                                                                                                                                                                                                               SFL
                                                                                                                                                                               S Immo
                                                          FdR

                                                                                                                                                    CA Immo
                                                                                                            DES

                                                                                                                                                                      Atrium

                                                                                                                                                                                                        GTC
                                  Klepierre

                                                                                                                              IMMOFINANZ
                                              Gecina

                                                                                              Icade

                                                                                                                                                              TLG
                                                                                                                  alstria

                                                                                                                                                                                          DIC Asset
        Unibail - Rodamco

                                                                       IMMOFINANZ & CA Immo

                                                                                                                                                                                                                                           -
                                                                                                                                                                                                                                                        CA Immo                IMMOFINANZ                  CA Immo +
                                                                                                                                                                                                                                                                                                          IMMOFINANZ

                                                                                                                                                                                                                             Note: Re-rating potential represents an indication in a potential scenario of closing discount gap between
Note: 6M ADTV and relative liquidity based on all European trading platforms (as per Bloomberg). Not reflecting a                                                                                                            peers and a combined entity and is not meant to be a valuation; Calculated based on the simple average of
potential impact of the spin-off of IMMOFINANZ Russian portfolio                                                                                                                                                             peer group consisting relevant German, Austrian and CEE peers (IMMOFINANZ, CA Immo, alstria, Atrium,
(a) Calculated as average daily trading volume /free float (in shares); Source: Bloomberg, Factset as of 30-Sep-16,                                                                                                          DES, DIC Asset, GTC, S Immo, TLG). Not reflecting a potential impact of the spin-off of IMMOFINANZ
Company information                                                                                                                                                                                                          Russian portfolio;

                                                                                                                                                                                                                     26
CONTENT
01 IMMOFINANZ at a Glance & Strategy

02 Combination of IMMOFINANZ and CA Immo

03 Portfolio

04 Financing

05 Q1 2016A Results

06 Appendix

                                           Q1 2016A – 27
PROPERTY PORTFOLIO
                                                                  STANDING             DEVELOPMENT               REAL ESTATE     PIPELINE       PROPERTY      PROPERTY
DATA                                     NUMBER OF             INVESTMENTS                 PROJECTS             INVENTORIES     PROJECTS       PORTFOLIO     PORTFOLIO
AS OF 31 JULY 2016                       PROPERTIES                IN MEUR                  IN MEUR                 IN MEUR      IN MEUR         IN MEUR          IN %
Austria                                              138                 1,035.8                      35.0                0.3        11.4          1,082.5       20.0%
Germany                                               23                    83.7                     263.7               91.5         0.0            439.0        8.1%
Czech Republic                                         24                  398.5                      21.5                0.0        25.7           445.7         8.2%
Hungary                                                32                  441.9                       3.2                0.0        31.9           477.0         8.8%
Poland                                                 28                  589.1                      12.7               12.9         4.0           618.7        11.4%
Romania                                                75                  636.4                      33.2                2.8      175.8            848.2        15.7%
Russia                                                  6                1,152.2                       0.0                0.0         4.2          1,156.4       21.4%
Slovakia                                               17                  166.3                      44.9                0.0        10.0           221.2         4.1%
Non-core    countries1                                 18                    94.8                      8.5                0.2        13.0           116.4         2.2%
IMMOFINANZ                                           361                 4,598.7                     422.8              107.7      275.9           5,405.0      100.0%
                                                                          85.1%                      7.8%               2.0%        5.1%           100.0%

 85.1%                                                                         7.8%                          71.7%                                  28.3%
 Standing investments                                    Development projects                                Eastern Europe                 Western Europe

                                                                                       5.1%
                                                                        Pipeline projects

                                                                                           2.0%
                                                                    Real estate inventories

1 In declining order based on the carrying amount: Slovenia, Serbia, Croatia, Bulgaria and Ukraine
                                                                                                                                                              Q1 2016A – 28
STANDING INVESTMENTS
DATA                                                    NUMBER OF              CARRYING AMOUNT                      CARRYING AMOUNT      RENTABLE SPACE                         RENTED SPACE                     OCCUPANCY RATE
AS OF 31 JULY 2016                                      PROPERTIES                      IN MEUR                                 IN %            IN SQM                                IN SQM                                IN %
Austria                                                               131                           1,035.8                     22.5%            539,903                                   463,769                                  85.9%
Germany                                                                 5                              83.7                      1.8%             34,062                                    27,092                                  79.5%
Czech Republic                                                         21                             398.5                      8.7%            252,251                                   209,405                                  83.0%
Hungary                                                                25                             441.9                      9.6%            290,933                                   249,647                                  85.8%
Poland                                                                 18                             589.1                     12.8%            281,005                                   255,570                                  90.9%
Romania                                                                19                             636.4                     13.8%            344,978                                   312,391                                  90.6%
Russia                                                                  5                           1,152.2                     25.1%            278,446                                   225,580                                  81.0%
Slovakia                                                               12                             166.3                      3.6%             90,823                                    89,207                                  98.2%
Non-core countries                                                     10                              94.8                      2.1%             75,574                                    58,667                                  77.6%
IMMOFINANZ                                                            246                           4,598.7                    100.0%          2,187,976                                 1,891,327                                  86.4%

DATA                                            RENTAL INCOME                          GROSS RETURN                 CARRYING AMOUNT          FINANCING                  FINANCING COSTS                                                   LTV
AS OF 31 JULY 2016                           Q1 2016A IN MEUR1                                  IN %                FINANCING IN MEUR       COSTS IN %2           INCL. DERIVATIVES IN %                                                 IN %
Austria                                                              14.7                      5.7% (6.6%)                       526.1                1.8%                                      2.8%                                50.8%
Germany                                                               0.9                      4.5% (5.7%)                        42.4                1.4%                                      1.6%                                50.7%
Czech Republic                                                        6.1                      6.1% (7.4%)                       141.7                2.1%                                      2.5%                                35.6%
Hungary                                                               6.5                      5.9% (6.9%)                       147.3                1.9%                                      2.2%                                33.3%
Poland                                                                8.5                      5.8% (6.4%)                       371.3                1.9%                                      2.2%                                63.0%
Romania                                                              11.3                      7.1% (7.8%)                       200.2                3.4%                                      4.2%                                31.5%
Russia                                                               18.3                      6.4% (7.9%)                       694.2                7.5%                                      7.5%                                60.2%
Slovakia                                                              3.3                      7.9% (8.0%)                        73.2                3.1%                                      3.6%                                44.0%
Non-core countries                                                    1.8                      7.4% (9.5%)                        40.4                3.2%                                      3.6%                                42.6%
IMMOFINANZ                                                           71.4                      6.2% (7.2%)                     2,236.7                3.8%                                      4.3%                                48.6%
Development projects
and pipeline projects                                                 1.7                                                        309.5                1.8%                                      2.0%
In Q1 2016A:
properties sold or
reported as held for sale                                             3.8                                                          0.0                0.0%                                      0.0%
Investment financing                                                  0.0                                                        122.0                0.7%                                      0.7%
Group financing                                                       0.0                                                        628.3                4.4%                                      4.4%
IMMOFINANZ                                                           76.8                                                      3,296.5                3.5%                                      3.9%
Market value of property
portfolio                                                                                                                                                                                                                          5,405.0
Market value of
BUWOG shares
(10 million shares)                                                                                                                                                                                                                  216.1
Cash and cash equivalents                                                                                                       -795.2
Properties / liabilities held
for sale (asset & share deals)                                                                                                   250.5                                                                                               339.0
IMMOFINANZ                                                                                                                     2,751.8                                                                                              46.2%
1 Rental income based on the primary use of the property (rental income reported in the income statement is based
  on the actual use of the property; marginal differences to the income statement are therefore possible)                                      3 10 million shares multiplied by the stock exchange price of EUR 21.69 on 31 July 2016
2 Financing costs based on nominal outstanding liability                                                                                       Values in brackets = adjusted for occupancy
                                                                                                                                                                                                                             Q1 2016A – 29
ASSET CLASS RETAIL
                                                                                                TENANT MIX – RETAIL,
                                                                                                EXCLUSIVE RUSSIA
                                                 ASSET CLASS RETAIL
                                                                                                                               6.1%
                                                 Number of properties              165                            12.4%        Health 5.4%          5.1%
                                                                                                                  Food         & Beauty Sports      Furniture
                                                 Carrying amount in MEUR       2,420.6
                                                 Rentable space in sqm       1,123,773
                                                 Occupancy rate                  91.2%
                                                 Rental inc. Q1 2016A in MEUR1    41.8
                                                                                                28.9%                      6.2%      5.6%    5.1%                25.3%
                                                 Gross return              6.9% (7.6%)          Fashion                    Elec-     Shoes   Enter-               Other
                                                                                                                           tronics           tainment
1 Rental income based on the primary use of the property
  (rental income reported in the income statement is based on the actual use of the property;
  marginal differences to the income statement are therefore possible)
Values in brackets = adjusted for occupancy
Data as of 31 July 2016

                                                                                                  > Focus on capitals as well as secondary and
                                                                                                     tertiary cities

                                                                                                  > Long-lasting networks with international
                                                                                                     and local retailers

                                                                                                  > Established brand policy: STOP SHOP and VIVO!

                                                                                                  > Focus on optimised tenant mix and inclusion
                                                                                                     of leisure and entertainment alternatives
 Tarasy Zamkowe, Lublin, 38,000 sqm

                                                                                                                                                                Q1 2016A – 30
STANDING INVESTMENTS – THE RETAIL
                                                                                                                                                                                               47.6%
             SECTOR IN THE IMMOFINANZ CORE MARKETS                                                                                                                                               RUSSIA

RUSSIA                            47.6%
Number of properties                     5
Carrying amount in MEUR            1,152.2
Rentable space in sqm             278,446
Occupancy rate                      81.0%
Rental income Q1 2016A (MEUR)1        18.3
Gross return                   6.4% (7.9%)

ROMANIA                           12.4%                                                                                       9.2%
                                                                                                                              POLAND
Number of properties                      5
Carrying amount in MEUR              301.1
Rentable space in sqm             147,329
Occupancy rate                      97.1%
Rental income Q1 2016A (MEUR)1          5.6
Gross return                   7.5% (7.7%)
                                                                                                           5.4%
                                                                                                     CZECH REPUBLIC
POLAND                              9.2%                                                                                                                    IMMOFINANZ                        100.0%
Number of properties                      8                                                                                   6.9%                          Number of properties                     165
Carrying amount in MEUR              222.9                                                                                    SLOVAKIA
                                                                                                                                                            Carrying amount in MEUR              2,420.6
Rentable space in sqm             118,940
Occupancy rate                      91.4%                                                              8.8%                                                 Rentable space in sqm
                                                                                                                                                            Occupancy rate
                                                                                                                                                                                               1,123,773
                                                                                                                                                                                                   91.2%
                                                                                                      AUSTRIA
Rental income Q1 2016A (MEUR)1
Gross return
                                        3.4
                               6.1% (6.7%)
                                                                                                                              7.0%                          Rental income Q1 2016A (MEUR)1
                                                                                                                                                            Gross return
                                                                                                                                                                                                    41.8
                                                                                                                                                                                             6.9% (7.6%)
                                                                                                                              HUNGARY
AUSTRIA                             8.8%
Number of properties                   102    Data as of 31 July 2016
                                                                                                                                                       12.4%
Carrying amount in MEUR              214.0    1 Rental income based on the primary use of the property                                                 ROMANIA
Rentable space in sqm             207,581       (rental income reported in the income statement is based on the actual
Occupancy rate                      93.4%       use of the property; marginal differences to the income statement are
                                                therefore possible)
Rental income Q1 2016A (MEUR)1          4.5   2 Non-core countries: Slovenia and Serbia
Gross return                   8.3% (8.9%)    Values in brackets = adjusted for occupancy

HUNGARY                             7.0% SLOVAKIA                                                 6.9% CZECH REPUBLIC                             5.4%      NON-CORE COUNTRIES2                  2.7%
Number of properties                     13   Number of properties                     12                     Number of properties                     12   Number of properties                        8
Carrying amount in MEUR              169.2    Carrying amount in MEUR              166.3                      Carrying amount in MEUR              130.0    Carrying amount in MEUR                 64.9
Rentable space in sqm             125,099     Rentable space in sqm              90,823                       Rentable space in sqm             105,599     Rentable space in sqm                49,954
Occupancy rate                      92.5%     Occupancy rate                      98.2%                       Occupancy rate                      97.5%     Occupancy rate                        92.3%
Rental income Q1 2016A (MEUR)1          2.9   Rental income Q1 2016A (MEUR)1          3.3                     Rental income Q1 2016A (MEUR)1          2.5   Rental income Q1 2016A (MEUR)1            1.3
Gross return                   6.8% (7.3%)    Gross return                   7.9% (8.0%)                      Gross return                   7.7% (7.9%)    Gross return                     8.3% (9.0%)
                                                                                                                                                                                             Q1 2016A – 31
ASSET CLASS OFFICE
                                                                                                                        Business Park Vienna, 168,500 sqm

                                                 ASSET CLASS OFFICE
                                                 Number of properties               72
                                                 Carrying amount in MEUR       2,163.4
                                                 Rentable space in sqm       1,053,531
                                                 Occupancy rate                  81.6%
                                                 Rental inc. Q1 2016A in MEUR1    29.5
                                                 Gross return              5.5% (6.7%)
1 Rental income based on the primary use of the property
  (rental income reported in the income statement is based on the actual use of the property;
  marginal differences to the income statement are therefore possible)
Values in brackets = adjusted for occupancy
Data as of 31 July 2016

                                                                                                > Focus only on capital cities of our core countries
                                                                                                  and Big-7 cities in Germany

                                                                                                > Overall size and relevant market position ensure
                                                                                                  high flexibility and synergies

                                                                                                > “More than office” concept guarantees high service
                                                                                                  approach

                                                                                                > Increasing occupancy rate:
                                                                                                  refurbishment offensive launched /
                                                                                                  strong sales orientation
 Nimbus, Warsaw, 21,000 sqm

                                                                                                                                                 Q1 2016A – 32
STANDING INVESTMENTS – THE OFFICE
             SECTOR IN THE IMMOFINANZ CORE MARKETS

AUSTRIA                           37.7%                                   3.9%                                               16.9%
                                                                                                                              POLAND
Number of properties                    26                               GERMANY
Carrying amount in MEUR              816.2
Rentable space in sqm             330,566
Occupancy rate                      81.3%
Rental income Q1 2016A (MEUR)1        10.2
Gross return                   5.0% (6.2%)
                                                                                                         12.4%
                                                                                                     CZECH REPUBLIC
POLAND                            16.9%                                                                                                                     IMMOFINANZ                         100.0%
Number of properties                     10                                                                                                                 Number of properties                       72
Carrying amount in MEUR              366.1                                                                                                                  Carrying amount in MEUR               2,163.4
Rentable space in sqm             162,065
Occupancy rate                      90.6%                                                            37.7%                                                  Rentable space in sqm
                                                                                                                                                            Occupancy rate
                                                                                                                                                                                                1,053,531
                                                                                                                                                                                                    81.6%
                                                                                                      AUSTRIA
Rental income Q1 2016A (MEUR)1
Gross return
                                        5.1
                               5.6% (6.1%)
                                                                                                                             12.6%                          Rental income Q1 2016A (MEUR)1
                                                                                                                                                            Gross return2
                                                                                                                                                                                                     29.5
                                                                                                                                                                                              5.5% (6.7%)
                                                                                                                              HUNGARY
ROMANIA                           15.1%
Number of properties                      8   Data as of 31 July 2016
                                              1 Rental income based on the primary use of the property
                                                                                                                                                       15.1%
Carrying amount in MEUR              326.3      (rental income reported in the income statement is based on the actual                                 ROMANIA
Rentable space in sqm             188,732       use of the property; marginal differences to the income statement are
Occupancy rate                      87.1%       therefore possible)
                                              2 Gross return excl. properties used by IMMOFINANZ: 5.3%
Rental income Q1 2016A (MEUR)1          5.6   3 Non-core countries: Croatia and Bulgaria
Gross return                   6.9% (7.9%)    Values in brackets = adjusted for occupancy

HUNGARY                           12.6% CZECH REPUBLIC                                          12.4% GERMANY                                     3.9%      NON-CORE COUNTRIES3                   1.4%
Number of properties                     12   Number of properties                      9                     Number of properties                      5   Number of properties                         2
Carrying amount in MEUR              272.7    Carrying amount in MEUR              268.5                      Carrying amount in MEUR               83.7    Carrying amount in MEUR                  29.9
Rentable space in sqm             165,834     Rentable space in sqm             146,652                       Rentable space in sqm              34,062     Rentable space in sqm                  25,619
Occupancy rate                      80.8%     Occupancy rate                      72.6%                       Occupancy rate                      79.5%     Occupancy rate                          49.0%
Rental income Q1 2016A (MEUR)1          3.6   Rental income Q1 2016A (MEUR)1          3.6                     Rental income Q1 2016A (MEUR)1          0.9   Rental income Q1 2016A (MEUR)1             0.4
Gross return                   5.3% (6.6%)    Gross return                   5.3% (7.4%)                      Gross return                   4.5% (5.7%)    Gross return                     5.5% (11.3%)
                                                                                                                                                                                             Q1 2016A – 33
ACTIVE DEVELOPMENTS
GERMANY1                                        62.4%
Number of properties                                 10
Carrying amount in MEUR                           263.7
Outstanding construction costs in MEUR            280.2
Planned rentable space in sqm                   131,060
Expect. fair value after completion in MEUR       596.0
Expect. rental inc. at full occupancy in MEUR      29.3
Yield on cost in % at full occupancy               5.4%
                2
SLOVAKIA                                        10.6%
Number of properties
Carrying amount in MEUR                            44.9
                                                       2
                                                                      62.4%                                          3.0%
Outstanding construction costs in MEUR             10.6                                                              POLAND
                                                                      GERMANY
Planned rentable space in sqm                    38,518
Expect. fair value after completion in MEUR        55.6
Expect. rental inc. at full occupancy in MEUR        5.5
Yield on cost in % at full occupancy              10.0%
AUSTRIA                                         8.3%                                             5.1%
Number of properties                                   2                                    CZECH REPUBLIC                        IMMOFINANZ                                           100%
Carrying amount in MEUR
Outstanding construction costs in MEUR
                                                   35.0
                                                     0.0
                                                                                                                     10.6%        Number of properties                                      22
Planned rentable space in sqm                    21,691                                                              SLOVAKIA     Carrying amount in MEUR                                422.8
                                                                                                                                  Outstanding construction costs in MEUR                 387.8
Expect. fair value after completion in MEUR
Expect. rental inc. at full occupancy in MEUR
                                                   35.0
                                                     2.4
                                                                                              8.3%                                Planned rentable space in sqm                        307,890
                                                                                             AUSTRIA
Yield on cost in % at full occupancy               6.8%                                                              0.8%         Expect. fair value after completion in MEUR
                                                                                                                                  Expect. rental inc. at full occupancy in MEUR
                                                                                                                                                                                         883.0
                                                                                                                                                                                          54.7
ROMANIA                                         7.8% POLAND                                                3.0%      HUNGARY      Yield on cost in % at full occupancy                    6.8%
Number of properties                                   2   Number of properties                                  3
Carrying amount in MEUR                            33.2    Carrying amount in MEUR                           12.7               7.8%
Outstanding construction costs in MEUR             59.3    Outstanding construction costs in MEUR            28.9               ROMANIA
Planned rentable space in sqm                    57,921    Planned rentable space in sqm                   28,708                                               1 Expansion of an existing
Expect. fair value after completion in MEUR       106.6    Expect. fair value after completion in MEUR       47.3                                                 STOP SHOP
                                                                                                                                                                2 Modernisation of two existing
Expect. rental inc. at full occupancy in MEUR        9.7   Expect. rental inc. at full occupancy in MEUR       3.8                                                office properties
Yield on cost in % at full occupancy              10.5%    Yield on cost in % at full occupancy              9.1%                                               Data as of 31 July 2016
                                                                            1
CZECH REPUBLIC                                  5.1% HUNGARY                                               0.8%                   NON-CORE COUNTRIES                                    2.0%
Number of properties                                   1   Number of properties                                  0                Number of properties                                         2
Carrying amount in MEUR                            21.5    Carrying amount in MEUR                             3.2                Carrying amount in MEUR                                    8.5
Outstanding construction costs in MEUR               8.1   Outstanding construction costs in MEUR              0.0                Outstanding construction costs in MEUR                     0.7
Planned rentable space in sqm                    21,803    Planned rentable space in sqm                    2,081                 Planned rentable space in sqm                           6,108
Expect. fair value after completion in MEUR        29.5    Expect. fair value after completion in MEUR         3.2                Expect. fair value after completion in MEUR                9.8
Expect. rental inc. at full occupancy in MEUR        3.0   Expect. rental inc. at full occupancy in MEUR       0.2                Expect. rental inc. at full occupancy in MEUR              0.8
Yield on cost in % at full occupancy              10.1%    Yield on cost in % at full occupancy              7.2%                 Yield on cost in % at full occupancy                     8.6%
                                                                                                                                                                              Q1 2016A – 34
CONTENT
01 IMMOFINANZ at a Glance & Strategy

02 Combination of IMMOFINANZ and CA Immo

03 Portfolio

04 Financing

05 Q1 2016A Results

06 Appendix

                                           Q1 2016A – 35
FINANCING – MATURITY SCHEDULES
TERM STRUCTURE OF FINANCIAL LIABILITIES BY FINANCIAL YEAR AS OF 31 JULY 2016 IN MEUR

Weighted average interest rate excl. costs for derivatives: 3.55%; Average weighted remaining term: 3.75 years; Net LTV: 46.2%1
1) Net LTV: Total liability less liquid funds in relation to the property value plus the market value of the BUWOG shares

                                                                                                                                  Q1 2016A – 36
FINANCING – STRUCTURE
                                                OUTSTANDING           WEIGHTED
                                                     LIABILITY1 AVERAGE INTEREST                              SHARE OF           SHARE OF                    FIXED                 FLOATING
                                                       IN TEUR        RATE EXCL.                                 FIXED           FLOATING                 INTEREST                  INTEREST
                                            AS OF 31 JULY 2016      DERIVATIVES2                         INTEREST IN %2     INTEREST IN %2                   RATE2                     RATE2

Convertible bonds in EUR                                 528,171.7                        4.23%                 100.00%                0.00%                  4.23%                       n.a.
Corporate bond in EUR                                    100,162.3                        5.25%                 100.00%                0.00%                  5.25%                       n.a.
Bank liabilities in EUR                                2,226,590.6                        2.06%                    4.17%              95.83%                  0.91%                     2.11%
Bank liabilities in CHF                                        260.9                      0.13%                    0.00%            100.00%                        n.a.                 0.13%
Bank liabilities in USD                                  693,983.6                        7.54%                    0.00%            100.00%                        n.a.                 7.54%
IMMOFINANZ                                            3,549,169.0                         3.55%                  20.33%               79.67%                  3.94%                     3.45%

FINANCIAL LIABILITIES
                                                                                                                                                                          6.37%
                                                                                                                                                                          pbb
                                                                                                                                                                          Deutsche Pfandbriefbank
                                                                                                                                                       10.22%
                                                                                                                           19.12%                      Sparkasse             3.65%      9.32%
                                                                                                                           SBERBANK                    KölnBonn              Nordea      Other

 80.44%                                                                  19.55%                             21.56%                        14.60%                8.84%                 2.33%
 Financial liabilities in EUR                          Financial liabilities in USD                         UniCredit                     Raiffeisen            Erste                 HELABA
                                                                                                            Group                         Group                 Group
                                                                                             0.01%                                                                            3.99%
                                                             Financial liabilities in other currencies
                                                                                                                                                                              Aareal Bank Group

1 Including liabilities in discontinued operations and disposal groups
2 Calculation basis: actual remaining debt (nominal amount)
                                                                                                                                                                                      Q1 2016A – 37
BONDS
DATA AS OF                                           CONVERTIBLE BOND 2017                         CONVERTIBLE BOND 2018                             CORPORATE BOND 2017
29 SEPTEMBER 2016                                    ISIN XS0332046043                             ISIN XS0592528870                                 ISIN AT0000A0VDP8
Nominal value                                        MEUR 21.4                                     MEUR 507.1                                        MEUR 100.0
Denomination                                         EUR 100,000                                   EUR 4.12                                          EUR 1,000
Repayment amount                                     EUR 129,670                                   EUR 4.12                                          EUR 1,000
Security / ranking                                   Unsecured, unsubordinated                     Unsecured, unsubordinated                         Unsecured, unsubordinated
Term                                                 19 Nov. 2007 – 19 Nov. 2017                   8 March 2011 – 8 March 2018                       3 July 2012 – 3 July 2017
Coupon                                               1.25%                                         4.25%                                             5.25%
Dividend protection                                  Adjustments to conversion price               Adjustments to conversion price                   n.a.
Quotation1                                           112.00%                                       EUR 4.42                                          102.42%

Adjusted conversion terms…                           1.25% convertible bond 2017                   4.25% convertible bond 2018
… currently applicable calculation method due        One 2017 convertible bond certificate         One 2018 convertible bond certificate (nominal value of EUR 4.12) entitles conversion
to BUWOG spin-off: (including BUWOG 2015             (nominal value of EUR 100,000) entitles       into 1.1573 IMMOFINANZ shares and 0.0629 BUWOG shares. A share price of
dividend)                                            conversion into 12,547.05 IMMOFINANZ          EUR 2.00 (IMMOFINANZ) and EUR 22.00 (BUWOG) corresponds to a share price value
                                                     shares and 691.44 BUWOG shares.               of EUR 3.70.

5.0                                                                          CALCULATION FOR CB 2018 CONVERSION PRICE ADJUSTMENT                                                       BUWOG
                 “In-the-money” line CB 2018                                 REGARDING BUWOG DIVIDEND                                                                                  IN EURO
4.5
                                                                             Number of underlying shares old (per CB)                                                                    0.0606
4.0                                                                          Conversion price new = CP * (M - V) / M                                                                        3.28
                                                                             3.40 * (19.22 – 0.69) / 19.22
3.5                                                                          Number of underlying shares new (per CB)                                                                    0.0629
                                                                             (Number of underlying shares old / (conversion price new / conversion price old) 0.0606 / (3.28 / 3.40)
3.0
                             Market value of underlying shares
2.5                                                                          Input Factor “CP“                           Conversion price old                                              3.40
Jan
 Jan 2014    July 2014
              Jul 2014    Jan
                          Jan 2015
                              2015     July
                                        Jul 2015     Jan
                                                     Jan 2016
                                                         2016    July 2016
                                                                  Jul 2016   Input Factor “M“                            Average market price                                             19.22
                                                                             Input Factor “V“                            Cash dividend                                                     0.69
1 Stock Exchange Frankfurt as of 29 September 2016
                                                                                                                                                                                       Q1 2016A – 38
CONTENT
01 IMMOFINANZ at a Glance & Strategy

02 Combination of IMMOFINANZ and CA Immo

03 Portfolio

04 Financing

05 Q1 2016A Results

06 Appendix

                                           Q1 2016A – 39
P&L Q1 2016A VS. Q1 2015/16
AMOUNTS IN MEUR                                                                    CHANGE      CHANGE      COMMENT
AS OF 31 JULY 2016                                      Q1 2016A    Q1 2015/16    ABSOLUTE        IN %
                                                                                                           1.   Reduction of rental income due to lower
Rental income                                       1        76.8          82.2         -5.4      -6.5%         rental income from Russia (MEUR 18.3
Operating costs charged to tenants                           24.4          22.9          1.4       6.3%         after MEUR 23.7 in Q1 2015/16) and
Other revenues                                                2.2           2.2          0.0      -0.8%         planned property disposals
Revenues                                                    103.4         107.3         -3.9      -3.7%    2.   Higher maintenance costs for the ongoing
                                                                                                                refurbishments were offset by a reduction
Expenses from investment property                   2       -25.5         -32.3          6.8      21.0%
                                                                                                                in the operating costs charged to building
Operating expenses                                          -23.4         -22.5         -0.8      -3.6%
                                                                                                                owners due to a decrease in property-
Results of asset management                                  54.5          52.5          2.0      3.9%
                                                                                                                based tax. Write-off of receivables in
Results of property sales                                     0.7           1.0         -0.4     -34.2%         Russia was substantially lower (MEUR -2.3
Results of property development                              -1.4          -1.9          0.6     30.2%          after MEUR -6.3)
Other operating income                              3         4.1           8.3         -4.3     -51.2%    3.   Positive one-off effect in Q1 2015/16 due
Other operating expenses                                    -12.6         -13.0          0.3       2.6%         to the elimination of tax obligations in
Results of operations                                        45.3          46.9         -1.7      -3.6%         Romania
Revaluation of investment properties adjusted for            -4.4          53.4        -57.7        n.a.   4.   Positive effect in Q1 2015/16 was a result
                                                    4
foreign exchange effects                                                                                        of the acquisition of the city share in our
Revaluation of investment properties resulting               -6.8         184.8       -191.6        n.a.        shopping center GOODZONE
from foreign exchange effects                       5
                                                                                                           5.   Smaller earnings contribution a result of
Goodwill impairment and other revaluation results            -1.4           1.3         -2.6        n.a.
                                                                                                                more stable Ruble development in Q1
Operating profit (EBIT)                                      32.8         286.4       -253.7     -88.6%
                                                                                                           6.   Valuation of derivative instruments
Net financing costs                                         -37.2         -39.9          2.7       6.8%         (MEUR -18.8)
Foreign exchange differences                                 11.9         -93.0       104.8         n.a.   7.   Proportional share of BUWOG earnings
Other financial results                             6       -19.0          10.6        -29.6        n.a.        (MEUR 21.1) and sale of BUWOG shares
Gains/losses from equity-accounted investments      7        55.3          15.5        39.8      >100%          (MEUR 34.1)
Taxes                                                       -20.7         -70.4         49.7     >100%
Net profit for the period from continuing                    23.0         109.2        -86.2     -79.0%
operations
Net profit for the period from discontinued                  -1.1           5.8         -6.9        n.a.
operations
Net profit for the period                                    21.9         115.0        -93.2     -81.0%

                                                                                                                                              Q1 2016A – 40
LIKE-FOR-LIKE – RENTAL INCOME
The like-for-like analysis (i.e. acquisitions, completions and sales in the current quarter are deducted to facilitate a comparison with the previous
quarter) shows the stable development of rental income during the reporting period for a total of MEUR 67.8. The rental income from Russia was
MEUR 0.7 lower than the previous quarter at MEUR 18.3, but was contrasted by a slight increase in Romania.

STANDING INVESTMENTS,                             CARRYING        CARRYING       RENTAL          RENTAL       Q1 2016A
AMOUNTS IN MEUR                  NUMBER OF          AMOUNT         AMOUNT       INCOME          INCOME              VS.    GROSS RETURN        GROSS RETURN
AS OF 31 JULY 2016               PROPERTIES     31 JULY 2016   30 APRIL 2016   Q1 2016A      Q4 2015/16      Q4 2015/16        Q1 2016A           Q4 2015/16
Austria                                  128         1,031.6         1,032.1        14.7            15.2            -0.6       5.7% (6.6%)          5.9% (6.8%)
Germany                                    3            65.8            65.6         0.9             0.8             0.1       5.4% (7.0%)          4.9% (6.2%)
Czech Republic                            21          398.5           398.5          6.1             6.0            0.1        6.1% (7.4%)          6.0% (7.4%)
Hungary                                   25          441.9           441.0          6.5             6.4            0.1        5.9% (6.9%)          5.8% (6.9%)
Poland                                    15          383.0           382.1          5.6             5.5            0.1        5.9% (6.4%)          5.7% (6.4%)
Romania                                   17          630.4           634.0         11.2            10.8            0.4        7.1% (7.8%)          6.8% (7.4%)
Russia                                     5         1,152.2         1,114.6        18.3            19.0            -0.7       6.4% (7.9%)          6.8% (8.3%)
Slovakia                                  12          166.3           166.3          3.3             3.2            0.1        7.9% (8.0%)          7.7% (7.9%)
Non-core countries                         8            73.0            73.0         1.3             1.3            0.0        7.0% (9.3%)          7.2% (9.3%)
IMMOFINANZ                                234        4,342.7         4,307.3        67.8            68.3            -0.5      6.2% (7.2%)          6.3% (7.3%)
Rental income Q1 2016A from properties sold/                                         9.0                               Values in brackets = adjusted for occupancy
acquired and developments
IMMOFINANZ                                                                          76.8

Office                                    69         2,089.2         2,087.6        28.7            28.4            0.3        5.5% (6.7%)          5.4% (6.7%)
Retail                                   157         2,242.7         2,204.6        39.0            39.8            -0.8       7.0% (7.6%)          7.2% (7.9%)
Others                                     8            10.9            15.1         0.0             0.0            0.0        1.5% (2.5%)          1.2% (1.7%)
IMMOFINANZ                               234         4,342.7         4,307.3        67.8            68.3            -0.5      6.2% (7.2%)          6.3% (7.3%)
                                                                                                                       Values in brackets = adjusted for occupancy

                                                                                                                                                     Q1 2016A – 41
LIKE-FOR-LIKE – PROPERTY VALUATION
The like-for-like analysis (i.e. after an adjustment for new acquisitions, completions and sales to improve comparability) shows stable development
since 30 April 2016. A slight decrease (MEUR -2.5) was recorded in Russia due to fit-out costs for a major tenant.

STANDING INVESTMENTS,
AMOUNTS IN MEUR                        NUMBER OF     CARRYING AMOUNT      VALUATION RESULT
AS OF 31 JULY 2016                     PROPERTIES          31 JULY 2016           Q1 2016A COMMENT
Austria                                        128              1,031.6                -0.1
Germany                                          3                 65.8                -0.2
Czech Republic                                  21                398.5                -0.1
Hungary                                         25                441.9                0.9
Poland                                          15                383.0                0.4
Romania                                         17                630.4                -0.5
Russia                                           5              1,152.2                -2.5 Fit-out costs in Russia
Slovakia                                        12                166.3                -0.3
Non-core countries                               8                 73.0                -0.1
IMMOFINANZ                                     234              4,342.7                -2.5

Office                                          69              2,089.2                0.1
Retail                                         157              2,242.7                -2.7 Fit-out costs in Russia
Others                                           8                 10.9                 0.1
IMMOFINANZ                                     234              4,342.7                -2.5

                                                                                                                                           Q1 2016A – 42
FUNDS FROM OPERATIONS I & II
AMOUNTS IN MEUR                                                               CHANGE        CHANGE
AS OF 31 JULY 2016                                    Q1 2016A Q1 2015/16    ABSOLUTE    IN PERCENT    COMMENT
                                                                                                       1. Reduced net rental income due
Gross cash flow before tax                        1       47.1       51.7         -4.6        -8.9%
                                                                                                          to asset sales and temporary
Gross cash flow before tax from discontinued                                                              rental reductions in Russia
                                                           -0.6       -5.8        5.3         90.4%
operations (in the gross cash flow included)      2
                                                                                                       2. Reduction due to the disposal of
Expenses from property sales                               1.1        2.1         -1.0       -48.2%       the logistics portfolio
(in the gross cash flow included as an expense)
                                                                                                       3. One-off effect in FY 2015/16
Expense for the settlement of investor claims     3        0.0        -0.3        0.3           n.a.
Dividends received from equity-accounted                   0.1        0.0         0.1           n.a.
investments
Interest or dividends received from financial              1.5        1.8         -0.3       -15.6%
instruments
Interest paid                                             -30.2      -30.9        0.7          2.3%
Derivatives payments                                       -9.7      -10.6        0.9          8.5%
FFO 1                                                      9.3        7.9         1.4         17.3%
Results of property sales                                  0.7        1.0         -0.4       -34.2%
FFO 2                                                     10.0        9.0         1.0         11.4%

                                                                                                                               Q1 2016A – 43
BUSINESS UPDATE:
RUSSIA AS OF 31 JULY 2016
 TERM STRUCTURE OF FINANCIAL LIABILITIES
 Values in MEUR
                                           400
                                                       Property financing end of maturity
                                                       Property financing; scheduled repayments from rental income1
                                           300

                                           200

                                           100

                                              0
                                                        2017             2018              2019           2020              2021             2022
                                       1 A reduction or suspension of principal repayments up to March 2018 was arranged for individual financial liabilities

 PROPERTY APPRAISAL
 Standing Investments                                                                                                                       EXTRAORDINARY
                                                                                                                                                 APPRAISAL
                                                  30 APRIL 20131                 30 APRIL 2014                  30 APRIL 2015              31 JANUARY 2016         30 APRIL 2016
 Appraiser                                                       JLL                              JLL                          JLL                          CBRE            CBRE
 Prime yield2                                             9.0-9.5%                        9.3-9.5%                         10.8%                           10.0%           10.0%
 Discount rate                                      11.75-12.00%                    11.50-12.50%                   12.50-13.75%                   12.50-13.75%      12.50-13.75%
 Exit yield                                         10.75-11.00%                    10.50-11.50%                   11.50-12.25%                   11.00-12.25%      11.00-12.25%
 Occupancy rate                                              99.1%                              93.3%                      86.2%                           84.5%           81.9%
 Fair value (MEUR)                                         1,575.4                          1,710.2                       1,536.5                        1,234.7          1,114.6
 LTV                                                         42.2%                              37.7%                      48.0%                           59.2%           60.1%
 Gross yield                                                 11.0%                               9.7%                        8.9%                           6.4%            6.8%
 Gross return (occupancy adj.)                               11.1%                              10.4%                      10.3%                            7.6%            8.3%

 1 Excl. GOODZONE
 2 Source: JLL (30 April 2013 to 30 April 2015) respectively Colliers (up to 31 January 2016)
                                                                                                                                                                            Q1 2016A – 44
BUSINESS UPDATE:
RUSSIA AS OF 31 JULY 2016
  RENTAL INCOME (LIKE-FOR-LIKE)                               FOOTFALL
  Values in MEUR                                              Values in million
           19.0                                                              9.0
                                  18.3                                                              8.3
                     -3.7%                                                              -8.2%

        Q4 2015/16            Q1 2016A                                  Q1 2015/16               Q1 2016A

  CONTRACT EXPIRATION PROFILE RUSSIA                          RENT RECEIVABLES RUSSIA
                                                              Values in MEUR

14%                                      up to 31 July 2017

8%                                       up to 31 July 2018                 11.1

2%                                       up to 31 July 2019
                                                                                                   10.4
                                                                                        -6.3%
16%                                      up to 31 July 2020

60%                                  as of 1 August 2020

0%                                               unlimited
                                                                        30 April 2016           31 July 2016

                                                                                                               Q1 2016A – 45
CONTENT
01 IMMOFINANZ at a Glance & Strategy

02 Combination of IMMOFINANZ and CA Immo

03 Portfolio

04 Financing

05 Q1 2016A Results

06 Appendix

                                           Q1 2016A – 46
TOTAL ECONOMY AND MARKETS
                                                       OFFICE (Q1 2016A)                                                                  RETAIL2 (Q1 2016A)
                                                                                                                                           PRIME RENTS
                                                                                  AVERAGE                                                       ANCHOR    PRIME RENTS
MARKET DATA                    VACANCY RATE                PRIME RENTS               RENTS                 YIELD   VACANCY RATE                 TENANTS OTHER TENANTS                   YIELD
CORE MARKET/CITY1                       IN %                IN EUR/SQM         IN EUR/SQM                   IN %            IN %            IN EUR/SQM     IN EUR/SQM                    IN %
GER/Düsseldorf                              8.3%                   26.0                   15.0             4.5%                 n.a.                  n.a.              n.a.              n.a.
GER/Cologne                                 5.9%                   18.2                   11.3             5.0%                 n.a.                  n.a.              n.a.              n.a.
AT/Vienna                                   6.4%                   25.5                   14.0             4.5%                 n.a.                  n.a.             130.0             4.8%
PL/Warsaw                                 14.1%                    22.0                   14.3             6.0%                3.1%                   15.5             110.0             5.0%
RO/Bucharest                              14.0%                    17.0                   14.5             7.5%               10.0%                   20.0              65.0             7.5%
RU/Moscow                                    n.a.                   n.a.                  n.a.              n.a.               8.0%          USD 100.00           USD 248.00            10.0%
SK/Bratislava                               8.1%                   15.5                   11.0             7.0%                 n.a.                  15.0             37-40             5.8%
CZ/Prague                                 13.9%                    19.5                   13.2             5.3%                 n.a.                  n.a.             110.0             5.5%
HU/Budapest                               11.3%                    18.0                   12.8             7.1%                4.0%                   35.0              75.0             7.3%
Source: 1 Colliers, EHL (for the office market in Vienna); 2 Colliers; EHL (for Vienna shopping centers)

                                  UNEMPLOYMENT                       ANNUAL          GROSS NATIONAL               DEFICITS/                             FORECASTED GDP         FORECASTED GDP
                                             RATE             INFLATION RATE                DEBT 2015        SURPLUS 2015              GDP GROWTH         GROWTH RATE            GROWTH RATE
ECONOMIC DATA                       IN APRIL 20161              IN APRIL 20161          (IN % OF GDP)        (IN % OF GDP)               RATE 20152               2016                   2017
Germany                                             4.2%                   -0.3%                   71.2%               0.7%                    1.7%                  1.6%                1.6%
Austria                                             5.8%                    0.6%                   86.2%              -1.2%                    0.9%                  1.5%                1.6%
Poland                                              6.3%                   -0.5%                   51.3%              -2.6%                    3.6%                  3.7%                3.6%
Romania                                             6.4%                   -2.6%                   38.4%              -0.7%                    3.8%                  4.2%                3.7%
Russia3                                             5.6%                   15.6%                   13.5%              -2.4%                   -3.7%                  -1.9%               1.1%
Slovakia                                        10.2%                      -0.4%                   52.9%              -3.0%                    3.6%                  3.2%                3.3%
Czech Republic                                      4.1%                    0.5%                   41.1%              -0.4%                    4.2%                  2.1%                2.6%
Hungary                                             5.6%                    0.3%                   75.3%              -2.0%                    2.9%                  2.5%                2.8%
EU 28                                               8.7%                   -0.2%                   85.2%              -2.4%                    2.0%                  1.8%                1.9%
Euro zone (19 countries)                        10.2%                      -0.2%                   90.7%              -2.1%                    1.7%                  1.6%                1.8%
Source: 1 Eurostat; 2 European Commission spring forecast; per cent change versus previous year (2015 - 2017); 3 World Bank, Russia Economic Report, April 2016

                                                                                                                                                                                    Q1 2016A – 47
STRUCTURE
PRIVATE AND INSTITUTIONAL INVESTORS BY COUNTRY

PRIVATE AND INSTITUTIONAL INVESTORS

 32.2%                                 3.5%                                   62.8%
 Private Austria                Not identified                                Institutional investors

                                      1.0%       0.5%
                             Treasury shares     Private other

INSTITUTIONAL INVESTORS BY COUNTRY
                                                                                                                          5.1%
                                                                                                                           Other
 25.8%                                                           4.4%           3.3%          2.7%            1.3%          incl.
 Austria                                                         CY             UK            NL              FR         trading

                                                        10.7%           3.6%           3.0%             2.2% 0.7%
                                                        USA             NOR            PL               GER        CH

Source: IPREO, August 2016
                                                                                                                        Q1 2016A – 48
NOTES

        Q1 2016A – 49
CONTACT DETAILS AND FINANCIAL CALENDAR

INVESTOR RELATIONS
+43 (0)1 88 090
E-Mail: investor@immofinanz.com
www.immofinanz.com

FINANCIAL CALENDAR                                                                           TICKER SYMBOLS
Ex-dividend date                                      30 September 2016                      Vienna Stock Exchange                           IIA
Record date for the determination                     3 October 2016                         Warsaw Stock Exchange                           IIA
of dividend rights                                                                           ISIN                                 AT0000809058
Dividend payment date                                 4 October 2016                         Reuters                                    IMFI.VI
H1 2016 results                                       19 December 20161                      Bloomberg                                   IIA AV
H1 2016 report                                        20 December 2016

ADR PROGRAMME
Ticker symbol: IMNZY        CUSIP: 45253U201        ISIN: US45253U2015                             ADR-Ratio: 1 ADR: 4 Ordinary Shares
Depositary bank: Deutsche Bank Trust Company Americas

ADR broker helpline:                                    E-Mail: adr@db.com
New York: +1 212 250 9100                               ADR Website: www.adr.db.com
London: +44 207 547 6500                                Depositary bank’s local custodian: Deutsche Bank, Frankfurt

1 Publication is scheduled after the close of trading on the Vienna Stock Exchange
                                                                                                                                                   Q1 2016A – 50
You can also read