Asian Journal of Research in Banking and Finance - Asian Journal Of Research In ...
←
→
Page content transcription
If your browser does not render page correctly, please read the page content below
Asian Journal of Research in Banking and Finance
 ISSN: 2249-7323 Vol. 11, Issue 10-11, October- November 2021 SJIF 2021 = 8.174
 A peer reviewed journal

 EXAMINATION OF BUBBLES IN CRYPTOCURRENCY MARKETS
 USING ADVANCED UNIT ROOT TESTS
 Aditya Doomra*
 *Student,
 Sri Venkateswara College – University of Delhi,
 INDIA
 Email id: adityadoomra10@gmail.com
 DOI: 10.5958/2249-7323.2021.00020.1
ABSTRACT

Cryptocurrencies are attracting more investors and are reaching higher prices than ever, hence it
becomes important to analyse whether the new asset class is a bubble or not. Previous literature
on examination of cryptocurrency bubbles has primarily focused on Bitcoin, but the newer
cryptocurrencies such as Ethereum are innovating the space with smart contracts, upstaging
Bitcoin on some aspects, hence it becomes important to analyse the newer cryptocurrencies apart
from Bitcoin as well for rational bubbles. The methods of recursive unit root tests suggested by
Phillips, Shi and Yu (2015) has been used in this study to check for the presence of bubbles and to
date stamp the periods of exuberance in three major cryptocurrencies: Bitcoin, Ethereum and
Ripple from 2016 to 2021. Similarity in exuberance periods of Bitcoin and Ethereum is also
detected in this research.
KEYWORDS: Cryptocurrency, Bubbles, GSADF, SADF, Bitcoin, Ethereum, Ripple
JEL Classification: C5, C15, C22
1. INTRODUCTION
Cryptocurrencies have lately become the most lucrative asset class for investors with an appetite
for risk, with Bitcoin rising from $0.0008 when it was first traded in July 2010 to hitting its record
high in November 2021 when it traded for more than $65,000. Many speculate that the massive
valuations that this new asset class is drawing is just a bubble, thus it becomes important to
quantify and mathematically test how much truth lies to the statement. Hence some studies have
been conducted in the past examining whether Bitcoin (BTC) is a bubble or not and date stamp the
periods of exuberance in the same. Mostly this literature on cryptocurrencies focuses on Bitcoin
and not enough emphasis is given to the newer cryptocurrencies that are introducing new
innovations such as Ethereum introducing smart contracts and Ethereum 2.0 curbing carbon
emissions due to its proof of stake system. This study aims to examine the presence of bubbles in
three major cryptocurrencies: Bitcoin, Ethereum and Ripple from 2016 to 2021 and date stamp the
periods of exuberance in the same.
The newer cryptocurrencies such as Ethereum need to be examined along with Bitcoin as they are
rapidly innovating in the space. Ethereum’s smart contracts have enabled new innovations such as
Decentralised Finance (DeFi) and Non-Fungible Tokens (NFTs). These innovations are in turn
giving rise to entirely new industries of their own. All this innovation has successfully cemented
Ethereum as the second largest cryptocurrency by market capitalisation after Bitcoin. Ripple is a
cryptocurrency that provides liquidity on cross border transactions and handle transaction speeds
and volumes at par with financial services firms. Newer cryptocurrencies such as Solana and
Cardano could not be included in the study as they were founded in 2020 and 2017 respectively,
due to these newer cryptocurrencies not having a price history from 2016 to 2021 to perform this

 Asian Research consortium
 9
 www.aijsh.com
Asian Journal of Research in Banking and Finance
 ISSN: 2249-7323 Vol. 11, Issue 10-11, October- November 2021 SJIF 2021 = 8.174
 A peer reviewed journal

study. Thus Bitcoin, Ethereum and Ripple have been taken as the final candidates for bubble
testing over the 5-year period.
Numerous studies have already been conducted to understand Bitcoin’s price movement. The
volatility of Bitcoin price has been found to be seven times greater than that of gold and 18 times
the US Dollar (Williams, 2014). Cryptocurrencies do not have any intrinsic value, nor do they pay
any dividends, thus it becomes important to assess whether it is a bubble or not.
1.1. Literature Review
Bubbles are often seen as market irrationality and thus dismissed by researchers as loose talk as it
poses a challenge to the efficient market hypothesis (Fama, 1970). On the other hand, researchers
who are supporters of the bubble theory say that economists should not value their models more
than the substance the models convey as it leads to them losing touch with real world (O'Hara,
2008). As bubbles have devastating effects on the economy, policy makers are interested to
understand how the asset prices deviate from their fundamental values and methods to detect the
same. Research in bubble detection was also given a boost by the 2008 financial crisis which led
to an increase in research on theoretical as well as empirical work on bubble detection.
Theoretical bubble models are essential for developing and employing suitable methods. These
theoretical bubble models can be further divided into the rational bubble models and the
behavioural bubble models. The methodology used in this paper is based on the rational bubble
models. One approach in the rational bubble models is to assume that the asset prices are based on
the value of dividends and it is assumed that these dividends follow a random walk process while
a bubble will be characterised by an explosive autoregressive drift (Diba, 1988). This in turn
implies that whenever a bubble is not present, the asset price also follows a random walk with
drift. Thus, enabling the use of stationarity tests to test for the presence of bubbles, wherein the
bubble component in non-stationary. There is an extensive base of literature on theoretical bubble
models, however bubbles should not be treated as a theoretical problem as the existence of bubbles
is a largely empirical argument (Giglio, 2016).
The goal of empirical bubble literature is to develop tests and mechanisms to first check the
presence of bubbles in a given period and then to date stamp the origination and termination date
of the bubble period within the entire sample. These empirical methods can also be largely divided
into the early econometric methods of bubble detection and the more recent methods such as the
GSADF test introduced in 2015 (Phillips PCB S. S., 2015).
The early econometric methods can be divided into the volatility tests, the two-step test (West,
1987) and the stationarity and cointegration based tests. In the early econometric methods, there is
vast literature on the stationarity and cointegration based tests. Craine (1993) tests for rational
bubbles in the S&P 500 using the Augmented Dickey Fuller test (ADF test) applied the annual
price dividend ratio data from 1872 to 1988, these tests fail to reject the null. Evans (1991) shows
that the standard unit root and cointegration based tests such as the ones mentioned above have
little power in detecting complex patterns such as periodically collapsing bubbles which make the
data look like a stationary process rather than an explosive process.
The recently developed recursive unit root tests have been used in this research. The SADF test
developed by Philips, Wu and Yu (PWY) in 2011 uses forward recursive regressions where the
starting point is fixed and the ending point keeps on expanding. Homm and Breitung (2012)
evaluate this method in terms of testing power, using Monte Carlo simulations they show that the
PWY method works decently as a detection mechanism for structural breaks. Philips, Shi and Yu
(PSY) in 2015 show that the PWY method only serves as an efficient method when there is a
single bubble process in the time series. This means that the PWY method suffers from reduced
power in detecting periodically collapsing bubbles over long time series. This in turn is fixed in

 Asian Research consortium
 10
 www.aijsh.com
Asian Journal of Research in Banking and Finance
 ISSN: 2249-7323 Vol. 11, Issue 10-11, October- November 2021 SJIF 2021 = 8.174
 A peer reviewed journal

the PSY method which proposes a GSADF test which allows the starting point of the subsample to
vary along with the ending point of the subsample. They show that the PSY method significantly
outperforms the PWY method when multiple bubbles appear in the data, thereby overcoming a
weakness in the unit root tests for bubble detection. Thus, the GSADF test has been used in the
study and the BSADF sequence compared to the critical values has been used to date stamp the
periods of exuberance in the time series.
2. Methodology
The ADF regression equation that is used in the study of bubbles in cryptocurrencies is given as:

∆ = 1, 2 + 1, 2 −1 + 1, 2 ∆ − +
 =1

Here t denotes the time series, ∆ − with j = 1,2, …, k are the lagged first differences of the time
series, included to accommodate serial correlation. is the error term in the regression equation

and 1, 2 , 1, 2 and 1, 2 with j = 1,2, …, k are the regression coefficients. The symbols r1 and r2
denote fractions of the total sample size of T observations where r1 is the starting point of the
subsample period and r2 is the last point of the subsample period.
The null hypothesis of the ADF test is the existence of a unit root, which can be tested using the
regression coefficient: 1, 2 , H0: 1, 2 = 0 against the alternative which confirms that the time
series is stationary in nature and in fact it is said to have a mildly explosive autoregressive
coefficients in , the alternate hypothesis is given as : 1, 2 > 0. The ADF test statistic
corresponding to this null hypothesis is given as:
 1
 2 = 1, 2 / . . ( 1, 2 )
The null hypothesis is rejected if the ADF test statistic is greater than the critical value of the for
the specified confidence level. In the standard ADF test, the ADF statistic is obtained by
estimating the regression on the full sample of observations by setting r1 = 0 and r2 = 1. This test
however is not sufficient in detecting periodically collapsing bubbles in a time series and
frequently leads to finding spurious stationarity even when the time series under examination is
explosive (Evans, 1991).
The SADF test (Phillips PCB W. Y., 2011) proposes a methodology of estimating the ADF
regression using a forward expanding sample which is mathematically given as r1 = 0 while the
end of the subsample, r2 increases from 0 to 1, thus 2 [0,1]. The recursive estimation of the ADF
statistic leads to an output of a sequence of ADF statistics. The supremum of this sequence or the
SADF statistic is given by:
 0 = 2 [ ,1] 0 2
Instead of having an alternate hypothesis of explosive dynamics in the entire sample like the ADF
test, the SADF test has an alternate hypothesis of explosive dynamics in some parts of the sample.
The generalised SADF test (Phillips PCB S. S., 2015) is an extension of the aforementioned SADF
test. This has the same alternate hypothesis as the SADF test, the major change is the instead of
having a fixed starting point r1 to estimate the statistic, the GSADF test allows both r1 and r2 to
change. Thus, it becomes possible to detect multiple bubbles with the GSADF test. Nonlinear
structures and structural breaks are also taken into account by the GSADF test (Сagli, 2017).
The GSADF statistic is defined as:
 2
 0 = 2 0,1 , 1 [0, 2− 0] 1

The rejection of the unit root hypothesis in favour of explosive dynamics in the time series

 Asian Research consortium
 11
 www.aijsh.com
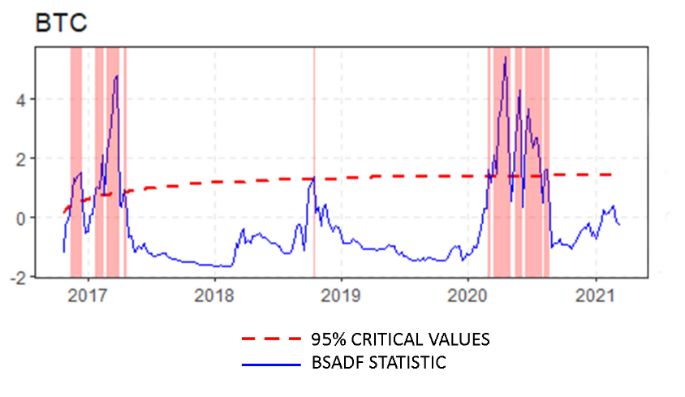
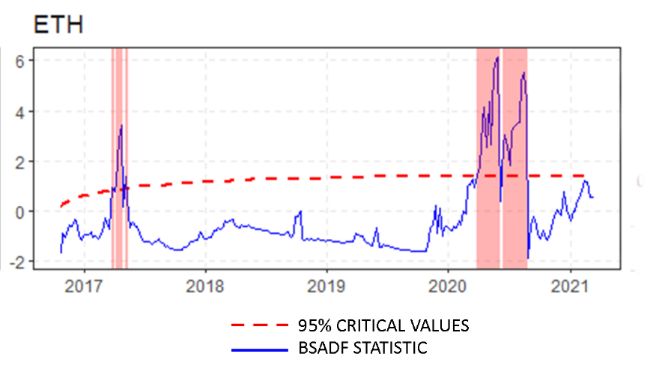
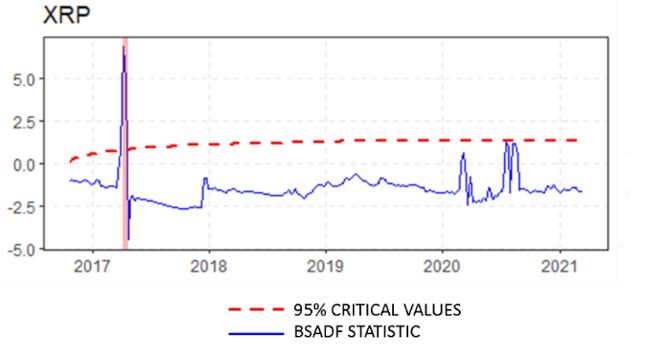
Asian Journal of Research in Banking and Finance
 ISSN: 2249-7323 Vol. 11, Issue 10-11, October- November 2021 SJIF 2021 = 8.174
 A peer reviewed journal

requires that the test statistic exceeds its right tail value which is calculated using Monte Carlo
simulations.
In the GSADF methodology, the date stamping strategy compares a series of Backward SADF
statistics against the right tailed critical values of the SADF statistic. These critical values are
calculated using 2000 Monte Carlo simulations. This is due the distributions of the various test
statistics of exuberance being non-standard in nature. The minimum window for the test was taken
as 0 = 0.01 + 1.8 where T is the number of observations in the time series as suggested
(Phillips PCB S. S., 2015). The consistency of this date stamping strategy has been verified
numerous times by various researchers, hence it is used to date stamp the periods of exuberance in
the cryptocurrencies.
3. Data and empirical results
In this study we have taken the closing price data of three major cryptocurrencies: Bitcoin,
Ethereum and Ripple over a period of 5 years from November 2016 to November 2021. The
closing prices of the cryptocurrencies were taken against US Dollar and the pairs were given by:
BTC-USD, ETH-USD and XRP-USD. This data was then converted to a multivariate time series
in R and 3 tests: ADF, SADF and GSADF tests were conducted on the data and the results are as
follows:
H0 was rejected for BTC-USD, ETH-USD and XRP-USD at 1% significance level for the GSADF
test, thus verifying the existence of bubbles in all three cryptocurrencies over the past 5 years at a
99% confidence level. The test statistics for the three cryptocurrencies clearly shows periods of
exuberance as the SADF and GSADF test at 95% confidence level reject H0. The test statistics and
95% critical values for the tests on all three cryptocurrencies have been given in table 1.
 TABLE 1: TEST STATISTICS FOR CRYPTOCURRENCIES
 Name of test BTC ETH XRP 95% critical value
 ADF -0.29 0.556 -4.15 -0.142
 SADF 4.81 4.89 4.21 1.4
 GSADF 5.41 6.12 6.88 2.11
3.1. Date stamping periods of exuberance
The aforementioned strategy was followed for date stamping the periods of exuberance in the
cryptocurrencies and the R package ‘exuber’ was used to perform the tests. The plots for the
Backward SADF sequence for Bitcoin, Ethereum and Ripple are given in figure 1, 2 and 3
respectively; the periods of exuberance occur when the Backward SADF value exceeds the 95%
critical value and it is highlighted in red.
 Figure 1 Figure 2

 Figure 3

 Asian Research consortium
 12
 www.aijsh.com
Asian Journal of Research in Banking and Finance
 ISSN: 2249-7323 Vol. 11, Issue 10-11, October- November 2021 SJIF 2021 = 8.174
 A peer reviewed journal

The periods of exuberance in the cryptocurrencies are given in table 2 and the plot of the periods is
given in figure 4. As we can clearly see from the plots and the table, Ripple has the shortest
amount of exuberance over the 5 years and only had one period lasting for 2 weeks. Ethereum has
24 total weeks of exuberance and Bitcoin has the largest amount of exuberance in the 5 years with
33 total weeks of exuberance spread over 7 periods. We can also infer from figure 4 that the
periods of exuberance of Bitcoin and Ethereum are overlapping during the years 2017 and 2020.
Upon further investigation, we can conclude that the two cryptocurrencies indeed have similar
behaviour in bubbles as we run a regression analysis on the bubble periods of Ethereum with
respect to Bitcoin and find that the p value of the regression coefficient is less than 0.01, thus
rejecting the null hypothesis at 1% level of significance, hence we can infer that there is a high
level of correlation in the periods of exuberance of Bitcoin and Ethereum.
 TABLE 2: BUBBLE PERIODS IN CRYPTOCURRENCIES
 BTC
 Start End Duration (in weeks)
 12-11-2016 17-12-2016 5
 21-01-2017 18-02-2017 4
 25-02-2017 01-04-2017 5
 13-03-2020 01-05-2020 7
 15-05-2020 05-06-2020 3
 12-06-2020 31-07-2020 7
 07-08-2020 21-08-2020 2
 ETH
 Start End Duration (in weeks)
 08-04-2017 29-04-2017 3
 27-03-2020 05-06-2020 10
 12-06-2020 28-08-2020 11
 XRP
 Start End Duration (in weeks)
 08-04-2017 22-04-2017 2
 Figure 4

 Asian Research consortium
 13
 www.aijsh.com
Asian Journal of Research in Banking and Finance
 ISSN: 2249-7323 Vol. 11, Issue 10-11, October- November 2021 SJIF 2021 = 8.174
 A peer reviewed journal

4. DISCUSSION
The analysis clearly shows 7 explosive bubbles in Bitcoin, 3 in Ethereum and 1 in Ripple from
2016 to 2021. The occurrence of these bubbles is in accordance with periods of rise in price and
conversely, the falling prices of cryptocurrencies make the bubbles burst. This behaviour is
extremely volatile when compared to other asset classes such as equity. No periods of exuberance
were found in a study examining bubbles in the Indian stock markets (Ghosh, 2016). This when
compared to our analysis of the cryptocurrency markets clearly shows us the extremely volatile
nature of the asset class. Since there is no formal regulatory body established for these markets,
they are prone to price manipulation and asymmetry in information among investors causing the
bubbles. The cryptocurrency markets do not have mandatory disclosures or due processes to verify
the legitimacy of the promoters of new cryptocurrencies and are thus prone to unethical practices
such as rug pulls.
The cryptocurrency markets have recently picked up pace and are becoming increasingly efficient,
earlier studies done on Bitcoin prices over the past show the existence of numerous bubbles. (Li,
2019) (Julian Geuder, 2018). Our results also go in line with these studies, showing the existence
of bubbles in Bitcoin during the year 2017. These studies also show the difference in Bitcoin
prices across geographies, a market gap that has been sufficiently filled with arbitrage over the
years. The introduction of cryptocurrency derivatives has also influenced the price movement
significantly. This new asset class has gained widespread attention and attracted numerous
investors over the past few years that do not have adequate understanding of the asset, which is in
part responsible for causing bubbles in these cryptocurrencies, but this attention is really beneficial
as well. This is due to the underlying technology of cryptocurrencies: blockchain, which is also
receiving attention by investors. The innovations that blockchain and web3 enable require large
amounts of investment which it is able to receive due to the boom of investment surrounding
blockchain.
In the future this analysis can be used by prominent organisations in the industry to keep the
markets in check and burst the bubbles during the initial period itself to avoid huge losses to the
investors. Since cryptocurrency markets will most likely continue to be unregulated in the near
future, this can also be used by investors to predict market corrections and movements for their
own personal gains.
5. Limitations of study and scope for future work
Out of the numerous methods of bubble detection, only one group of methods: the unit root tests
are used in this research. The unit root tests only factor in the time series data to detect bubbles,
which has some limitations, such as the asset retaining the same price however increasing in
circulation, thus effectively increasing in value, this however is not factored in these tests.
The time span chosen was for 5 years from 2016 to 2021 and only factored in 3 cryptocurrencies,
as the emerging cryptocurrencies such as Cardano or Solana are relatively new in comparison to
Bitcoin and do not have price history that goes back till 2016. In future studies of bubbles in

 Asian Research consortium
 14
 www.aijsh.com
Asian Journal of Research in Banking and Finance
 ISSN: 2249-7323 Vol. 11, Issue 10-11, October- November 2021 SJIF 2021 = 8.174
 A peer reviewed journal

cryptocurrencies, a period starting from 2018 or 2019 can be taken which allows to accommodate
more cryptocurrencies in the analysis.
6. REFERENCES
Craine, R. (1993). Rational Bubbles: A Test. Journal of Economic Dynamics and Control, 829-
846.
Diba, B. T. (1988). Explosive Rational Bubbles in Stock Prices? American Economic Review.
Evans. (1991). Pitfalls in Testing for Explosive Bubbles in Asset Prices. The American Economic
Review.
Fama, E. F. (1970). Efficient Capital Markets: A Review of Theory and Empirical Work. The
Journal of Finance.
Ghosh, B. (2016). Rational Bubble Testing: An in-depth Study on CNX. Asian Journal of
Research in Banking and Finance.
Giglio, S. M. (2016). No-Bubble Condition: Model-Free Tests in Housing Markets. Econometrica,
1047-1091.
Homm, U. a. (2012). Testing for Speculative Bubbles in Stock Markets: A Comparison of
Alternative Methods. Journal of Financial Econometrics, 198–231.
Julian Geuder, H. K. (2018). Cryptocurrencies as financial bubbles: The case of Bitcoin. Finance
Research Letters.
Li, Z. T. (2019). Does Bitcoin bubble burst? Qual Quant.
O'Hara, M. (2008). Bubbles: Some Perspectives (and Loose Talk) from History. The Review of
Financial Studies.
Phillips PCB, S. S. (2015). Testing for multiple bubbles: Historical episodes of exuberance and
collapse in S&P 500. International Economic Review.
Phillips PCB, W. Y. (2011). ―Explosive behavior in the 1990s NASDAQ: When did exuberance
escalate asset values? International Economic Review.
West, K. D. (1987). A Specification Test for Speculative Bubbles. Quarterly Journal of
Economics, 553–580.
Williams, M. T. (2014). Virtual currencies—Bitcoin risk. World Bank Conference. Washington
DC.
Сagli, E. C. (2017). Rational bubble existence in Borsa Istanbul: An analysis on sectoral indices.
Finans Politik and Ekonomik Yorumlar.

 Asian Research consortium
 15
 www.aijsh.com
You can also read