Assessing and Managing Fishing Capacity in the Context of World Trade Organization Disciplines on Fisheries Subsidies - GSI POLICY BRIEF
←
→
Page content transcription
If your browser does not render page correctly, please read the page content below
Assessing and
Managing Fishing
Capacity in the
Context of World
Trade Organization
Disciplines on
Fisheries Subsidies
GSI POLICY BRIEF

© 2021 International Institute for Sustainable Development | IISD.org /gsi   April 2021
Assessing and Managing Fishing Capacity in the Context of World Trade Organization
Disciplines on Fisheries Subsidies

© 2021 International Institute for Sustainable Development
Published by the International Institute for Sustainable Development
This publication is licensed under a Creative Commons Attribution-
NonCommercial-ShareAlike 4.0 International License.

International Institute for Sustainable Development
The International Institute for Sustainable Development (IISD) is an        Head Office
award-winning independent think tank working to accelerate solutions
                                                                            111 Lombard Avenue,
for a stable climate, sustainable resource management, and fair
                                                                            Suite 325
economies. Our work inspires better decisions and sparks meaningful
                                                                            Winnipeg, Manitoba
action to help people and the planet thrive. We shine a light on what
                                                                            Canada R3B 0T4
can be achieved when governments, businesses, non-profits, and
communities come together. IISD’s staff of more than 120 people, plus       Tel: +1 (204) 958-7700
over 150 associates and consultants, come from across the globe and         Website: www.iisd.org
from many disciplines. Our work affects lives in nearly 100 countries.      Twitter: @IISD_news

IISD is a registered charitable organization in Canada and has 501(c)(3)
status in the United States. IISD receives core operating support from
the Province of Manitoba and project funding from governments inside
and outside Canada, United Nations agencies, foundations, the private
sector, and individuals

Global Subsidies Initiative
The IISD Global Subsidies Initiative (GSI) supports international           Global Subsidies Initiative
processes, national governments and civil society organizations to align
                                                                            International Environment
subsidies with sustainable development. GSI does this by promoting
                                                                            House 2,
transparency on the nature and size of subsidies; evaluating the
                                                                            7–9 chemin de Balexert
economic, social and environmental impacts of subsidies; and, where
                                                                            1219 Châtelaine
necessary, advising on how inefficient and wasteful subsidies can best be
                                                                            Geneva, Switzerland
reformed. GSI is headquartered in Geneva, Switzerland, and works with
                                                                            Canada R3B 0T4
partners located around the world. Its principal funders have included
the governments of Denmark, Finland, New Zealand, Norway, Sweden,           Tel: +1 (204) 958-7700
Switzerland and the United Kingdom, as well as the KR Foundation.           Website: www.iisd.org/gsi
                                                                            Twitter: @globalsubsidies

Assessing and Managing Fishing Capacity in the Context of World
Trade Organization Disciplines on Fisheries Subsidies
April 2021
The production of this brief was funded with UK aid from the
UK government.

                                                                                     IISD.org/gsi    ii
Assessing and Managing Fishing Capacity in the Context of World Trade Organization
Disciplines on Fisheries Subsidies
Table of Contents
1.0 Introduction..................................................................................................................................................................... 1
2.0 Background...................................................................................................................................................................... 3
3.0 Defining Key Concepts...............................................................................................................................................4
3.1 Fishing Capacity: Input vs output...................................................................................................................................4
3.2 Capacity Utilization and Target Capacity............................................................................................................... 5
3.3 Excess Capacity vs Overcapacity.................................................................................................................................. 5
3.4 Overfishing and Overfished Stocks..............................................................................................................................6
4.0 Managing Fishing Capacity ....................................................................................................................................7
4.1 Defining, Measuring, and Monitoring Target Capacity....................................................................................7
4.2 Indicators to Assess Overcapacity................................................................................................................................9
4.3 Multi-Species Fisheries and Artisanal, Small-Scale Fishing.................................................................10
4.4 High Seas Fishing, Migratory Species and Straddling Stocks...............................................................11
5.0 Assessing Global Fishing Capacity: An overview of internationally available data.................12
6.0 Conclusion...................................................................................................................................................................... 17
References.............................................................................................................................................................................18
Annex 1. Key FAO guidance material on fishing capacity............................................................................ 20
IISD.org/gsi iiiAssessing and Managing Fishing Capacity in the Context of World Trade Organization
Disciplines on Fisheries Subsidies
1.0 Introduction
World Trade Organization (WTO) negotiations to discipline fisheries subsidies, including
“through the prohibition of certain forms of fisheries subsidies that contribute to overcapacity
and overfishing” (WTO, 2005) have been underway since 2001. Based on the proposals
currently on the table, future rules will likely include a prohibition of subsidies for vessels
or operators engaged in illegal, unreported, and unregulated (IUU) fishing; a prohibition of
subsidies for fishing or fishing-related activities regarding overfished stocks; and disciplines on
subsidies that contribute to overfishing and overcapacity more broadly.
While WTO members seem to converge on the broad structure of IUU and overfished
stocks disciplines, subsidies that contribute to overcapacity and overfishing remain subject
to more controversy. The latest version of the draft consolidated text circulated by the chair
of the rules negotiating group (RNG), Ambassador Santiago Wills, envisages a prohibition
targeting certain forms of support considered as capacity enhancing, including subsidies to
construction and modernization, vessel equipment, or fuel, to list just a few.1 The general
prohibition is, however, qualified by an exemption that would apply if the subsidizing member
can demonstrate that it implements measures to maintain the stock(s) in the relevant fishery
at a biologically sustainable level, using maximum sustainable yield (MSY), or alternative
reference points.
This draft language has raised a number of questions in the negotiations, such as, for example,
regarding what would constitute alternative reference points. More fundamentally, some
have questioned the fact that the text only requires members to have management measures
in place aimed at maintaining stocks at sustainable levels, but it does not clearly contain an
obligation to show that this objective has been effectively achieved. In practice, many WTO
members may have management measures in place—for example, in the form of catch limits—
but still suffer from overcapacity that puts pressure on those catch limits. The current draft
text on subsidies to overfished stocks also contains an exception that would allow members
to provide subsidies to these stocks if they had measures in place that would ensure the
rebuilding of the stock to a biologically sustainable level. On the other hand, some other
members think that the requirement to “demonstrate” that there are measures in place to
maintain stocks is excessively strict and could be very hard to achieve.
If these exceptions remain in the final agreement, members wanting to use them to continue
providing otherwise-prohibited subsidies will need to think through how to measure their
existing fishing capacity and how this relates to the resources being exploited. Members
may also, of course, choose to redesign their subsidy measures so they do not fall within the
category of prohibited subsidies at all. While the approach of focusing on subsidies that do
in practice contribute to overcapacity and overfishing would be consistent with the overall
negotiating mandate, implementing the new rules to rely on this exception may require
governments to think again about how they measure and monitor existing fishing capacity
in relation to marine resources. As a contribution to governments thinking about how this
obligation could be implemented in practice, the present policy brief provides a general
1 See RD/TN/RL/126/Rev.2* (Access restricted).
IISD.org/gsi 1Assessing and Managing Fishing Capacity in the Context of World Trade Organization
Disciplines on Fisheries Subsidies
background on fishing capacity management and defines some of the key concepts used
in this area based on existing literature. It then suggests possible options for members to
establish, measure, and monitor fishing capacity, while ensuring that capacity remains within
sustainable levels. Section 4 provides an overview of existing capacity in the global fleet based
on available empirical evidence, while Section 5 summarizes the main findings.
IISD.org/gsi 2Assessing and Managing Fishing Capacity in the Context of World Trade Organization
Disciplines on Fisheries Subsidies
2.0 Background
Since the late 1980s, following a decade of intense fleet development, too many vessels and
excessive harvesting power have resulted in overcapacity in world fisheries and, in the absence
of effective management, have led to overfishing and other problems like IUU fishing.
There are many reasons for this overcapacity. The prevalence of free and open access to the
resource, technological improvements, and the rapid expansion of global fish markets have
all contributed to over-investment. Subsidies that support the development of domestic
fleets, participation in shared or high seas fisheries, or access to foreign exclusive economic
zones (EEZs) have also contributed to overcapitalization of the global fleet (Food and
Agriculture Organization of the United Nations [FAO], 2008). As a result, the sector has seen
a continuous decline in productivity, threatening not only the sustainability of stocks but also
employment, livelihoods, and food security. According to the World Bank, world fisheries
are largely overcapitalized and would reach their maximum economic potential by reducing
aggregate fishing effort by 44% relative to the 2012 level.
Recognizing the threat to the world’s fisheries resources posed by excessive fishing capacity,
Article 61 of the United Nations Convention on the Law of the Sea (UNCLOS) provides
that the coastal state “shall ensure through proper conservation and management measures
that the maintenance of the living resources in the exclusive economic zone is not endangered
by over-exploitation” (United Nations, 1982). Article 6.3 of the FAO Code of Conduct for
Responsible Fisheries (CCRF) also recommends that “States should prevent overfishing
and excess fishing capacity and should implement management measures to ensure that
fishing effort is commensurate with the productive capacity of the fishery resources and their
sustainable utilization” (FAO, n.d.). In furtherance of this recommendation, FAO Members
adopted in 1999 the International Plan of Action for the Management of Fishing Capacity
(IPOA-Capacity) (FAO, 1999).
This voluntary instrument calls for an efficient, equitable, and transparent management of
fishing capacity and provides recommendations for assessment and monitoring of fishing
capacity, the preparation and implementation of national plans, the adoption of preliminary
management measures, and a system of periodic review. Notably, paragraph 26 of the
IPOA-Capacity recommends that “States should reduce and progressively eliminate all
factors, including subsidies … which contribute, directly or indirectly, to the buildup of
excessive fishing capacity thereby undermining the sustainability of marine living resources,
giving due regard to the needs of artisanal fisheries” (FAO, 1999). The implementation
of the IPOA-Capacity is supported by a collection of guidance materials for (1) assessing,
measuring, and monitoring, (2) managing, and (3) transitioning away from overcapacity
under the broader FAO Technical Guidelines for Responsible Fisheries (FAO, 2008).2
Annex 1 to this policy brief provides detailed references for such guidance materials. Taken
together, this material not only provides critical insights on the different concepts discussed
in this note, it also contains practical advice on how to collect information related to them
under different circumstances.
2 This guidance includes Ward et al. (2004); Pascoe et al. (2003); and FAO (2002).
IISD.org/gsi 3Assessing and Managing Fishing Capacity in the Context of World Trade Organization
Disciplines on Fisheries Subsidies
3.0 Defining Key Concepts
Assessing and managing fishing capacity has been made particularly complex due—among
other things—to a proliferation and confusion of terms as well as the evolution of work on the
topic over the past 20 years. It may therefore be important to clarify some key concepts at the
outset. In the absence of universally recognized definitions, this note relies on definitions by
the FAO in its various technical papers and guidelines.
3.1 Fishing Capacity: Input vs output
The FAO technical guidelines developed to support the implementation of the IPOA-Capacity
define fishing capacity as “the amount of fish or fishing effort that can be produced over
a period of time by a vessel or a fleet if fully utilized. That is, if effort and catch were not
constrained by restrictive management measures” (FAO, 2008).
In practice, capacity can be measured either with reference to the amount of inputs used or
with reference to outputs generated. In input terms, fishing capacity can be expressed through
fleet characteristics or as the ability to generate a certain fishing effort defined as the amount
of fishing gear of a specific type used on the fishing grounds over a given unit of time, e.g.,
hours trawled per day, or number of hooks set per day. This measure is most frequently used
by fisheries scientists and managers. In this context, fishing capacity is not the same as fishing
effort. The first refers to a potential while the second corresponds to the share of this potential
that is actually used. Proxies typically used to measure the fleet include gross registered
tonnage or horsepower (FAO, 2008). For example, the European Union defines fishing effort
as gross tonnage (GT) and engine power (KW) multiplied by days at sea. The key challenge
consists in identifying the combination that best reflects the productivity of different and
sometimes highly heterogeneous fishing units.
When expressed in output terms, as is usually done by fisheries economists, fishing capacity
can be defined as “the maximum amount of fish over a period of time (year, season) that can
be produced by a fishing fleet if fully utilized, given the biomass and age structure of the fish
stock and the present state of the technology” (Pascoe & Gréboval, 2003). The advantage of
an output-based approach is that it allows for aggregation between different segments of the
fleet. It also reduces complexities related to interaction between fisheries (e.g., when by-catch
of one fishery is the catch of another) and it is more adapted to deal with artisanal fisheries
where inputs can change rapidly over time. The FAO guidelines nonetheless recommend that
states express their national fishing capacity estimates both in terms of inputs and outputs
in order to remove the need to agree on a common definition and to facilitate international
cooperation.
IISD.org/gsi 4Assessing and Managing Fishing Capacity in the Context of World Trade Organization
Disciplines on Fisheries Subsidies
3.2 Capacity Utilization and Target Capacity
The term “fully utilized” in the above definition refers to the normal unrestricted use of
fishing capacity.3 In practice, however, actual utilization may be lower, for example, due
to effort or catch limitations as a result of management measures. In this context, capacity
utilization corresponds to the ratio of actual output to the potential output of a given fleet or
biomass level, or as the ratio of actual to desired levels of fishing effort.
Closely related to the notion of capacity utilization is the concept of optimal or target
capacity. This is usually defined as the level of either output or inputs required in the short
term to meet specific management objectives in a given fishery, be they social, economic, or
environmental. For instance, if the goal is to maximize the amount of output, countries may
decide to use MSY as a target output capacity or define the fleet size required to achieve MSY
as a target input capacity. In practice, several countries use more conservative reference points
(e.g., 80% of the MSY estimate) to account for uncertainty in stock assessments. Similarly, if
the objective is to maximize the economic profitability in a particular fishery, the maximum
economic yield (MEY) may be used instead as a reference point to define target capacity
through limitations on catches or fishing effort (FAO, 2008). Alternatively, target capacity may
be defined in terms of social indicators such as employment levels in the sector.
3.3 Excess Capacity vs Overcapacity
Excess capacity and overcapacity are assessed by comparing actual and target capacities.
Excess capacity occurs when some capital is underutilized, i.e., when fewer vessels could
potentially have achieved the same amount of catch or landings. This is essentially a short-
term phenomenon that depends on environmental or economic factors. For example, as
stocks fluctuate over time, a particular fishery may show excess or full capacity depending on
the year. Similarly, market conditions, including price variations, may result in a fleet showing
excess capacity in certain years and not in others.
Overcapacity, by contrast is a longer-term problem and reflects a mismatch between the
actual resources used in a particular fishery and those needed to achieve a certain amount of
output or inputs as defined by management objectives (FAO, 2008). Biologically, overcapacity
can be expressed as a capacity level that, if fully utilized, generates a mortality rate that
reduces the stock biomass below MSY levels. From an economic point of view, overcapacity
occurs when fully utilized capacity reduces yields below MEY levels. To be clear, temporary
underutilization of resources does not necessarily indicate overcapacity (Porter, 1998).
3 It should be noted, however, that this does not necessarily correspond to maximum utilization. For example, in
a fishery that is open for 365 days a year, vessels may only operate for 260 days on average, because markets are
closed on weekends or because vessels need to undergo maintenance and repair.
IISD.org/gsi 5Assessing and Managing Fishing Capacity in the Context of World Trade Organization
Disciplines on Fisheries Subsidies
3.4 Overfishing and Overfished Stocks
In the absence of effective management of fishing capacity, overcapacity generally leads
to overfishing and ultimately results in the stock(s) being overfished. From a biological
perspective:
• Overfishing occurs when too many fish are harvested and what is left after harvesting
cannot replace what is taken or, in technical terms, when fishing mortality (F) exceeds
the maximum level that the stock can withstand on a sustainable basis (Fmsy). In
Figure 1, this corresponds to the situation where F/Fmsy is above 1.
• A stock is overfished when it is reduced to the point where it cannot produce the MSY
anymore or, in technical terms, once the biomass—defined as the weight of all the fish
of one specific stock in the water (B)—has fallen below the level that enables a fish
stock to deliver the MSY (Bmsy). In Figure 1, this corresponds to the situation where
B/Bmsy is below 1.
In other words, overfishing occurs when the total number of dead fish is greater than the MSY.
The term “overfished” describes the situation when the stock(s) or biomass is too small to
produce the MSY anymore.4
Figure 1. Overfished vs overfishing: the Kobe plot
2
Overfishing Overfishing
Overfished Not Overfished
F/Fmsy
1
Not Overfishing Not Overfishing
Overfished Not Overfished
0 1 2
B/Bmsy
Source: Author diagram, based on data from FAO.
4 In the absence of an internationally agreed definition, this is the most common approach to identifying what
constitutes an overfished stock. However, various fisheries management authorities can use different variations of
the B/Bmsy ratio as the limit for a stock to be considered as overfished. The FAO itself, is sometimes using 0.8 (or
80% of Bmsy) as the limit (see for example, http://www.fao.org/3/ca4355en/ca4355en.pdf).
IISD.org/gsi 6Assessing and Managing Fishing Capacity in the Context of World Trade Organization
Disciplines on Fisheries Subsidies
4.0 Managing Fishing Capacity
Paragraph 19 of the IPOA-Capacity calls on member states to develop, implement, and
monitor national plans of action (NPOAs) to manage their fishing capacity (FAO, 1999). The
objective consists of providing a framework for defining management goals and objectives;
assessing current and target fishing capacity for each fishery; identifying mechanisms to
achieve target capacities; and monitoring capacity through effective data collection. In
cases where stocks are straddling or highly migratory and therefore shared among different
members, paragraph 25 calls on states to “cooperate, where appropriate, through regional
fisheries organizations or arrangements … with a view to ensuring the effective management
of fishing capacity.”
From a WTO perspective, such mechanisms would enable coastal members to avoid
overcapacity and overfishing in their fleets and thus help to ensure their stocks are maintained
at a sustainable level based on MSY or alternative reference points. As highlighted above,
under the current draft of the consolidated text, a member that wanted to provide subsidies
that could contribute to overcapacity and overfishing would need to demonstrate that it
had measures in place that meant actual fishing was within sustainable limits. The same
conditionalities may also apply to members subsidizing fishing or fishing-related activities
targeting species managed by regional fisheries management organizations and arrangements
(RFMO/A) in the waters under their jurisdiction. For these reasons, identifying instances
of overcapacity and overfishing may become critical in the implementation of future WTO
disciplines. The following sections provide a quick overview of how this might be done
nationally according to FAO (2008) and related guidance.
4.1 Defining, Measuring, and Monitoring Target Capacity
As a first step in monitoring capacity, the FAO guidelines and related guidance call on
countries to clearly define their domestic capacity management goals and objectives. These
may include economic, social, or conservation objectives but also food security or export
earnings objectives. Because some of them may conflict with each other and involve trade-offs,
national strategies should clarify the relative priority accorded to each of them. With different
stakeholders often having different priorities, such a process should be as inclusive and
transparent as possible to secure broad-based buy-in as these objectives are translated into
capacity targets and ensure that the rationale behind them is apparent.
Once management objectives are set, target and current capacities should be assessed. For
example, if the objective is to maximize total profit, MEY would normally constitute an
appropriate target capacity level. MSY would usually be used as a target when the goal is to
maximize catches. Finally, if the main objective is to maximize employment, target capacity
could also be set at the open-access equilibrium. In practice, such assessments should be done
for each fishery separately, not least because overcapacity may differ from one fishery to the
other. Aggregated figures also mask the risk of capacity being transferred from one fishery to
another as management measures kick in.
IISD.org/gsi 7Assessing and Managing Fishing Capacity in the Context of World Trade Organization
Disciplines on Fisheries Subsidies
In order to reach the desired target capacity, national authorities would need to design and
implement appropriate management measures implemented through different types of
incentives or command-and-control mechanisms. This may be done either by managing the
level of fishing capacity directly (e.g., through limits on total catches, days at sea or season
length and subsequently reducing the fleet size) or indirectly by providing economic incentives
for fishers to control fishing capacity themselves (e.g., through the introduction of property
rights and removing the open access externality) (FAO, 2008).
Finally, once management objectives are set, target capacities are defined, and management
measures to achieve them are in place, monitoring fishing capacity requires the systematic
collection of a set of data regarding catches and fishing effort. In practice, the method used
to monitor capacity depends on the type of fishery and the kind of data available. This may
be particularly challenging in data-poor fisheries in developing countries with limited data
collection capacities. Keeping these challenges in mind, the Report of the FAO Technical
Consultation on the Measurement of Fishing Capacity (FAO, 2000) identifies four levels
of information necessary for ongoing measurement and assessment of fishing capacity, with
higher levels corresponding to more complex methods. These different levels are briefly
summarized in Table 1.
Table 1. Levels of data availability
Level Data availability
0 Little or no quantitative data
1 An estimate of total landing plus Minimum standard
• In vessel-based fisheries: estimated total vessels
• In non-vessel-based fisheries: either number of
→ needed for
estimation of fishing
participants or a measure of total gear units in use capacity
2 Level 1 plus
• An index of vessel size or power
• Gear type
• A rough index of trends in fishing success
• Rough measures of total time spent fishing and
maximum potential time that could be spent fishing
per year or per season, under normal operating
procedures
• Basic relevant characteristics of fishing operations
(e.g., seasonality, use of fish-aggregating and
fish-finding devices, (e.g., sonars, FADs, satellite
tracking), autonomy of vessels, trans-shipment
practices)
IISD.org/gsi 8Assessing and Managing Fishing Capacity in the Context of World Trade Organization
Disciplines on Fisheries Subsidies
Level Data availability
3 Level 2 plus
• Total catch (landings and discards), split by fleet
sectors
• Basic biological information: e.g., resources
distribution, catch by species, size structure, rough
estimate of potential MSY
• Comprehensive primary vessel characteristics Desired standard for
determining fishing power (e.g., GRT/GT or other
volume measures, power (kW), fish hold capacity,
→ the estimation of
fishing capacity
vessel age)
• Comprehensive information on gear type and
dimensions
• Prices or revenues by major species
• Detailed effort and cost per unit effort (CPUE) data,
including time spent fishing
4 Level 3 plus
• Detailed biological information on fish stocks (e.g.,
estimated biomass, fishing mortality rates, age/size
structure)
Long-term desired
• Comprehensive data on other important features
level, particularly
such as information on fish-aggregating and fish-
finding devices, fish hold capacity, skipper and crew
→ for high-volume
or high-impact
skill levels, fuel consumption, autonomy of vessels,
fisheries
processing capacity, costs and earnings surveys,
prices, value of capital stock, employment, subsidies
and economic incentives, and fishing operations
relative to fish distributions
Source: FAO (2000).
4.2 Indicators to Assess Overcapacity
As governments monitor their domestic fishing capacity, several indicators can be used to
identify instances of overcapacity. At the broadest level, overcapacity occurs when the current
capacity expressed in fishing inputs (number of vessels and days spent fishing at sea, for
example) or in catches is inconsistent with the target capacity—e.g., if the current fleet is
greater than the target size. More specifically, the quantitative approaches for measuring
capacity include: rapid appraisal (RA) techniques, peak-to-peak analysis, stochastic
production frontiers (SPF), data envelopment analysis (DEA) and biological, bioeconomic &
multi-objective modelling (FAO, 2003).
In addition to purely quantitative indicators such as those defined in Table 1, one or a
combination of qualitative indicators may also be used (Table 2). This may be important in
cases where resources to undertake more in-depth research are limited or when there is a need
to act rapidly to address urgent overcapacity problems.
IISD.org/gsi 9Assessing and Managing Fishing Capacity in the Context of World Trade Organization
Disciplines on Fisheries Subsidies
Table 2. Qualitative assessment of overcapacity
Qualitative indicator Signals of potential overcapacity
Biological status of a fishery Declining
Catch per unit effort Decreasing
Value per unit effort Decreasing
Conflict Increasing, between and within sectors/segments
Compliance Decreasing
Ratios
Harvest/target catch Growing as fishers race to harvest and overfish
Target or total allowable catch (TAC)/ Increasing as season gets shorter and shorter
Season length
Other measures
Profitability Declining
Fleet Aging
Latent permits Increasing as fishers are not bothering to fish
Source: based on FAO (2008).
According to the FAO (2008), qualitative indicators of overcapacity can include the biological
status of a stock (e.g., if the stock is overfished); repeated instances of non-compliance with
regulations and conflicts within the sector; “race for fish” phenomenon where fishers exhaust
their TAC before the end of the season; unused permits; or decline in average profitability of
a fleet. Another useful indicator is the catch per unit effort (CPUE) which corresponds to the
quantity of fish caught with one standard unit of fishing effort (e.g., weight of fish, in tons, per
hour of trawling). CPUE is often considered as an indicator of biomass or index of abundance.
Generally, a decline over time in CPUE tends to indicate a decrease in the size of a particular
stock, possibly as a result of overfishing and overcapacity.
4.3 Multi-Species Fisheries and Artisanal, Small-Scale
Fishing
Most of the approaches highlighted above are, in principle, relatively easy to apply in fisheries
made of a single fleet using one type of gear that targets a single species in a specific area.
Defining, measuring, and monitoring capacity in multi-species fisheries or multi-fleet fisheries
poses a set of additional challenges. Input-based capacity targets, for example, need to go
beyond the number of vessels to reflect the variety of gear used. Establishing output-based
targets also needs to be done differently in situations where achieving MSY or alternative
reference points for all species simultaneously is almost impossible. In fisheries where many
different species are targeted, or taken, at once, some experts suggest focusing assessments on
IISD.org/gsi 10Assessing and Managing Fishing Capacity in the Context of World Trade Organization
Disciplines on Fisheries Subsidies
the health of critical indicator species to assess the overall health of the ecosystem around the
fishery (Headley, 2020). Assessing overcapacity in multi-species fisheries is also more complex.
With some species being potentially overexploited while others remain within sustainable
limits, traditional stock status estimates provide only part of the picture needed to assess
whether a fleet is over capacity with respect to the resources it exploits. In those situations,
the use of qualitative indicators such as those described above may nevertheless provide
indications over time that overcapacity is occurring (e.g., when conflicts increase, catch limits
are met very quickly or CPUE declines continuously).
Assessing capacity in data-poor fisheries, which are frequently small-scale and artisanal
fisheries, also presents particular challenges. Estimates of stock status and of fleet capacity in
these circumstances can be out of date and being data-poor, involve high levels of uncertainty.
In these situations, the use of carefully selected qualitative data, including fishers’ own
knowledge, can help to supplement quantitative information available about the fishery
(Headley, 2020).
4.4 High Seas Fishing, Migratory Species and Straddling
Stocks
Another complication occurs in cases of straddling stocks, highly migratory species, or fishing
in open access areas, which include areas within EEZs and on the high seas. For migratory
species or stocks straddling across different EEZ, defining target capacity would need to
take into account fishing activities taking place in other jurisdictions. Such activities may be
subject to conflicting target fishing capacity, reflecting different management objectives across
different EEZ (e.g., MEY vs. MSY). In these situations, the FAO IPOA-Capacity calls for
RFMOs to play a role in coordinating the definition, measurement, and monitoring of fishing
capacity in the waters and for the species under their respective jurisdictions. In the case of
high seas fisheries, however, there are no established rules, so governments will likely need to
find a way to cooperate to limit capacity of fleets fishing in particular areas or for particular
species to increase the profitability of the capacity that is retained. In the context of the WTO
negotiations, the draft consolidated text includes specific prohibitions on subsidies to fishing
on the high seas outside the competence of an RFMO. The proposed rule does not include an
exception allowing members to prove stocks are healthy, likely because doing so for fleets and
stocks on the high seas in the absence of RFMO oversight would be impracticable.
IISD.org/gsi 11Assessing and Managing Fishing Capacity in the Context of World Trade Organization
Disciplines on Fisheries Subsidies
5.0 Assessing Global Fishing Capacity: An
overview of internationally available data
This section provides examples of existing datasets to measure fishing capacity for illustration
purposes. Despite significant progress in gathering information about the size and
composition of the world’s fishing fleet, data regarding global fishing capacity remains sparse
and important gaps persist. On the one hand, technological progress, including the use of
automatic identification systems (AISs), has allowed the generation of critical data on the
behaviour of the larger components of the industrial fleet (see, e.g., Pew Charitable Trusts,
n.d.). At the same time, the size and impact of the artisanal fishing fleet—and particularly
unpowered artisanal vessels in developing countries—remain largely unknown, with many
governments collecting data only on industrial fishing. By compiling data from different
sources, recent work by Rousseau et al. (2019) attempts nonetheless to reconstruct vessel
numbers, engine power, and effort of the global marine fishing fleet in both the artisanal and
industrial segments of the sector.
Based on this dataset, Figure 2 provides an overview of the evolution of global fishing capacity
between 1950 and 2015. It shows the growth in total number of vessels broken down by
industrial and artisanal including powered and unpowered artisanal vessels. The second part
of the graph illustrates the growth in engine power between 1950 and 2015 and the respective
share of artisanal and industrial fishing.
Figure 2. Evolution of global fleet capacity 1950–2015
Number of vessels Engine power
4 160
3.5 140
3 120
Powered
2.5 100
industrial
(Millions)
Industrial
(GW)
Powered 2 80
artisanal Artisanal
1.5 60
Unpowered
1 40
0.5 20
0 0
1950 1980 2015 1950 1980 2015
Source: Author’s elaboration based on Rousseau et al. (2019).
IISD.org/gsi 12Assessing and Managing Fishing Capacity in the Context of World Trade Organization
Disciplines on Fisheries Subsidies
Overall, the number of vessels grew from 1.7 to 3.7 million between 1950 and 2015 of which
68% are motorized.5 While unpowered artisanal vessels declined by roughly 15% during this
time, this was largely compensated by a steep increase in the number of powered artisanal
and industrial vessels. Similarly, engine power of the global fleet grew more than sevenfold
between 1950 and 2015 from 19.5 gigawatts (GW) to 145.9 GW, with artisanal fishing
becoming more prevalent, as the growth of industrial fleets slowed down over the last three
decades. As illustrated in Figure 3 and 4, the increase in the number of vessels and engine
power varies significantly across regions.
Figure 3. Evolution of fishing vessels by region and type of fishing
1950
South East
1980
Asia
2015
1950
North East
1980
Asia**
2015
1950
Indian Peninsula 1980
2015
1950
Sub-Saharan
1980
Africa
2015
1950
South America 1980
2015
1950
Central America
1980
& the Caribbean
2015
1950
Magreb &
1980
Middle East
2015
1950
Europe* 1980
2015
1950
Oceania 1980
2015
1950
North America 1980
2015
0 200 400 600 800 1,000 1,200 1,400 1,600
Number of fishing vessels (thousands)
Unpowered artisanal Powered artisanal Powered industrial
* Including Russia
** Includes China, Japan, Chinese Taipei, and Korea
Source: Author’s elaboration based on Rousseau et al., 2019.
5 These figures are lower than the FAO estimate of 4.6 million for 2014 and 2015: see FAO (2018).
IISD.org/gsi 13Assessing and Managing Fishing Capacity in the Context of World Trade Organization
Disciplines on Fisheries Subsidies
Figure 4. Evolution of engine power by region and type of fishing
1950
South East
1980
Asia
2015
1950
North East
1980
Asia**
2015
1950
Indian Peninsula 1980
2015
1950
Sub-Saharan
1980
Africa
2015
1950
South America 1980
2015
1950
Central America
1980
& the Caribbean
2015
1950
Magreb &
1980
Middle East
2015
1950
Europe* 1980
2015
1950
Oceania 1980
2015
1950
North America 1980
2015
0 5 10 15 20 25 30 35 40 45
Motor power (GW)
Artisanal Industrial
* Including Russia
** Includes China, Japan, Chinese Taipei, and Korea
Source: Author’s elaboration based on Rousseau et al., 2019.
While overall vessel numbers decreased in Europe, North America, and North East Asia due
to a decline in the number of artisanal boats, figures in all other regions show increases in
the size of domestic fleets. This is particularly the case in South East Asia and Sub-Saharan
Africa, which saw fleets grow more than sixfold and fivefold, respectively. With the exception
of Sub-Saharan Africa, it is interesting to note that the decline in unpowered artisanal
vessels went hand in hand with a rapid increase in powered artisanal vessels, mostly as a
result of modernization efforts. However, as illustrated in the second graph, the evolution
in size of the different fleets is not necessarily commensurate with total engine power. This
is particularly clear in the case of North East Asia, Europe, and North America, where
a relatively smaller number of boats account for a proportionately larger engine power
compared to all other regions.
IISD.org/gsi 14Assessing and Managing Fishing Capacity in the Context of World Trade Organization
Disciplines on Fisheries Subsidies
More recent estimates by the FAO indicate that in 2018, the global fleet, including non-
motorized boats to large industrial vessels, reached 4.56 million vessels with Asia accounting
for 68% of the total, followed by Africa, with 20% of total vessels, and the Americas, with 10%.
Overall motorized vessels represented 63% of the total fleet in 2018 (FAO, 2020).
Using AIS data extracted by Global Fishing Watch, the Pew Charitable Trust (n.d.) recently
published a unique data set measuring fishing effort across the world both in terms of kWh
and the number of fishing hours. This was made possible thanks to advances in satellite
technology, cloud computing, and machine learning, which increasingly allow for near real-
time tracking of fishing activities. It should be noted, however, that vessels using AIS tend
to be larger and more capital-intensive vessels.6 This technology may therefore overlook a
significant share of artisanal and small-scale fishing activities.7 It nonetheless provides an
interesting albeit partial picture of the geographical spread of fishing efforts by the larger scale
segment of the global fleet.
Alternatively, as highlighted in Section 3.1, fishing capacity can also be measured in terms of
outputs. Data from The Sea Around Us project at the University of British Columbia provides
estimates of global fishing catch, by scale of fishing, in specific geographic maritime areas,
and for specific groups of countries and by region. The data covers both officially reported
catch and estimates of unreported catch and discards. It also provides a breakdown by type
of fishing, namely subsistence, artisanal, recreational, and industrial fishing based on national
definitions (The Sea Around Us, n.d.).
Assessing whether global fisheries suffer from overcapacity requires comparing existing
capacity with the amount of resources available. This may be estimated in different ways by
using indicators of fishing effort (an input approach) or production (an output approach).
At the broadest level, the FAO estimates that the percentage of stocks fished at biologically
unsustainable levels increased from 10% in 1974 to 34.2% in 2017 (FAO, 2020) indicating
a continuous decline in the state of marine resources and clear signs of overcapacity. Using
a bioeconomic model treating global marine fisheries as one single fishery, the World Bank
estimates that the sector suffered an economic loss of USD 83 billion in 2012 compared to a
situation where global catches would be situated at the maximum economic yield equilibrium
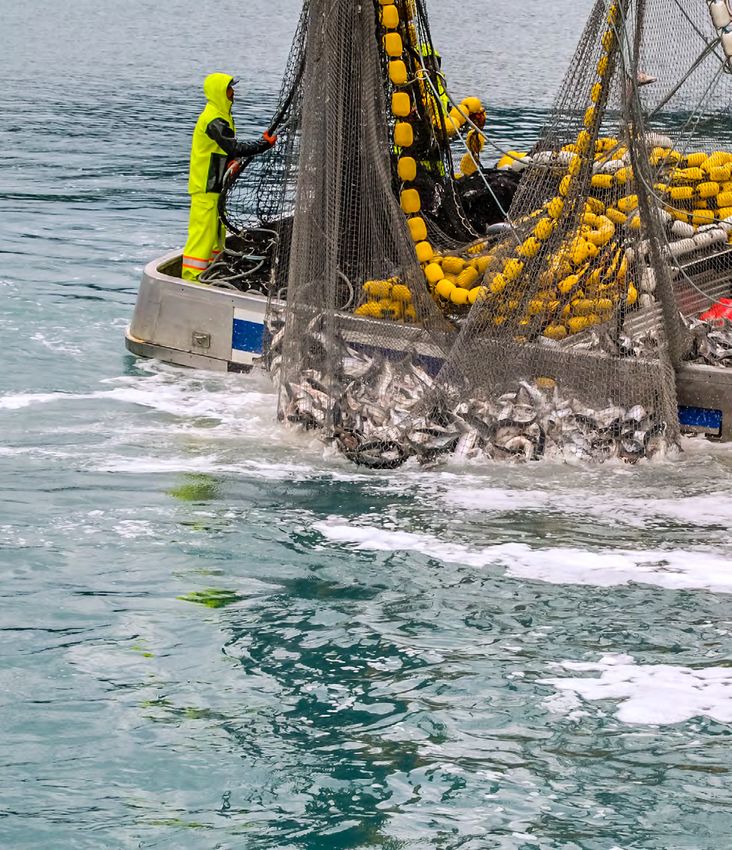
(MEY) (World Bank, 2015). Finally, Rousseau et al. (2019) compare the evolution of CPUE
and stock abundance of the global fleet since 1950 as indicators of overcapacity. CPUE is
measured in both nominal and effective terms, assuming a 2.6% increase in technological
creep per annum.
6 Data from Global Fishing Watch covers all vessels equipped with AIS transponders, and some vessels with vessel
monitoring system (VMS) transponders. It covers more than 300,000 vessels with country designation based on
the flag the vessel is registered under. In terms of fishing effort, this corresponds to more than 50% of all fishing
effort beyond 100 nautical miles from shore and as much as 80% of the fishing in the high seas.
7 It should also be mentioned that while developed countries have often adopted regulations to enforce use of AIS
on vessels (in many cases over 15 metres) developing countries have not done so at a similar level, and therefore
are de facto under-represented. Finally, AIS reception is quite poor in important portions of the ocean—and often
in areas where vessel density is high—impeding reliable global comparisons among areas. For further details on
AIS, see the Global Atlas of AIS-based fishing activity which assesses the potential of AIS but also describing its
limitations and caveats (FAO, 2019).
IISD.org/gsi 15Assessing and Managing Fishing Capacity in the Context of World Trade Organization
Disciplines on Fisheries Subsidies
Figure 5. CPUE and stock abundance by region (1950–2015)
Source: Rousseau et al., 2019.
The data shows a systematic decline in both CPUE and stock abundance in virtually all the
regions. This decrease has happened as the global fishing fleet continued to expand in terms
of vessel number and engine power, as described in Figure 2, clearly indicating a problem of
overcapacity.8 However, it should be noted that this global decline hides contrasting situations
between areas, with improvements in stock status in areas with effective management policies
(FAO, 2020). For a more disaggregated approach, the Global Record of Stocks and Fisheries
(GRSF) developed under the Fisheries and Resources Monitoring System (FIRMS) umbrella
with Ram Legacy database and FishSource (iMarine, n.d.) provides information on the status
of more than 1,800 stocks. This number will soon go over 2,000 stocks when all records are
validated and available online.
8 One needs to be careful about using decline in abundance though. It is arguably normal to expect a decline in
CUPE as one moves from virgin stocks in the 1950s to those of the late 1970s. The critical story is the one that
happened since then. There, flattening of the decline in abundance tells a story that there may likely be some gains
due to improved management, as in Europe, Latin America, and North America. The fact that effective capacity
has also declined and then flattened in some cases (usually before abundance stops declining) is also a sign of
managing fishing capacity, as seen in Europe and North America.
IISD.org/gsi 16Assessing and Managing Fishing Capacity in the Context of World Trade Organization
Disciplines on Fisheries Subsidies
6.0 Conclusion
Available evidence suggests that global fisheries suffer from overcapacity and overfishing. As
a result, the sector has seen a continuous decline in productivity, threatening not only the
sustainability of stocks but also employment, livelihoods, and food security. Since the early
1990s, excessive fishing inputs and overcapitalizations have highlighted the need to manage
the fishing capacity of the global fleet. Elaborating on the UNCLOS obligation to manage
resources in order to prevent overexploitation, this concern gave birth to the FAO IPOA-
Capacity in 1999, Technical Guidelines for Capacity Management, and technical guidance to
assess, measure, monitor, and transition away from overcapacity.
The causes of overcapacity and overfishing are varied. Among them, however, it is widely
recognized that fisheries subsidies that reduce the cost of fishing and enhance revenue
contribute to the buildup of fishing overcapacity and ultimately the depletion of fish stocks.
As part of ongoing WTO negotiations on fisheries subsidies, members are considering
prohibiting some of the most harmful forms of support. In particular, the draft consolidated
text, which forms the basis of current talks, envisages the prohibition of subsidies to those
fishing overfished stocks in some circumstances and to subsidies that contribute to overfishing
and overcapacity. The draft text nonetheless envisages exceptions in cases where members can
demonstrate that certain management measures are in place to return, or to maintain, stocks
at biologically sustainable levels. If these exceptions remain in the final agreement, members
wanting to use them to continue providing otherwise-prohibited subsidies will need to think
through how to measure their existing fishing capacity and how this relates to the resources
being exploited. Members may also, of course, choose to redesign their subsidy measures so
they do not fall within the category of prohibited subsidies at all.
Ensuring they are compliant with the new rules, including a possible exception will likely
require members to define capacity management goals and objectives; assess their current
and target fishing capacity for each fishery; identify mechanisms and policy measures to
achieve the respective target capacities; and monitor these through effective data collection
to ensure stocks are healthy. Existing FAO guidelines provide specific guidance on how to
do this. In particular, members may have to pay special attention to preventing or reducing
any overcapacity that may exist in domestic fleets. This will require enhanced data collection
but also the use of qualitative indicators to assess instances of overcapacity. This process is
likely to be more challenging in multi-species fisheries as found in numerous developing
countries and for the small-scale artisanal segment of the sector, in particular because of a
lack of reliable data.
In recognition of this, the chair’s draft consolidated text already includes some provisions
that aim to provide flexibility in how members demonstrate that the stocks in subsidized
fisheries are healthy. Dedicated technical assistance and capacity building may also be highly
beneficial in this area. In the case of straddling stocks and highly migratory species, capacity
management should be undertaken in close collaboration with relevant coastal states and the
relevant RFMO(s). Subsidies to fishing outside these areas may be prohibited outright under
the new agreement, but governments may find it useful to consider ways to cooperate to
manage capacity on the high seas anyway, for the profitability of these fleets.
IISD.org/gsi 17Assessing and Managing Fishing Capacity in the Context of World Trade Organization
Disciplines on Fisheries Subsidies
References
Food and Agriculture Organization of the United Nations (FAO). (n.d.). Code of conduct for
responsible fisheries. http://www.fao.org/3/v9878e/v9878e00.htm
Food and Agriculture Organization of the United Nations. (1999). The international plan of
action for the management of fishing capacity and selected issues pertaining to illegal, unreported
and unregulated fishing. fao.org/3/Y3274E/y3274e0f.htm
Food and Agriculture Organization of the United Nations. (2000). Report of the technical
consultation on the measurement of fishing capacity. Mexico City, Mexico, 29 November–3
December 1999 (FAO Fisheries Report No. 615). http://www.fao.org/3/a-x4874e.pdf
Food and Agriculture Organization of the United Nations. (2002). Report of the expert
consultation on catalysing the transition away from overcapacity in marine capture fisheries
(FAO Fisheries Report No. 691).
Food and Agriculture Organization of the United Nations. (2008). Fisheries management. 3.
Managing fishing capacity. FAO Technical Guidelines for Responsible Fisheries. No. 4, Suppl. 3.
Food and Agriculture Organization of the United Nations. (2018). The state of world fisheries
and aquaculture: Meeting the Sustainable Development Goals. http://www.fao.org/3/i9540en/
i9540en.pdf
Food and Agriculture Organization of the United Nations. (2019). Global atlas of AIS-based
fishing activity. http://www.fao.org/documents/card/fr/c/ca7012en/
Food and Agriculture Organization of the United Nations. (2020). The state of world fisheries
and aquaculture 2020: Sustainability in Action. http://www.fao.org/documents/card/en/c/
ca9229en
Headley, M. (2020) Determining the status of fish stocks in data-poor environments and multi-
species fisheries. International Institute for Sustainable Development. https://www.iisd.org/
publications/status-fish-stocks-data-poor-multispecies-fisheries
iMarine. (n.d.). Global record of stocks and fisheries map viewer. https://i-marine.d4science.org/
web/grsf/map-viewer
Pascoe, S. & Gréboval, D. (eds.) (2003). Measuring capacity in fisheries (FAO Fisheries
Technical Paper. No. 445). Food and Agriculture Organization of the United Nations.
http://www.fao.org/3/Y4849E/y4849e00.htm#Contents
Pascoe, S., Kirkley, J.E., Gréboval, D., & Morrison-Paul, C.J. (2003). Measuring and assessing
capacity in fisheries. Issues and methods (FAO Fisheries Technical Paper. No. 433/2). Food
and Agriculture Organization of the United Nations.
Pew Charitable Trusts. (n.d.). Global fishing effort. https://public.tableau.com/profile/the.pew.
charitable.trusts#!/vizhome/GlobalFishingEffort/FishingEffort
Porter, G. (1998). Too much fishing fleet, too few fish: A proposal for eliminating global fishing
overcapacity. World Wildlife Fund.
IISD.org/gsi 18Assessing and Managing Fishing Capacity in the Context of World Trade Organization
Disciplines on Fisheries Subsidies
Rousseau, Y., Watsona, R., Blancharda J., & Fulton E. (2019). Evolution of global marine
fishing fleets and the response of fished resources. PNAS, 116(25). https://www.pnas.org/
content/116/25/12238
The Sea Around Us. (n.d.). Home page. http://www.seaaroundus.org/
United Nations. (1982). United Nations Convention on the Law of the Sea. https://www.un.org/
depts/los/convention_agreements/texts/unclos/unclos_e.pdf
Ward, J.M., Kirkley, J.E., Metzner, R., & Pascoe, S. (2004). Measuring and assessing capacity
in fisheries. 1. Basic concepts and management options (FAO Fisheries Technical Paper. No.
433/1). Food and Agriculture Organization of the United Nations. http://www.fao.org/3/
y5442e/y5442e00.htm#Contents
World Bank. (2015). The sunken billions revisited: Progress and challenges in global marine fisheries.
https://www.worldbank.org/en/topic/environment/brief/the-sunken-billions-revisited-
progress-and-challenges-in-global-marine-fisheries
World Trade Organization. (2005). Ministerial Declaration: Doha Work Programme. https://docs.
wto.org/dol2fe/Pages/FE_Search/FE_S_S009-DP.aspx?language=E&CatalogueIdList=701
96&CurrentCatalogueIdIndex=0&FullTextSearch=
IISD.org/gsi 19Assessing and Managing Fishing Capacity in the Context of World Trade Organization
Disciplines on Fisheries Subsidies
Annex 1. Key FAO guidance material on
fishing capacity
Food and Agriculture Organization of the United Nations. (1998). Report of the FAO Technical
Working Group on the Management of Fishing Capacity (FAO Fisheries Report No. 586).
Food and Agriculture Organization of the United Nations. (2000). Report of the technical
consultation on the measurement of fishing capacity. Mexico City, Mexico, 29 November–3
December 1999 (FAO Fisheries Report No. 615). http://www.fao.org/3/a-x4874e.pdf
Food and Agriculture Organization of the United Nations. (2002). Report of the expert
consultation on catalysing the transition away from overcapacity in marine capture fisheries
(FAO Fisheries Report No. 691). FAO.
Food and Agriculture Organization of the United Nations. (2008). Fisheries management. 3.
Managing fishing capacity. FAO Technical Guidelines for Responsible Fisheries. No. 4, Suppl. 3.
Gréboval, D. (2003). The measurement and monitoring of fishing capacity: Introduction and major
considerations. Food and Agriculture Organization of the United Nations. www.fao.org/
docrep/006/Y4849E/y4849e02.htm
Pascoe, S. & Gréboval, D. (eds.) (2003). Measuring capacity in fisheries (FAO Fisheries
Technical Paper. No. 445). Food and Agriculture Organization of the United Nations.
http://www.fao.org/3/Y4849E/y4849e00.htm#Contents
Pascoe, S., Gréboval, D., Kirkley, J.E., & Lindebo, E. (2004). Measuring and appraising
capacity in fisheries: Framework, analytical tools and data aggregation (FAO Fisheries Circular
No. 994). Food and Agriculture Organization of the United Nations. http://www.fao.org/3/
y5443e/y5443e00.htm
Pascoe, S., Kirkley, J.E., Gréboval, D., & Morrison-Paul, C.J. (2003). Measuring and assessing
capacity in fisheries. Issues and methods (FAO Fisheries Technical Paper. No. 433/2). Food
and Agriculture Organization of the United Nations.
Ward, J.M., Kirkley, J.E., Metzner, R., & Pascoe, S. (2004). Measuring and assessing capacity
in fisheries. 1. Basic concepts and management options (FAO Fisheries Technical Paper. No.
433/1). Food and Agriculture Organization of the United Nations. http://www.fao.org/3/
y5442e/y5442e00.htm#Contents
IISD.org/gsi 20You can also read