Assessing health status of raptors in Scotland - Project funded by: National Birds of Prey Trust (NBPT) Centre for Ecology and Hydrology ...
←
→
Page content transcription
If your browser does not render page correctly, please read the page content below
Assessing health status of raptors in Scotland
                        Project funded by:
              National Birds of Prey Trust (NBPT)
          Centre for Ecology and Hydrology – Banchory

                      Preliminary Report
                      September of 2006

                                                   Jesús Martínez-Padilla
                            Centre for Ecology and Hydrology – Banchory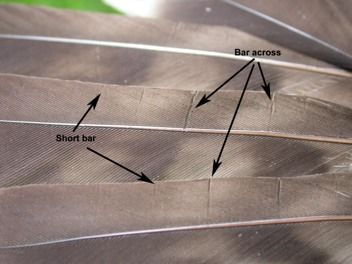
Introduction
It is very important for monitoring and conservation purposes to monitor in an easy and
reliable way the healthiness of uncommon / rare top predators, like raptors, in wild
populations. This is particularly crucial for species with small population size, which
might have reduced genetic variability and be more vulnerable to stresses, parasites and
diseases. However, prior to using new techniques on rare wild birds, it is important to
validate their usefulness and limitations on common species. The aim of the proposed
study is to investigate the usefulness of measuring blood parameters as total proteins,
carotenoids physiological stress levels and relative white blood cells counts and
parasites (ecto and endoparasites as well as and intestinal parasites) as reliable
indicators of raptor healthiness. To do so, we studied the common buzzard (Buteo
buteo). Buzzard populations have recently increased in the UK, particularly in Scotland,
where the study will be conducted and where the species is common. This makes this
species particularly appropriate for the validation of the proposed techniques. In this
report, we briefly report on some of the data collected in 2005 and 2006. We describe
the basic reproductive parameters of buzzards, some preliminary data about nest site
selection and some preliminary results about stress indexes during development (fault
bars) and nestling coloration. Additional information on the physiological and health
parameters will be available soon and the variables described below will be analysed in
relation to all coming results.

Material and Methods

Monitoring and breeding parameters

All the fieldwork was carried out in MacRobert Estate in 2005. In 2006, the field work
was also carried out in Forest of Birse, Birse Estate and Glen Tanar Estate. Occupied
territories were searched from April – May by the means of behavioural observations.
Preliminary observations were made from high points at early morning or late evening.
Birds that were callings, sitting at specific places, carrying branches or preys, or straight
flights to a forest at several times around a specific area were considered as potential
territory owners. Displays of birds were recorded and located in a map. Once a bird or a
couple was found several times around a specific place, observations were more focused
on this particular place to confirm territory occupancy. Subsequently, nest sites were
looked for in each territory by analysing the notes recorded during behavioural
observations and checking trees around the edges of the forests.

Nests were monitored using observations from a distance, using binoculars or a
telescope. When it was not possible to check the nests or nestlings, nests were visited
and the surroundings searched for prey remains, pellets and faeces under the nest.
Finding nestlings faeces on the ground indicated when nestlings were old enough to
climb the nest. Nests were visited before the nestlings where old enough to leave the
nest.

Trees were climbed up by using spurs, ropes and with the help of another person. It was
not possible to climb all trees up to the nest for safety reasons (windy or rainy days). On
several occasions, nests were located in very thin tress, in terminal branches or just at
the top of the tree and could not be visited.

Tree and habitat selection

We recorded the following information for each occupied nest (1) nest characteristics,
(2) tree species in which the nests were made and (3) characterization of the
surrounding area of the nest. Nests characteristics were recorded at nestling stage or
after breeding. When we were up the nests, we recorded with, length and high of the
nest in order to obtain a measure of volume of the nest material. The length of the rope
from the nest to the ground gave us a measure of the high of the nest. An approximation
of the distance from the nest to the top of the tree gave us a measure of the high of the
tree. Once chicks fledged, we visited every nest in order to record variables related to
the tree and related to the 15m surrounding area of the tree. For the first one we
recorded the specie of the tree, high, diameter and distance to border of the forest. High
of the trees were obtained when they were climbed. In addition, percentage and species
of fresh green provided by parents were also recorded.

About the surrounding area, we obtained the nearest distance to other trees, number of
tree species, diameter of the nearest tree, maximum high of the trees, percentage of
shrubs, percentage of trees and diameter of 5 randomly selected trees. All these
measurements were also taken, except those related to nest characteristics, in randomly
selected trees where buzzards were not breeding.

Finally, surrounding habitats in a ratio of 500 meters around the nests were sampled to
evaluate prey abundance, focused mainly in voles, mammals (rabbits and hares) and
birds. For voles, we followed the method described by Graham et al. (1995) carried out
in Scotland. We sampled each habitat in 10 randomly selected quadrats (25 * 25 cm),
examining for the presence of voles signs, indicating recent activity in the form of either
fresh vole faeces or fresh grass clipping. For birds and rabbits, we carried out transects
of 500m when possible to obtain a relative abundance of these species on each habitat.
Specifically for rabbits, in each transect we noted number of burrows, old and new
rabbit holes. Direct rabbit counting was also recorded. For birds, we used this same
transects and we focused the sampling in potential avian prey species of buzzards, as
pigeons, doves, starlings, thrushes, corvids, pheasants and grouse. All transects were
carried out early in the morning during the nestling period of buzzards.

Nestling measurements and blood sampling

In nests that were visited, nestlings were taken from the nest to the ground for a short
time. Birds were kept in a hang bag to minimise stress. When there was more than one
nestling in the brood, birds were kept in a bag during measuring a sampling the other
sibs. On the ground, nestlings were sampled with a hood on their head to minimise their
stress but allowing them breathing. This allowed avoiding potential pecks or to be taken
by their claws. All nestlings were analysed and measured on a waterproof surface. We
measured wing length to the nearest 1 mm and tarsus length to the nearest 0.1 mm, and
were weighed to the nearest 2 g. A blood sample of 2ml was taken from the brachial
vein, after cleaning the vein area with alcohol and cotton. A digital picture was taken
from their ventral area for a posteriori analyses of the proportion of dark feather
pigmentation in the whole area. No adverse effect was detected in any bird sampled.
After measurements and sampling, all birds were returned to their nests. We also looked
for and collected prey remains and pellets around the nest during the visits.

Blood analyses

From each blood sample collected, a drop of blood, kept in alcohol was used to
determine nestling sex by molecular procedures (Fridolfsson and Ellegren 1999) and to
determine prevalence of blood parasites. In addition, genetic analyses will determine the
prevalence of blood parasites (forthcoming further details).

Blood was kept refrigerated until centrifugation. Plasma samples were obtained by
centrifuging blood for 10 min at 10,000 rpm and were stored at –80dC until analyzed.
From plasma samples we will obtain measurements of carotenoids, total proteins,
albumin, cholesterol, triglycerides, urea and acid uric.

Carotenoids are being quantified by diluting 60 microliters of plasma in acetone (1:10).
The mixture was vortexed and centrifuged at 10,000 rpm for 10 minutes. The
supernatant was examined in a ShimadzuUV-1603 spectrophotometer and we
determined the optical density at 446 nm, the wavelength of maximal absorbance for
lutein (Mínguez-Mosquera 1993). Carotenoid concentrations will be calculated using
the described extinction coefficient for this carotenoid pigment in acetone (Mínguez-
Mosquera 1993).

The rest of biochemical parameters of plasma analyzed (total proteins, albumin,
cholesterol, triglycerides, urea and acid uric) are being measured using a
spectrophotometer (Hitachi 747, Tokyo, Japan) and commercial kits (Boehringer-
Mannheim Biochemica, Mannheim, Germany). Triglyceride concentration analyses
included free glycerol.

All samples are analyzing at the National Game Research Centre in Spain (Ciudad Real)
belonging to CSIC (British NERC equivalent). Due to how busy is the lab, the samples
will be ready in November.

Legs and cere colour measurements.

In order to obtain an external and easily evaluated measure of bird healthiness, we
measured colour variation of legs and cere of bills using digital photographs (van Oort
and Dawson 2005, Villafuerte and Negro 1998). High resolution (2272 ×1704 pixels)
lateral pictures of the cere and legs were taken (Picture 1 and 2). Pictures were taken a
standard distance from the bird (40 cm) by using the illumination provided by a flash
incorporated to the digital camera (Nikon Coolpix 950ZS). For each photograph, we
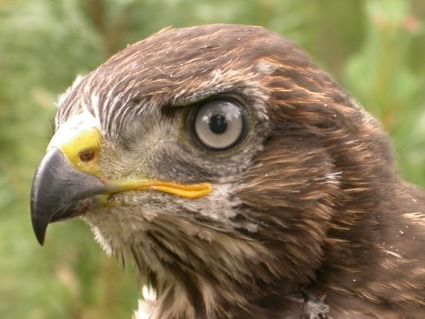
placed a yellow reference next to leg or cere, which provided a color reference balanced
in the red, green and blue that was used for standardizing all photographs (see
Villafuerte and Negro 1998). We analysed digital images using Adobe Photoshop 7.0,
measuring the average component of red (R) subtracting the G and B (RGB system)
component of the cere and legs.

Picture 1. The picture shows a sample of how digital photographs were taken. Note that in both cases the
reference was placed beside the object pictured. Cere of the bill (a) and leg (b) are shown.

Fault bars

For the same reason that color measurements were obtained, we tried to explore the
meaning of fault bars, a trait that may affect nestling fitness (Bortolotti et al. 2002).
Primaries, secondaries in both wings and tail feathers wer inspected for the presence of
fault bars. We categorized each fault bar as short bars (absence of some barbules
producing a visible discontinuity on the structure of the feathes), bars across (a narrow,
i.e. 1 mm, translucent line across the feathers), or holes (translucent holes across the
feather; see Picture 2 for more details). In extreme instances, fault bars produced the cut
of a portion of the vane from its position up to the distal edge of the feather. We
recorded whether or not each fault bar produced breaking of feather barbules.
Picture 2. Sample of fault bars. Short bars and bars across are given.

Stress measurements

This measure is analyzing at the University of Saskatchewan (Canada). Because the
method is under review right now in a very prestigious journal (Nature) I cannot give
details about the method employed to measure stress in nestlings until published. About
half of the samples are analysed, but problems with a machine during other analysis are
delaying the results of the rest of the samples. This problem is sorting out and will be
included in the final report.

Statistics

Logistic regression model by stepwise backward procedure was performed to compare
surrounding characteristics of trees with nest (occupied) and trees without nests
(control). GLM models were performed to explore relationships between breeding
parameters and nests characteristics. All analyses have been carried out with the
statistical software package SAS 9.0.

Dependent variables related to nestlings were fitted in General Linear Mixed Models
(GLMM) with nest as random variable to avoid pseudoreplication in SAS 9.0 software.
Because data was obtained from to different years and areas, both were considered as
factors in all models for the same reason described before. When any variable of colour
was considered as dependent variable, the values obtained for the reference were used
as covariates in all models.
Results and discussion

Breeding parameters
Overall, 50 (2005: n = 25; 2006: n = 25) territories were monitored in all the estates in
2005 and 2006. In one of the estates (MacRobert), 14 territories were active both in
2005 and 2006. Only 50.0% of the territories (n = 7) fledged at least one nestling both
years. In addition, one breeding pair in 2005 was found out, but close to one of the
estates. This nest was excluded from the next analyses. We were able to find 41 active
territories. From them, 62.0 % (n = 31) fledged at least one nestling. The mean hatching
date was 20th of May (range 29th of april – 28th of May). Brood size at fledging was 1.83
(range between 0 and 3) and considering only successful nests, brood size was 2.1.

                                 2005                                 2006
                   MR        B          FB    F        MR        B           FB         F    Total
 Territories        25       -          -     -         16       3           5          1      50
  Breeding          15       -          -     -         10       0           5          1      31
 No breeding        3        -          -     -             3    1           0          0         7
    Indet.          6        -          -     -             3    2           0          0      11
   Table 1. Number of territories and breeding success in the monitored areas. MR: MacRobert
   estate; B: Birse estate; FB: Forest of Birse; F: Finzean.

However, forest work carried out in on of the study sites (MacRobert) probably
influenced on breeding success mainly on 6 territories. From them, 2 were able to rear
chicks (although one tree with the nest was cut down when the chicks were about two
weeks old), and in 4 of them, parents displayed around (defending and calling) even
after the forest works, despite the tree of the nest was cut down. It suggests, that forest
work affected breeding in buzzards negatively.

Nest site selection
From the 41 active territories, we found a total of 83 nests. It means an average of 2.02
nests per territory. From the 31 successful territories in breeding, we were not able to
find the nest in one of them and only two nests were used in 2005 and 2006. Only
climbed nests (n = 28) were used for the following analyses (see methods). The mean,
error and range of variance of the variables considered for nest characteristics and
surrounding are summarised in Table 2. Only in two territories, the same nest was used
in both years, so only one nest was taken into account in the following analyses.

                  Variable                   N     Mean          sd               Max       Min
              Nest high (cm)                 28     50.34       22.43             100        25
              Nest width (cm)                28     71.00       20.77             100        35
              Nest length (cm)               28     88.96       25.46             140        40
             Nest volume (cm3)               28   384575.90 331220.40         1170000       40000
         High of the nest (m)                28      9.82      3.78             19.2           4
         High of the tree (m)                28     13.25      4.02              20            7
       Diameter of the tree (cm)             28     115.37    39.54             260           70
          Nearest tree (m)                   28      3.50      2.01              11            1
Number of tree species 28 2.18 1.15 5 1
Maximum height (m) 28 15.25 4.38 25 8.4
Shrubs (%) 28 9.29 15.61 50 0
Tees (%) 28 48.57 16.26 80 20
Average diameter (cm) 28 90.24 23.25 146.2 47
Table 2. Characterization of buzzard nests in 3 different states in Scotland in two different
years.
Scotch pine (Pinus syvestris) was the main tree species used for building nests (Figure
1). In order to know how a tree is selected to breed, a logistic regression model
suggested that none of the variables considered was significantly related to the
dependent variable.
Figure 1. Tree species selected by
buzzards for breeding.
Occupied Control Statistics
Variable Mean sd Mean sd F p
Shrubs (%) 9.29 15.6 24.29 27.93 2.73 0.106
Trees (%) 48.57 16.27 38.66 27.42 1.58 0.217
Distance to the nearest tree (m) 3.50 2.02 5.29 7.66 0.85 0.363
High of the tree (m) 13.25 4.02 11.73 4.30 0.54 0.466
Maximum height (m) 15.25 4.39 15.00 2.97 0.22 0.645Number of tree species 2.18 1.16 1.99 0.73 0.19 0.657
Average diameter (cm) 90.24 23.25 82.87 29.43 0.05 0.834
Diameter of the tree (cm) 115.38 39.54 88.26 30.56 0.71 0.969
Table 3. Logistic regression for nest site selection of breeding buzzards in 3 different estates in NE
Scotland. Area was considered as random variable.
It suggests that the variables considered did not influence nest site selection. Buzzards
seem to use available trees for nesting without particularly selecting certain type of
trees. However, other variables not considered could have influenced nest site selection.
At the moment, we are analysing and extracting some other variables from a
Geographic Information System (GIS) such as distance to the nearest house, to the
nearest path, nearest road, and within each territory: percentage of forest, grass and
cultivate land. Just, percentage of shrubs may influence nest site selection.
Analysing productivity (number of nestling fledged), we found that nest surface was a
good predictor of productivity (GLMM, F1,42 = 18.94, p < 0.001, year as covariate, p =
0.02). The relationship suggested that more nestlings fledged from bigger nests (Figure
2). Marginally significant, a positive relationship was found between productivity and
percentage of green (GLMM, F1,30 = 3.47, p = 0.072 ).
Figure 2. Relationship between nest
surface of buzzard nests and number
of fledglings.
However, considering also the variables summarised in Table 2 as explanatory
variables, that is surrounding characteristics, we found that productivity was related
positively to nest surface (F1,26 = 11.33, p = 0.002) and heigh of the highest tree (F1,26 =
12.05, p = 0.002). It was negatively related to distance to the edge (F1,26 = 10.83, p =
0.003), percentage of shrubs (F1,26 = 19.58, p < 0.001) and distance to the nearest tree
(F1,26 = 8.11, p = 0.009; Figure 3). Also, the negative relationship between productivity
and percentage of green on the nests became significant when all variables were
considered (F1,26 = 4.68, p = 0.039).Figure 3. Relationship between number of
fledglings of buzzards and distance to the
nearest tree
Because of the low number of unsuccessful pairs, our data does not allow us compare
failed versus successful nests (characteristics or surroundings) or territories.
These results suggest that nest surface is a good predictor of the number of fledglings
reared by each pair. This might be because bigger nests belong to pairs that are more
experienced and have bred previously in the same nest. We did not information about
the change in surface before laying to the end of the nestling period. This would allow
to know if buzzards parents adjust their effort in building their nest according the
nestling they may rear or not. Further work may suggest if nest size acts as a signal of
brood size within the breeding season. In addition, our results suggests a common
pattern in buzzards, were breeding areas are selected avoiding deep forests and breeding
at the edge of the forests.
Cere and leg coloration.
The best model that explains the variance of cere coloration under RGB system suggests
that more yellow-pigmented cere are associated to nestling body mass (GLMM, F1,26 =
14.24, p < 0.001) and a tendency to higher proportion of fresh green vegetation on the
nest (GLMM, F1,26 = 4.16, p = 0.071). This relationship was independent of ther rest of
the variables considered, including nestling age (all p > 0.24). Results from parasites
and carotenoid levels will help to better understand this relationship, but it suggests at
least that cere of bills become more yellow as nestling gain weight. Also, biochemical
parameters may suggest more about the meaning of these relationships.
Yellow coloration of legs, we do not find any relationship with the variables considered
(all p > 0.17). It suggests that legs and cere may suggest different things and maybe it is
related to the way in which pigmentation is allocated on this two traits. Our futureanalyses will soon suggest a more accurate evaluation of the meaning of both signals
and in relation to their health status.
Fault bars.
Fault bars were widely distributed in all wing and tail feather but a higher abundance
was found in the inner feathers. Considering all categories of fault bars, the last 3
primaries and the first 3 secondaries meant the 56% of total of fault bars. Between
categories, these 6 feathers grouped the 32%, 64% and 56% of the total of holes, bars
across and short bars respectively.
Figure 4. Distribution of fault bars in
feathers of buzzard nestlings.
Considering all fault bars as dependent variable, we found that the best model suggested
that fault bars were associated negatively to percentage of fresh green on the nest
(estimate = -0.82 ± 0.29, F1,16 = 7.91, p = 0.014), a negative tendencies with brood size
(estimate = -18.61 ± 8.75, F1,16 = 4.52, p = 0.053), positively to nestling age (estimate =
3.21 ± 0.90, F1,16 = 12.58, p = 0.003), and negatively related to leg colour on RGB
system (estimate = -0.27 ± 0.12, F1,16 = 4.75, p = 0.048). We did not find any
relationship with the other colour measurements considered (all p > 0.09).
When only were considered total fault bars of the wings, we found that the above model
was consistent in the same ways, although brood size did not remain significant (p >
0.28). However, we did not find any relationship when tail feathers were included as
dependent variable (all p > 0.06), but a negative relationship with age (estimate = 0.55 ±
0.18, F1,17 = 8.98, p = 0.008).With cautiousness, wing fault bars seems more sensible to environmental variations
than tail feathers. Obviously, nestling age and fault bars were positively associated
because the lengths of the feather, as younger nestlings have a lower feather length and
consequently less probability to show a fault bar. We are not able to suggest any
hypothesis that may explain the relationships between fault bars and brood size, fresh
green on the nest and leg coloration. We do consider that the measures of the different
biochemical blood parameters considered, carotenoids and parasites will help to suggest
explanations of the patterns described.
Blood samples
Three nests were not climbed because nestlings were too old and 5 were not climbed for
security reasons. We were able to take blood samples just for 45 nestlings from 20
different nests in two different years and 3 different areas. Sex of the nestlings, stress,
prevalence of blood parasites, carotenoids, total proteins, albumin, cholesterol,
triglycerides, urea and acid uric are currently under analysis.
Habitat quality
The evaluation of prey abundance (voles, birds and mammals) on each habitat
surrounding the nest will be included in a GIS. Because the proportion of each habitat
can differ in surface and in quality (in terms of prey abundance), it has to be established
for each territory at a local scale by using a GIS. This will be analysed in due course.
Diet
Diet was studied through prey remains found out at the end of the breeding period of
each bird at the top of the nests and surroundings (no more than 30 meters far from the
nest). From 75 prey remains analysed, rabbits were the main preys and represented 41%
Figure 5. Prey remains found in buzzard
nests or near surroundings in 2005 and
2006.(Figure 5). Only 2 grouse were found as prey remains. Pheasants appeared more
frequently but they could have been scavenged by buzzards (birds are often killed by
cars on roads) rather than preyed upon. We cannot distinguish between these two
possibilities.
In any case, cautiousness must be taken when interpreting these results because analyses
of diet through prey remains overestimate larger preys over small items. Despite this
fact, it might suggest that rabbits are one of the most important larger preys in buzzards.
More data is needed to confirm this suggestion although similar results have been found
around Deeside (Graham et al. 1995).
Constraints
The main difficulty was related to climbing trees. No all trees could be visited for safety
reasons. Rainy and windy days were avoided, so that in this area means a highly
constraint on climbing safely.
Next steps
Shortly:
· All blood samples will be analysed.
· GIS of habitat characterization will be conducted and will allow to analyse
habitat quality.
Acknowledgments.
We thank John Addy, John Foster from Birse Conservation Trust; Eric Baird and
Michael Bruce, from Glen Tanar Estate and Robert Paterson from Birse Estate. Lynn,
Len Cushine, B. Arroyo and Claudia Marqués helped with the fieldwork. Mick
Marquiss and Alastair Pout provided invaluable information about breeding sites and a
great knowledge about the species. J.T. García is doing all genetic analyses. L. Perez-
Rodríguez, is determining all blood parameters. J. Martinez-Padilla and F. Mougeot
were awarded a postdoctoral fellowship (Ministerio de Educaión y Ciencia) during the
fieldwork. CEH-Banchory supported the fieldwork.
REFERENCES
Bortolotti, G. R., Dawson, R. D. and Murza, G. L. 2002. Stress during feather
development predicts fitness potential. – J. Anim. Ecol. 71: 333–342.
Fridolfsson, A. K. and Ellegren, H. 1999. A simple and universal method for molecular
sexing of non-ratite birds. – J. Avian Biol. 30: 116–121.
Graham, I. M., Redpath, S. M. and Thirgood, S. J. 1995. The diet and breeding density
of Common Buzzards Buteo buteo in relation to indices of prey abundance. – Bird
Study 42: 165–173.Mínguez-Mosquera, I. 1993. Clorofilas y carotenoides en tecnologia de alimentos. – Universidad de Sevilla, Sevilla. van Oort, H. and Dawson, R. D. 2005. Carotenoid ornamentation of adult male Common Redpolls predicts probability of dying in a salmonellosis outbreak. – Funct. Ecol. 19: 822–827. Villafuerte, R. and Negro, J. J. 1998. Digital imaging for colour measurement in ecological research. – Ecol. Lett. 1: 151–154.
You can also read