PROTEIN STRUCTURE AND SEQUENCE RE-ANALYSIS OF 2019-NCOV GENOME DOES NOT INDICATE SNAKES AS ITS INTERMEDIATE HOST OR THE UNIQUE SIMILARITY BETWEEN ...
←
→
Page content transcription
If your browser does not render page correctly, please read the page content below
Protein structure and sequence re-analysis of 2019-nCoV genome
    does not indicate snakes as its intermediate host or the unique
        similarity between its spike protein insertions and HIV-1

  Chengxin Zhang, Wei Zheng, Xiaoqiang Huang, Eric W. Bell, Xiaogen Zhou, Yang Zhang*

Department of Computational Medicine and Bioinformatics, University of Michigan, Ann Arbor,
                                     MI 48109, USA

      *Correspondence should be addressed to Dr. Yang Zhang (Email: zhng@umich.edu)

                                            Abstract

   As the infection of 2019-nCoV coronavirus is quickly developing into a global
   pneumonia epidemic, careful analysis of its transmission and cellular mechanisms is
   sorely needed. In this report, we re-analyzed the computational approaches and findings
   presented in two recent manuscripts by Ji et al. (https://doi.org/10.1002/jmv.25682) and
   by Pradhan et al. (https://doi.org/10.1101/2020.01.30.927871), which concluded that
   snakes are the intermediate hosts of 2019-nCoV and that the 2019-nCoV spike protein
   insertions shared a unique similarity to HIV-1. Results from our re-implementation of the
   analyses, built on larger-scale datasets using state-of-the-art bioinformatics methods and
   databases, do not support the conclusions proposed by these manuscripts. Based on our
   analyses and existing data of coronaviruses, we concluded that the intermediate hosts of
   2019-nCoV are more likely to be mammals and birds than snakes, and that the “novel
   insertions” observed in the spike protein are naturally evolved from bat coronaviruses.

Introduction
    The 2019 novel conronavirus, or 2019-nCoV, recently caused a major pneumonia outbreak in
Wuhan, China and has spread to at least 20 countries in the world. As of February 7, 2020, there
are more than 30,000 patients diagnosed with 2019-nCoV infection in China alone with more
than 700 deaths. Understanding the viral infection mechanisms and animal hosts are of high
urgency for the control and treatment of the 2019-nCoV virus. While it is now commonly
recognized that bats such as Rhinolophus affinis may serve as the natural reservoir of 2019-
nCoV1, it is still unclear which animal serves as an intermediate host that brought the bat
coronavirus to human hosts. During the 2019-nCoV’s infection of host cells, a critical virion
protein is the Spike surface glycoprotein, also known as the S protein. Spike proteins constitute
the outermost component in a coronavirus virion particle and are responsible for viral
recognition of Angiotensin Converting Enzyme 2 (ACE2), a transmembrane receptor on
mammalian hosts that facilitate viral entrance into host cells1-2. Therefore, the spike protein
largely determines host specificity and infectivity of a coronavirus. In this report, we re-analyzed
two recent studies3-4, which have spurred numerous interests and discussions in the community
and the society, regarding the sequence and structure of spike protein in the 2019-nCoV and the
identification of its intermediate hosts.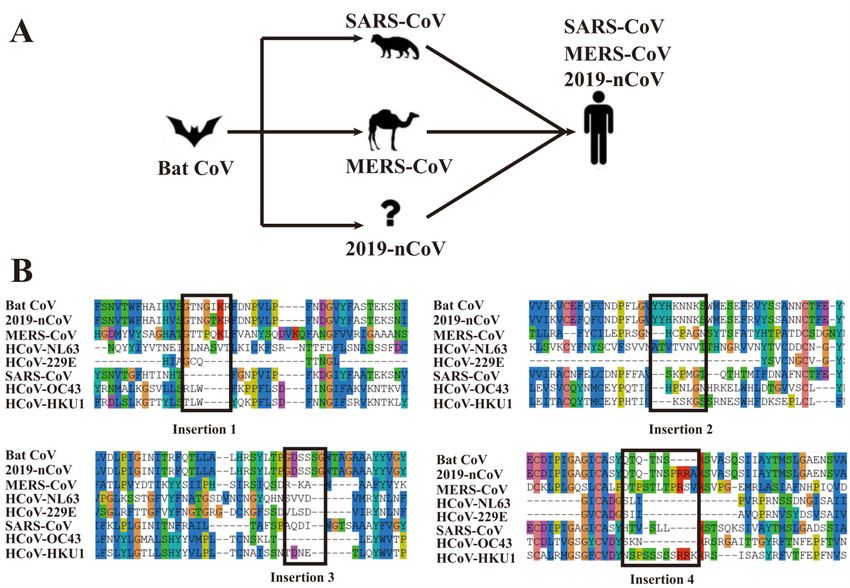
Results
2019-nCoV Spike Protein does not Include Insertions Unique to HIV-1
    In a recent manuscript entitled “Uncanny similarity of unique inserts in the 2019-nCoV spike
protein to HIV-1 gp120 and Gag” 3, Pradhan et al. presented a discovery of four novel insertions
unique to 2019-nCoV spike protein (Figure 1). They further concluded that these four insertions
are part of the receptor binding site of 2019-nCoV, and that these insertions shared “uncanny
similarity” to Human Immunodeficiency Virus 1 (HIV-1) proteins but not to other coronaviruses.
These claims have resulted in considerable public panic and controversy in the community. To
investigate whether the conclusions by Pradhan et al. are scientifically precise, we re-analyzed
the structural location and sequence homology of the four spike protein insertions discussed
therein.

Figure 1. Sequence alignment of 2019-nCoV spike protein (NCBI accession: QHD43416) and SARS-CoV
spike protein (UniProt ID: P59594). The four “novel” insertions “GTNGTKR” (IS1), “YYHKNNKS” (IS2),
“GDSSSG” (IS3) and “QTNSPRRA” (IS4) by Pradhan et al. are highlighted in dashed rectangles. We noted
that these fragments are not bona fide “insertions”; in fact, at least three out of all four fragments are also
shared with Bat Coronavirus RaTG13 spike glycoprotein (NCBI accession: QHR63300.1), as shown in Table
1-3. Nevertheless, we still refer these fragments as “insertions” in this manuscript for consistency with the
original report. The receptor binding domain of spike is marked within the solid box, which corresponds to
residue positions 323 to 545 in the above alignment.

   Since the structure of the spike protein in 2019-nCoV is not yet available, we used C-I-
TASSER5 to model its tertiary structure, as part of our efforts for full genome structure and
function analyses of 2019-nCoV that are available at https://zhanglab.ccmb.med.umich.edu/C-I-
TASSER/2019-nCov/. The C-I-TASSER model has a reasonable confidence score which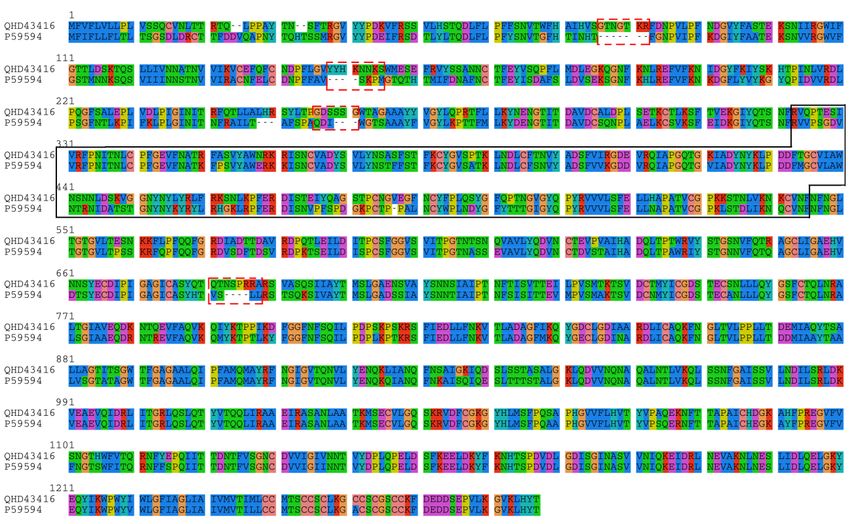
corresponds to an estimated TM-score of 0.61.6 The 2019-nCoV spike model was then
assembled with the human ACE2 structure (PDB ID: 6ACJ)7 by DEMO8 to form a spike-ACE2
complex. As shown in Figure 2, all four insertions are located outside the Receptor Binding
Domain (RBD) of spike, in contrast to the original conclusion made by Pradhan et al. which
stated that the insertions are located on the interface with ACE2.

Figure 2. Complex structure model between human ACE2 (left yellow) and 2019-nCoV spike protein trimer
(right, with three chains colored in magenta, cyan, and blue respectively) constructed by C-I-TASSER. The
four insertions are shown as spheres. During different stages of coronavirus infection, the spike proteins may
be post-processed (i.e. cleaved) to produce different isoforms. Therefore, the eventual spike complex might not
include all residues of a full-length spike protein. Nevertheless, we construct the complex model using full-
length spike sequence to illustrate the locations of the four insertions.

    To investigate viral homologs of the four insertions, we further performed a BLAST
sequence search of these four insertions against the non-redundant (NR) sequence database,
restricting the search results to viruses (taxid:10239), but leaving other search parameters at
default values. The choice of BLAST instead of the more sensitive PSI-BLAST algorithm9 is to
emulate the original report by Pradhan et al. which mainly aimed to identify near identical
sequences. The top 5 sequence homologs (including the query itself) identified for each insertion
are listed in Tables 1-4. In contrast to the previous claim that the four insertions are unique to
2019-nCoV and HIV-1, all four insertion fragments can be found in other viruses. In fact, an
HIV-1 protein is among the top BLAST hits for only one of the four insertion fragments, while
three of the four insertion fragments are found in bat coronavirus RaTG13. Moreover, partly due
to the very short length of these insertions, which range from 6 to 8 amino acids, the E-value of
the BLAST hits, which is a parameter used by BLAST for assessing the statistical significance of
the alignments and usually needs to be below 0.01 to be considered as significant 9, are all greater
than 4, except for a bat coronavirus hit for IS2. These high E-values suggest that the majority of
these similarities are likely to be coincidental.
Table 1. BLAST search result for IS1. For Table 1 to 4, if there are multiple redundant hits for the same
gene from different strains of the same species removed, only one hit is shown. The residue non-identical
to query is highlighted in bold. Sequence identity is calculated as the number of identical residues divided
by query length. Only the sequence portion aligned to the query is shown. In this table, we also list the
closest BLAST hit from bat coronavirus, which is known to be closely related to 2019-nCoV 1.
NCBI accession Sequence E-value Seq. Identity Species
Query GTNGTKR 27 1.00 2019-nCoV
APC94153.1 GTNGTKR 28 1.00 uncultured marine virus
AFU28737.1 -TNGTKR 224 0.86 Human immunodeficiency virus 1
AVE17137.1 GTDGTKR 224 0.86 Rat astrovirus Rn/S510/Guangzhou
QBX18329.1 -TNGTKR 224 0.86 Streptococcus phage Javan411
QHR63300.1 GTNGIKR 643 0.86 Bat coronavirus RaTG13
Table 2. BLAST search result for IS2.
NCBI accession Sequence E-value Seq. Identity Species
Query YYHKNNKS 0.13 1.00 2019-nCoV
QHR63300.1 YYHKNNKS 0.13 1.00 Bat coronavirus RaTG13
AUL79732.1 -YHKNNKS 4.2 0.88 Tupanvirus deep ocean
YP_007007173.1 YYHKDNK- 8.7 0.75 Klebsiella phage vB_KleM_RaK2
ALS03575.1 YYHKNN-- 12 0.75 Gokushovirus WZ-2015a
Table 3. BLAST search result for IS3.
NCBI accession Sequence E-value Seq. Identity Species
Query GDSSSG 1004 1.00 2019-nCoV
QAU19544.1 GDSSSG 1003 1.00 Orthohepevirus C
AYV78550.1 GDSSSG 1004 1.00 Edafosvirus sp.
QHR63300.1 GDSSSG 1004 1.00 Bat coronavirus RaTG13
QDP55596.1 GDSSSG 1004 1.00 Prokaryotic dsDNA virus sp.
Table 4. BLAST search result for IS4.
NCBI accession Sequence E-value Seq. Identity Species
Query QTNSPRRA 1.0 1.00 2019-nCoV
YP_009226728.1 QTNSPRR- 8.5 0.88 Staphylococcus phage SPbeta-like
BAF95810.1 QTNSPRRA 35 1.00 Bovine papillomavirus type 9
ARV85991.1 ETNSPRR- 106 0.75 Peach associated luteovirus
QDH92312.1 QTNAPRKA 142 0.75 Gordonia phage Spooky
Given that 3 out of the 4 insertion fragments are found in the bat coronavirus RaTG13, it is
attempting to assume that these “insertions” may be directly inherited from bat coronaviruses.
Currently, there are at least 7 known human coronaviruses (2019-nCoV, SARS-CoV, MERS-
CoV, HCoV-229E, HCoV-OC43, HCoV-NL63 and HCoV-HKU1), where many of them,
including Severe Acute Respiratory Syndrome-related Coronavirus (SARS-CoV) and Middle
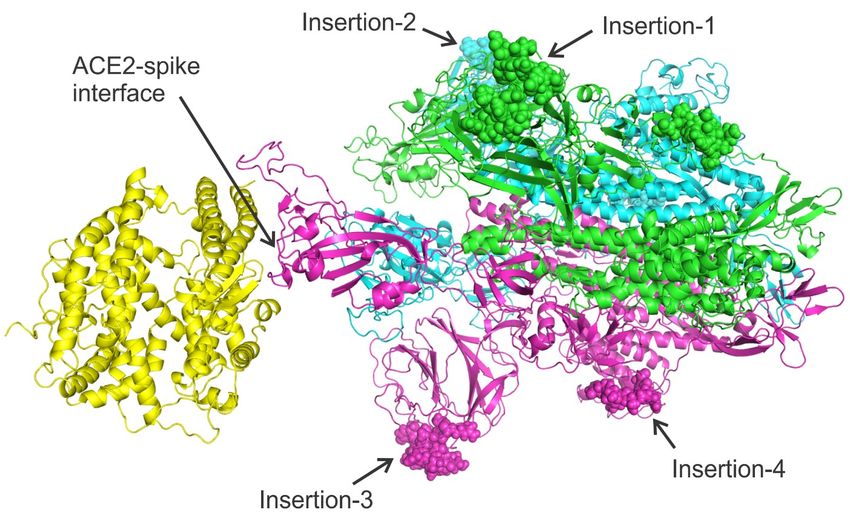
East Respiratory Syndrome-related Coronavirus (MERS-CoV), were shown to be transmittedfrom bat10-14 (Figure 3A). To further examine the evolutionary relationship between the 2019-
nCoV genome and the bat coronavirus, in comparison with other human coronaviruses, in
Figure 3B we created by MUSCLE a multiple sequence alignment (MSA) for all the 7 human
coronaviruses and the bat coronavirus RaTG13 that is currently known to be the closest relative
to 2019-nCoV14 among known coronaviruses. Among the 4 “insertions” (ISs) of the 2019-nCoV,
IS1 has only 1 residue different from the bat coronavirus, and 3 out of 7 residues are identical
with MERS-CoV. IS2 and IS3 are all identical to the bat coronavirus. For IS4, although the local
sequence alignment by BLAST did not hit the bat coronavirus in Table 4, it has a close
evolutionary relation with the bat coronavirus in the MSA. In particular, the first 6 residues in the
IS4 fragment “QTQTNSPRRA” from 2019-nCoV are identical to the bat CoV, while the last 4
residues, which were absent in the bat coronavirus or SARS-CoV, have at least 50% identity to
MERS-CoV and HCoV-HKU1.
Putting these together, we believe that there is a close evolutionary relation between 2019-
nCoV and bat coronavirus RaTG13. The four insertions highlighted by Pradhan et al. in the
spike protein are not unique to 2019-nCoV and HIV-1. In fact, the similarities in the sequence-
based alignments built on these very short fragments are statistically insignificant, as assessed by
the BLAST E-values, and such similarities are shared in many other viruses including the bat
coronavirus. Structurally, these “insertions” are far away from the binding interface of the spike
protein with the ACE2 receptor, as shown in Figure 2, which are also contradictory with the
conclusion made by Pradhan et al.
Figure 3. Proposed transmission history of representative coronaviruses (A) and multiple sequence alignment
for the bat coronavirus and 7 known human coronaviruses (B). Bat CoV (QHR63300.1), 2019-nCoV(QHD43416.1), MERS-CoV (YP_009047204.1), HCoV-NL63 (YP_003767.1), HCoV-229E (NP_073551.1),
SARS-CoV (P59594), HCoV-OC43 YP_009555241.1) and HCoV-HKU1 (YP_173238.1) are downloaded
from the NCBI and UniProt databases. For brevity, only the regions near the four “insertions” are displayed in
the figure.
Codon Usage Analysis does not Suggest Snakes as Potential Hosts of 2019-nCoV
Another early study attempting to understanding the infection of 2019-nCoV was performed
by Ji et al. 4. In this study, the authors analyzed the Relative Synonymous Codon Usage (RSCU)
of 2019-nCoV and 8 vertebrates, including two species of snakes (Bungarus multicinctus and
Naja atra), hedgehog (Erinaceus europaeus), bat (Rhinolophus sinicus), marmot (Marmota),
pangolin (manis javanica), chicken (Gallus gallus), and human (Homo sapiens). Among these
vertebrates, snakes have the smallest codon usage difference (squared Euclidean distance of
RSCU) from 2019-nCoV and were therefore proposed by Ji et al. as the intermediate hosts of
2019-nCoV. This conclusion is controversial among virologists, mainly due to the lack of prior
biological evidence that coronavirus can infect animals other than mammals and birds 15. In this
report, we further scrutinize the bioinformatics approach and the underlying biological
assumptions by a large-scale replication of the RSCU analysis.
The bioinformatics analysis performed in Ji et al. study has several limitations. First, there
are only approximately 300 protein coding sequences (CDSs) in the NCBI GenBank for the
snake species they chose from Bungarus multicinctus and Naja atra. These CDSs represent 100,000 vertebrates with at least one CDS in the NCBI GenBank database.
Finally, there is no established evidence that viruses evolve their codon usage to resemble that of
their animal hosts 16; this calls for a careful benchmark of RSCU analysis in terms of its ability to
re-discover known hosts of characterized viruses.
To address these issues, we re-implemented the RSCU comparison algorithm proposed by Ji
et al. to analyze the codon usage in the 2019-nCoV genome (NCBI accession MN908947.3) and
those of all 102,367 vertebrate species in the CoCoPUTS database. To test whether this kind of
analysis can recover known hosts of well-studied coronavirus, severe acute respiratory
syndrome-related coronavirus (SARS-CoV, NCBI accession NC_004718) and Middle East
respiratory syndrome-related coronavirus (MERS-CoV, NCBI accession NC_019843) are also
included. Codon usage frequency are converted to squared Euclidean distance of RSCU in two
separate analyses: one based on all vertebrates (Figure 4A-C) and the other on the subset of
vertebrates with enough statistics, i.e. >2000 known CDSs (Figure 4D-F), roughly
corresponding to 10% of all protein coding genes in a typical vertebrate genome.
As shown in Figure 4, the top-ranking vertebrates with lowest RSCU distances to the three
different coronavirus are very similar. For example, for all three viruses, two kinds of frogs
(Megophrys feae and Liophryne schlaginhaufeni) have the smallest RSCU distances among all
vertebrates, while another two kinds of frogs (Xenopus laevis and Xenopus tropicalis) have the
smallest RSCU distances among all vertebrates with sufficient sequences. In fact, the RSCUdistances between coronaviruses and frogs are consistently smaller than that between
coronaviruses and the two snakes (Bungarus multicinctus and Naja atra) analyzed in Ji et al., as
shown in Table 5.
Figure 4. Top 20 vertebrate species ranked in ascending order of squared Euclidean distance of RSCU to
2019-nCoV (A, D), SARS-CoV (B, E), and to MERS-CoV (C, F). The upper panels (A-C) are for all
vertebrates with known codon usage in CoCoPUTS database, while the lower panel (D-F) is for the subset of
species where more than 2000 CDSs are available for codon usage calculation.
Table 5 also showed that the RSCU analysis cannot identify the known natural, intermediate,
and eventual hosts (Rhinolophus sinicus, Paguma larvata, and Homo sapiens) of SARS-CoV or
the hosts (Camelus dromedarius and Homo sapiens) of MERS-CoV, as the RSCU distances of
these vertebrates are all larger than the cold blooded vertebrates (frogs and snakes). In fact,SARS-CoV and MERS-CoV, the two coronaviruses known to utilize different intermediate hosts
(Paguma larvata and Camelus dromedarius), have almost no difference in RSCU. These data
suggest that the RSCU analysis proposed by Ji et al. cannot provide conclusive evidence for the
natural, intermediate or eventual hosts of coronavirus. Based on our current knowledge of
existing zoonotic coronaviruses 15, we conceive that, if 2019-nCoV requires an intermediate host,
this host is more likely to be a warm-blooded vertebrate (a mammal or a bird), than snakes.
Table 5. Squared Euclidean distances among coronaviruses and representative vertebrates.
2019- SARS- MERS- Comment
Species
nCoV CoV CoV
2019-nCoV 0 0.28 0.40 Coronaviruses
SARS-CoV 0.28 0 0.12
MERS-CoV 0.40 0.12 0
Megophrys feae 32.64 32.28 32.86 Vertebrates with the closest RSCU to the
Liophryne schlaginhaufeni 33.07 32.50 32.80 coronaviruses
Rhinolophus affinis 37.58 36.47 36.50 Natural host of 2019-nCoV
Rhinolophus sinicus 37.55 36.25 36.49 Natural host of SARS-CoV
Bungarus multicinctus 34.48 34.36 34.84 Proposed intermediate hosts of 2019-nCoV
Naja atra 34.44 33.98 34.39 by Ji et al.
Paguma larvata 47.34 45.08 45.04 Intermediate host of 2019-nCoV
Camelus dromedarius 46.47 44.28 44.63 Intermediate host of MERS-CoV
Homo sapiens 43.81 41.71 41.84 Eventual host
Discussion and Conclusion
Due to the scarcity of experimental and clinical data, as well as the urgency to understand the
infectivity of the deadly coronaviruses, we have been increasingly relying on computational
analyses to study the 2019-nCoV virus in terms of protein structures, functions, phylogeny, and
interactions at both molecular and organismal levels. Indeed, within less than a month of the
publication of the 2019-nCoV genome in January 2020, multiple bioinformatics analyses
regarding 2019-nCoV have been either published or posted as preprint. While such expeditious
analyses provide much needed insights into the biology of the 2019-nCoV virus, there is a
caution to avoid over-interpretation of the data at the absence of comprehensive benchmarks or
follow-up experimental validations. In this report, we have investigated two recently published
computational analyses regarding intermediate host identification and the analysis of spike
protein insertions. In both cases, we found that the conclusions proposed by the original studies
do not hold in the face of more comprehensive replications of these analyses. We hope our
analysis presented herein can clarify some of the misinterpretations resulted from previous
bioinformatics analyses for the 2019-nCoV virus.
Methods
Protein Sequence Alignment
Global protein sequence alignment of the full-length coronavirus spike proteins was
performed by MUSCLE 17 and visualized by SeaView 18.Structure Prediction of Spike-ACE2 complex
We use C-I-TASSER 5 to create structural models of the full-length spike protein. Here, C-I-
TASSER is an extended pipeline of I-TASSER19 and utilizes the deep convolutional neural-
network based contact-maps 20 to guide the Monte Carlo fragment assembly simulations. Since
the RBD domain of spike exhibits different conformations relative to the remaining portion of
the protein, the DEMO pipeline 8 was then used to re-assembly the domains and to construct a
complex structure consisting of spike trimer and the extracellular domain of human ACE2, using
the ACE2-bound conformation 2 of SARS-CoV spike glycoprotein (PDB ID: 6ACJ) as a
template. Our complex modeling did not use the template originally used in the Pradhan et al.
study (PDB ID: 6ACD) because it did not include the ACE2 receptor.
Relative Synonymous Codon Usage (RSCU) Analysis
As per the previous study 4, the RSCU for codon j in a species is calculated as
where kj is the number of codons synonymous to codon j (including j itself), pj is the probability
of the respective amino acid being encoded by codon j among all kj synonymous codons in the
CDSs of the whole genome. The difference of codon usage in two different species (a virus
versus a vertebrate in our case) is defined by squared Euclidean distance of RSCU, i.e.,
∑ ( )
Here, N=61 is the number of codons that encodes amino acids, thereby excluding the 3 stop
codons. Xj and Xj’ are the RSCU for codon j in the virus and in the vertebrate, respectively. In
our report, the codon usages of all vertebrates are taken from the CoCoPUTS 21 database, which
was last updated in January 2020. This database was therefore much more recent than the Codon
Usage Database 22 last updated in 2007 that was used in the previous research 4. To obtain the
codon usage of coronaviruses, we imported the GenBank annotations of the three coronavirus
genomes to SnapGene (GSL Biotech LLC] to export the codon usage table based on the
GenBank annotations. CodonW 23 was not used for codon usage calculation as in the previous
study because it cannot account for the -1 frameshift translation of the first open reading frame
(ORF) in the coronavirus genome.
Acknowledgements
This work is supported in part by the National Institute of General Medical Sciences
(GM083107, GM116960), the National Institute of Allergy and Infectious Diseases (AI134678),
and the National Science Foundation (DBI1564756, IIS1901191). This work used the Extreme
Science and Engineering Discovery Environment (XSEDE),24 which is supported by National
Science Foundation (ACI-1548562).
References1. Zhou, P.; Yang, X.-L.; Wang, X.-G.; Hu, B.; Zhang, L.; Zhang, W.; Si, H.-R.; Zhu, Y.; Li, B.; Huang, C.-L.; Chen, H.-D.; Chen, J.; Luo, Y.; Guo, H.; Jiang, R.-D.; Liu, M.-Q.; Chen, Y.; Shen, X.-R.; Wang, X.; Zheng, X.-S.; Zhao, K.; Chen, Q.-J.; Deng, F.; Liu, L.-L.; Yan, B.; Zhan, F.-X.; Wang, Y.-Y.; Xiao, G.-F.; Shi, Z.-L., A pneumonia outbreak associated with a new coronavirus of probable bat origin. Nature 2020. 2. Letko, M.; Munster, V., Functional assessment of cell entry and receptor usage for lineage B β-coronaviruses, including 2019-nCoV. bioRxiv 2020, 2020.01.22.915660. 3. Pradhan, P.; Pandey, A. K.; Mishra, A.; Gupta, P.; Tripathi, P. K.; Menon, M. B.; Gomes, J.; Vivekanandan, P.; Kundu, B., Uncanny similarity of unique inserts in the 2019-nCoV spike protein to HIV-1 gp120 and Gag. bioRxiv 2020, 2020.01.30.927871. 4. Ji, W.; Wang, W.; Zhao, X.; Zai, J.; Li, X., Homologous recombination within the spike glycoprotein of the newly identified coronavirus may boost cross-species transmission from snake to human. Journal of Medical Virology 2020. 5. Zheng, W.; Li, Y.; Zhang, C. X.; Pearce, R.; Mortuza, S. M.; Zhang, Y., Deep-learning contact-map guided protein structure prediction in CASP13. Proteins 2019. 6. Zhang, Y.; Skolnick, J., Scoring function for automated assessment of protein structure template quality. Proteins 2004, 57 (4), 702-710. 7. Song, W.; Gui, M.; Wang, X.; Xiang, Y., Cryo-EM structure of the SARS coronavirus spike glycoprotein in complex with its host cell receptor ACE2. PLoS Pathog 2018, 14 (8), e1007236. 8. Zhou, X. G.; Hu, J.; Zhang, C. X.; Zhang, G. J.; Zhang, Y., Assembling multidomain protein structures through analogous global structural alignments. Proceedings of the National Academy of Sciences of the United States of America 2019, 116 (32), 15930-15938. 9. Altschul, S. F.; Madden, T. L.; Schäffer, A. A.; Zhang, J.; Zhang, Z.; Miller, W.; Lipman, D. J., Gapped BLAST and PSI-BLAST: a new generation of protein database search programs. Nucleic Acids Research 1997, 25 (17), 3389-3402. 10. Li, W.; Shi, Z.; Yu, M.; Ren, W.; Smith, C.; Epstein, J. H.; Wang, H.; Crameri, G.; Hu, Z.; Zhang, H.; Zhang, J.; McEachern, J.; Field, H.; Daszak, P.; Eaton, B. T.; Zhang, S.; Wang, L.-F., Bats Are Natural Reservoirs of SARS-Like Coronaviruses. Science 2005, 310 (5748), 676. 11. Wang, Q.; Qi, J.; Yuan, Y.; Xuan, Y.; Han, P.; Wan, Y.; Ji, W.; Li, Y.; Wu, Y.; Wang, J.; Iwamoto, A.; Woo, Patrick C. Y.; Yuen, K.-Y.; Yan, J.; Lu, G.; Gao, George F., Bat Origins of MERS-CoV Supported by Bat Coronavirus HKU4 Usage of Human Receptor CD26. Cell Host & Microbe 2014, 16 (3), 328-337. 12. Corman, V. M.; Baldwin, H. J.; Tateno, A. F.; Zerbinati, R. M.; Annan, A.; Owusu, M.; Nkrumah, E. E.; Maganga, G. D.; Oppong, S.; Adu-Sarkodie, Y.; Vallo, P.; da Silva Filho, L. V. R. F.; Leroy, E. M.; Thiel, V.; van der Hoek, L.; Poon, L. L. M.; Tschapka, M.; Drosten, C.; Drexler, J. F., Evidence for an Ancestral Association of Human Coronavirus 229E with Bats. Journal of Virology 2015, 89 (23), 11858. 13. Hu, B.; Zeng, L.-P.; Yang, X.-L.; Ge, X.-Y.; Zhang, W.; Li, B.; Xie, J.-Z.; Shen, X.-R.; Zhang, Y.-Z.; Wang, N.; Luo, D.-S.; Zheng, X.-S.; Wang, M.-N.; Daszak, P.; Wang, L.-F.; Cui, J.; Shi, Z.-L., Discovery of a rich gene pool of bat SARS-related coronaviruses provides new insights into the origin of SARS coronavirus. PLOS Pathogens 2017, 13 (11), e1006698. 14. GISAID, Phylogenetic tree of CoV families (larger context, including nearest bat precursor) (2020-02-03). https://platform.gisaid.org/epi3/frontend#lightbox983930542 2020. 15. Callaway, E.; Cyranoski, D., Why snakes probably aren’t spreading the new China virus. Nature 2020. 16. Meintjes, P. L.; Rodrigo, A. G., Evolution of relative synonymous codon usage in Human Immunodeficiency Virus type-1. Journal of bioinformatics and computational biology 2005, 3 (01), 157-168. 17. Edgar, R. C., MUSCLE: multiple sequence alignment with high accuracy and high throughput. Nucleic Acids Research 2004, 32 (5), 1792-1797.
18.     Gouy, M.; Guindon, S.; Gascuel, O., SeaView Version 4: A Multiplatform Graphical User
Interface for Sequence Alignment and Phylogenetic Tree Building. Molecular Biology and
Evolution 2009, 27 (2), 221-224.
19.     Yang, J.; Yan, R.; Roy, A.; Xu, D.; Poisson, J.; Zhang, Y., The I-TASSER Suite: protein
structure and function prediction. Nature Methods 2015, 12 (1), 7-8.
20.     Li, Y.; Zhang, C.; Bell, E. W.; Yu, D. J.; Zhang, Y., Ensembling multiple raw
coevolutionary features with deep residual neural networks for contact-map prediction in
CASP13. Proteins 2019.
21.    Alexaki, A.; Kames, J.; Holcomb, D. D.; Athey, J.; Santana-Quintero, L. V.; Lam, P. V. N.;
Hamasaki-Katagiri, N.; Osipova, E.; Simonyan, V.; Bar, H., Codon and Codon-Pair Usage
Tables (CoCoPUTs): facilitating genetic variation analyses and recombinant gene design.
Journal of molecular biology 2019, 431 (13), 2434-2441.
22.     Nakamura, Y.; Gojobori, T.; Ikemura, T., Codon usage tabulated from international DNA
sequence databases: status for the year 2000. Nucleic Acids Research 2000, 28 (1), 292-292.
23.     Peden, J. F., Analysis of codon usage. 2000.
24.     Towns, J.; Cockerill, T.; Dahan, M.; Foster, I.; Gaither, K.; Grimshaw, A.; Hazlewood, V.;
Lathrop, S.; Lifka, D.; Peterson, G. D.; Roskies, R.; Scott, J. R.; Wilkins-Diehr, N., XSEDE:
Accelerating Scientific Discovery. Comput Sci Eng 2014, 16 (5), 62-74.
You can also read