Assessment of Need for Aggregates: Local Aggregate Assessment 2019 - West Sussex Joint Minerals Local Plan - May 2020 - West Sussex County ...
←
→
Page content transcription
If your browser does not render page correctly, please read the page content below
West Sussex Joint Minerals Local Plan

Assessment of Need for Aggregates:
Local Aggregate Assessment 2019

May 2020
West Sussex Joint Minerals Local Plan
Assessment of Need for Aggregates
Local Aggregate Assessment 2019 (May 2020)
Executive Summary .................................................................................. 1
West Sussex LAA Dashboard 2019 .............................................................. 2
1.      Introduction .................................................................................... 3
        1.1     The Managed Aggregate Supply System ..................................... 3
        1.2     What is a Local Aggregate Assessment? ..................................... 3
        1.3     West Sussex Joint Minerals Local Plan ........................................ 4
        1.4     National and Regional Context .................................................. 4
                National and Regional Guidelines for Aggregates Provision ............ 4
                Policy on National Parks ........................................................... 5
        1.5     Consultation Arrangements ...................................................... 5
2.      Aggregates in West Sussex ............................................................... 6
        2.1     Supply Options ....................................................................... 6
        2.2     Geology and Landscape ........................................................... 6
        2.3     Land-won Sand and Gravel ...................................................... 7
                Other Relevant Information affecting Aggregate Supply and
                Demand .............................................................................. 11
                Sharp Sand and Gravel .......................................................... 11
                Soft Sand ............................................................................ 14
                Imports and Exports of Land-won Sand and Gravel.................... 16
                Current Supply of Land-Won Sand and Gravel ........................... 16
                Potential Constraints to Future Land-won Supply ....................... 19
                Land–Won Sand and Gravel Summary ..................................... 20
        2.4     Marine-Won Sand and Gravel ................................................. 21
                Use of Marine-Won Aggregate ................................................ 21
                Pattern of Previous Landings and Sales and Current Demand
                for Marine-won Aggregate ...................................................... 22
                Future Demand for Marine-Won Sand and Gravel ...................... 24
                Other Relevant Local Information ............................................ 24
                Imports and Exports ............................................................. 26
                Current Supply of Marine-Won Sand and Gravel ........................ 26
                Marine-Won Sand and Gravel Summary ................................... 26
        2.5     Sand and Gravel Imported by Rail ........................................... 27
                Pattern of Previous Sales and Current Demand for Sand and
                Gravel Imported by Rail ......................................................... 27
                Future Demand for Sand and Gravel Imported by Rail ................ 29
                Current Supply of Rail-Imported Sand and Gravel ..................... 31
                Rail-Imported Sand and Gravel Summary ................................ 31
        2.6     Crushed Rock ....................................................................... 31
Pattern of Previous and Current Demand for Crushed Rock ......... 32
Future Demand for Crushed Rock Imports from Wharves ............ 34
Future Demand for Crushed Rock Imports to Railheads .............. 34
Imports and Exports of Crushed Rock ...................................... 36
Current Supply of Crushed Rock.............................................. 36
Crushed Rock Summary ........................................................ 36
2.7 Secondary/Recycled Aggregates ............................................. 37
Secondary Aggregates ........................................................... 37
Recycled Aggregates ............................................................. 37
Pattern of Previous and Current Demand for Recycled and
Secondary Aggregate ............................................................ 38
Current Capacity for Production of Recycled Aggregates ............. 40
Secondary Aggregates ........................................................... 40
Recycled and Secondary Aggregates Summary ......................... 41
3. Balance between Demand and Supply .............................................. 43
3.2 Proposed Monitoring Arrangements ......................................... 43
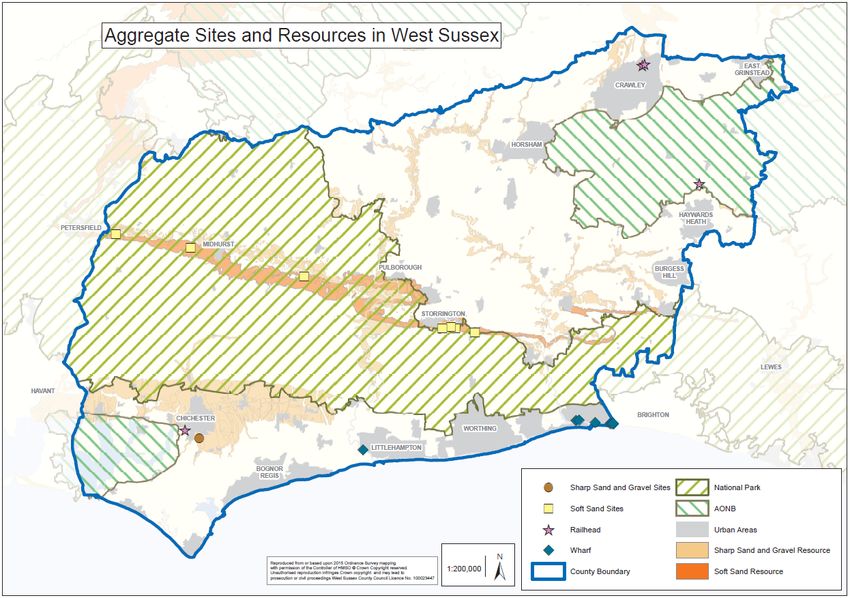
Appendix A: LAA Map .............................................................................. 45
Appendix B: Effect of Housing and Road Construction on Aggregate Supply
and Demand .......................................................................................... 46
Housing ........................................................................................ 46
Planned Highway Improvement (Crushed Rock) ................................. 48
Non-Trunk Roads .................................................................. 48
Trunk Roads ........................................................................ 50
Future Demand for Aggregates Use in Roads ............................ 51
References ............................................................................................ 52
iiExecutive Summary
The National Planning Policy Framework (NPPF) requires Mineral Planning
Authorities (MPAs) to prepare an annual Local Aggregates Assessment (LAA) 1
which is an evidence base document that sets out the potential demand, and
assessment of potential supply, of aggregates within their area. This joint LAA
has been prepared by West Sussex County Council (WSCC) and the South
Downs National Park Authority (SDNPA), and provides evidence to support the
West Sussex Joint Minerals Local Plan (JMLP).
Chapter 1: Introduction
This chapter explains the background to the Managed Aggregate Supply System
(MASS) and the requirement for MPAs to prepare an LAA. It explains how the
LAA informs and supports the JMLP, which has been prepared jointly by WSCC
and the SDNPA. The LAA incorporates the findings from the latest round of
evidence gathering during 2019. This evidence includes that which shows how
‘other relevant local information’ influences the estimated demand and supply of
aggregates through the life of the JMLP (to 2033).
Chapter 2: Aggregates in West Sussex
This chapter sets out the past to current demand for, and supply of, aggregates
in West Sussex from each different source in turn; the key findings are set out
within the ‘Dashboard’ below.
Chapter 3: Balance between Demand and Supply
This chapter summarises the supply of aggregates from different sources and
allows for a comparison of the different supply options based on relevant local
information. It concludes that:
existing permitted reserves of land-won sharp sand and gravel exceed a
forecasted demand value, which is based on 10-year average sales and
local relevant information for the plan period;
safeguarded wharves, railheads, and recycled aggregate sites will
continue to be the majority sources of supplies for sharp sand and gravel;
safeguarded wharves and railheads will continue to provide the
importation infrastructure through which the supplies of crushed rock are
imported;
soft sand resources are constrained by being situated in the South Downs
National Park (or its setting). Existing reserves are sufficient to supply
soft sand at levels equivalent to the 10-year average sales for 7.7 years,
and, taking account of relevant local information, for 6.0 years.
1 See paragraph 207(a) of the NPPF.
1West Sussex LAA Dashboard 2019
Source 2018 Sales (mt) Trend 10-year Avg Sales 3-year Avg Sales LAA Rate Reserves Landbank Capacity Comments
(2017 in brackets) (previous year sales) (mtpa) (mt) (mtpa) 2 (mt) (years) (mtpa)
(2009-2018) (2016-2018) (based on LAA Rate)
Confidential Incidental sales from one soft
Sharp Sand and Gravel
(Confidential) ⇧ Up 0.023 0.084 0.036 3 0.795 22 0.250
sand quarry in 2018.
0.306
Soft Sand
(0.282) ⇧ Up 0.289 0.316 0.372 2.300 6.2 0.502
Data derived from EA WDIs
Recycled/ 0.391 and reporting on 2018/19.
Secondary Aggregates (0.393) ⇩ Down 0.444 0.421 0.444 0.529
Survey response rates too
low for accurate figures.
1.319 Headroom capacity of
Marine Sand and Gravel
(landings) (1.307) ⇧ Up 1.106 1.293 1.737 2.070 4 0.167mtpa (using updated
LAA rate).
0.090 Headroom capacity of
Rock Imports by Sea
(0.164) ⇩ Down 0.106 0.097 0.166 2.0704 0.167mtpa (using updated
LAA rate).
0.108 Headroom capacity of
Rail Depot Sales
(sand and gravel) (0.084) ⇧ Up 0.117 0.090 0.184 1.380 5
0.238mtpa (using updated
LAA rate).
0.675 Headroom capacity of
Rail Depot Sales
(crushed rock) (0.568) ⇧ Up 0.610 0.599 0.958 1.3805 0.238mtpa (using updated
LAA rate).
2 The LAA rates applied are those which show the highest theoretical requirement per annum (i.e. the 10-year average + the highest demand scenario).
3 The three-year average is more than 50% higher than the LAA rate. The landbank based on the three-year average is 9.5 years and therefore there would be a theoretical shortfall to 2033 of 0.38mt.
4 Maximum capacity of wharves in West Sussex.
5 Maximum capacity of railheads in West Sussex.
21. Introduction
1.1 The Managed Aggregate Supply System
1.1.1 Aggregates are used for the construction of homes, commercial
development, and infrastructure (such as roads). It is therefore
important that nationally there is an adequate and steady supply to
ensure economic development and quality of life. The Managed
Aggregate Supply System (MASS) has been the mechanism to ensure
there has been an adequate supply of aggregates (sand, gravel, and
crushed rock) in England for over 35 years.
1.1.2 Minerals can only be worked where they occur, and their extraction can
potentially cause conflict through loss or changes to valued landscapes.
The MASS system was developed due to the geographical imbalance of
aggregates and ensures Mineral Planning Authorities (MPAs) make an
appropriate contribution to the national need for aggregates as well as
local supply. As part of the MASS system, each MPA is required to
prepare a Local Aggregate Assessment (LAA) which assesses the
demand and supply of aggregates in its area on an annual basis. LAAs
can be prepared jointly by more than one authority.
1.2 What is a Local Aggregate Assessment?
1.2.1 The requirement for MPAs to prepare a LAA is set out in the National
Planning Policy Framework (NPPF) and the national Planning Practice
Guidance (PPG). Paragraph 62 6 of the PPG states that LAA should cover
the following:
“A forecast of the demand for aggregates based on both the rolling
average 10-year sales data and other relevant local information;
An analysis of all aggregate supply options, as indicated by
landbanks, mineral plan allocations, and capacity data, e.g. marine
licences for marine aggregate extraction, recycled aggregates, and
the potential throughput from wharves. This analysis should be
informed by planning information, the aggregate industry, and other
bodies such as local enterprise partnerships; and
An assessment of the balance between demand and supply, and the
economic and environmental opportunities and constraints that
might influence the situation. It should conclude if there is a
shortage or surplus of supply and, if the former, how this is being
addressed.”
1.2.2 The national PPG, Paragraph 64 7, states that the LAA “must also
consider other relevant local information in addition to the 10-year
rolling supply”, and this information may include “levels of planned
construction and house building”, as well as considering average sales
over the last three years to identify general trend of demand.
6 PPG Paragraph: 062. Reference ID: 27-062-20140306.
7 PPG Paragraph: 064. Reference ID: 27-064-20140306.
31.2.3 This LAA incorporates the findings from further evidence gathering that
has considered ‘other relevant local information’ that may influence the
demand of aggregates through the life of the Joint Minerals Local Plan
(JMLP) (to 2033). This information, including anticipated levels of
construction of homes and the maintenance and construction of roads,
has been used to underpin a number of differing aggregate demand
scenarios.
1.2.4 While there are many end users of aggregates, many of these can be
related to housing growth which are partially driven by demographic
trends. Therefore, housing trends are considered to provide a useful
indicator for trends in demand for other users of aggregates. Data and
evidence on the future construction of homes therefore provide a sound
baseline from which to assess possible future demand scenarios.
Furthermore, information on planned highways works (maintenance and
improvement) have also been considered as they consume aggregates
(generally crushed rock).
1.3 West Sussex Joint Minerals Local Plan
1.3.1 The West Sussex Joint Minerals Local Plan (JMLP) was adopted in
July 2018. During the examination of the JMLP, the Planning Inspector
indicated that modifications were required to the submitted Plan to
address issues of ‘soundness’ related to the supply of soft sand. The
adopted Plan includes a commitment to prepare a formal single issue
review of soft sand to be begun within six months of adoption of the
JMLP, and to be submitted for examination within two years of
commencement of the review.
1.3.2 The JMLP takes account of evidence such as changes in relation to the
demand and supply of minerals in West Sussex as well as government
minerals planning policies (included in the NPPF) and the establishment
of the South Downs National Park Authority in 2011. The Plan includes
a vision; strategic objectives; a suite of strategic policies; a strategic
site; and development management policies.
1.3.3 Previous versions of the LAA, dating back to 2014, informed the
preparation of the Plan by setting out a forecast for the demand for
aggregates over the Plan period and indicated what other local issues
are likely to influence the ability of needs for aggregates to be met from
minerals resources and facilities in West Sussex. The LAA is updated
annually and provides the latest aggregates situation, to support the
determination of planning applications for aggregate proposals.
1.4 National and Regional Context
National and Regional Guidelines for Aggregates Provision
1.4.1 LAAs are used by MPAs, including National Park Authorities, to help
them plan for a steady and adequate supply of aggregates. In doing so
MPAs participate in, and take the advice of, an Aggregate Working Party
(AWP), a technical advisory group of MPAs and relevant organisations,
which has the following role:
to consider, scrutinise and provide advice on the LAAs of MPAs;
4 to provide an assessment of the overall demand and supply for the
AWP area, including whether the area is making a full contribution
towards meeting national and local aggregate needs;
to obtain, collect, and report in data on minerals activity in their
area, including annual data collected by the MPAs on sales,
permissions, and reserves of aggregates (including recycled and
secondary sources).
1.4.2 West Sussex and the South Downs National Park Authority fall within
the South East England Aggregate Working Party (SEEAWP) area.
1.4.3 As part of the MASS, the amount of land-won aggregates to be provided
by each region was set out in the National and Regional Guidelines for
Aggregates Provision in England 2005-2020 (June 2009). MPAs may
decide, collectively, to plan for more or less than set out in the
Guidelines based on their LAA but this must be supported by robust
evidence and be properly justified, having regard to the local and
national need.
1.4.4 The data used in this LAA includes that from the National Aggregate
Minerals Survey, which was carried out for the year 2015. A further
national survey has not taken place; therefore, information on imports
and exports has not been updated.
Policy on National Parks
1.4.5 In West Sussex a significant proportion of the sand and gravel resources
are within, or in the setting of, the South Downs National Park (SDNP),
and so national policy on development in National Parks needs to be
taken into account 8.
1.5 Consultation Arrangements
1.5.1 In accordance with the NPPF and PPG, this LAA was subject to
consideration and scrutiny by the SEEAWP in November 2019. Other
bodies invited to comment on its contents include the following:
counties that receive or provide aggregates to West Sussex;
the Coast to Capital Local Economic Partnership;
the Crown Estate;
the Marine Management Organisation;
the Local Nature Partnership;
Natural England.
8 See Paragraph 172 of the NPPF.
52. Aggregates in West Sussex
2.1 Supply Options
2.1.1 When planning for a steady and adequate supply of minerals, MPAs
have to consider all supply options. West Sussex currently supplies
aggregates from a number of sources including:
soft sand, sharp sand, and gravel extracted at quarries in West
Sussex;
recycled and secondary aggregate production;
imported aggregate (e.g. crushed rock and sand and gravel) by road,
rail, and sea; and
sand and gravel dredged from the seabed (marine-won)
2.1.2 Each supply option is considered separately below including the
economic and environmental opportunities and constraints that might
influence the situation. This information is then used to consider the
total aggregate supply picture and the balance between supply and
demand.
2.2 Geology and Landscape
2.2.1 In broad terms, the county has a sequence of broad geological bands
which run across the County from the west to east; see ‘Appendix A:
LAA Map’.
2.2.2 Soft sand is won from the Sandgate Formation and the Folkestone
Formation (also known as the Folkestone Beds) which is worked in a
number of locations in West Sussex. The variable grain size and low
clay content mean that little or no processing is required to produce
high quality construction and mortar sands.
2.2.3 Coarser, sharp sand and gravels lie over the chalk to the north of a line
approximating to the route of the A27 and have been exploited in dry
workings. Overlying the clay to the south, cleaner, better-sorted
gravels have been exploited through wet working as evidenced by lakes
around the eastern and southern fringes of Chichester. Sand and gravel
resources are clustered around Chichester and south of the SDNP from
the Funtington area in the west to Slindon in the east. The sharp sand
and gravel deposits are primarily used to make concrete, concrete
products, or cement.
2.2.4 The SDNP covers almost half the Folkestone Formation in West Sussex,
and part of the sharp sand and gravel resource north of Chichester. The
Chichester Harbour Area of Outstanding Natural Beauty (AONB)
designation includes a small area which contains potential sharp sand
and gravel. The extent of these landscape designations is shown in
‘Appendix A: LAA Map’.
2.2.5 There are no indigenous sources of crushed rock in West Sussex,
therefore, this aggregate is imported into West Sussex by rail or sea.
2.2.6 Much of the soft sand outside the SDNP in West Sussex has been
worked or is currently being worked. The majority of the remaining
6land-won soft sand resources lie within the SDNP. Stakeholder
engagement carried out in 2008/09 provided some information about
the quality of sand and gravel resources outside the National Park. One
operator advised that after some limited investigation (drilling
boreholes, etc.) of unconsolidated sand deposits, anything east of
Steyning was found to be finer and ‘dirtier’ deposits which may make
extraction uneconomic on any significant scale. There has also been no
significant interest in any areas outside of the SDNP, including through
the ‘call for sites’ processes in 2014, and more recently, for the soft
sand review, during 2018.
2.2.7 With regard to sharp sand gravel deposits, operators commented that it
becomes much thinner to the south east and therefore uneconomic to
work. At the western end, it was felt that any deposit south of the A27
would also be uneconomic.
2.2.8 Soft sand from the Sandgate Formation and the Folkestone Formation is
worked in a number of locations in West Sussex. The variable grain size
and low clay content mean that little or no processing is required to
produce high quality building sands for plaster and mortar. Gravel of
varying quality and some sharp sand is used for concrete products,
which cannot be used as a building sand for mortar.
2.3 Land-won Sand and Gravel
2.3.1 Past sales figures for land-won sand and gravel provide an indication of
the contribution that the land-won sources of supply have made to the
total supply of aggregates in West Sussex.
2.3.2 Annual land-won sales data over the past 10 years is presented in
Table 1 and Figure 1.
This shows that sales had fallen from 408,000 tonnes in 2008 to as
low as 238,577 tonnes (2014) during the 10-year period since 2007.
There was an increase in sales in 2016, up to 420,000 tonnes.
The average annual sales figure over the 10-year period for sand and
gravel is 309,206 tonnes and the average for the past three years is
higher (337,597 tonnes).
2.3.3 It is not possible to provide sales figures for individual mineral types but
the average split between the two land-won aggregate types in West
Sussex over the last 10 years is 93% soft sand and 7% sharp sand and
gravel. This equates to 283,306 tonnes of soft sand and 28,128 tonnes
for sharp sand and gravel (10-year annual averages).
2.3.4 As aggregates are used in the building of homes, it is worth considering
housing completion data when considering trends in aggregate sales.
Gross dwelling completions within West Sussex fell from 3,060 in
2008/09 to 2,400 in 2012/13 (a 22% reduction) and there was a
32% drop in land-won sand and gravel sales over the same period.
Housing completions have recovered since 2012/13 (2,400), up to as
high as 4,784 completions in 2015/16, an increase of circa 50%.
Land-won sand and gravel sales increased from 0.28mt in 2012, up
to a high of 0.42mt in 2016, an increase of circa 32%.
7 In 2018, housing completions are almost back at the levels seen in
2015 (up to 4,675). The data suggests a link between housing
completions and aggregate sales, whereby as completions have risen
and fallen in West Sussex, sales of land-won sand and gravel have
also risen and fallen.
2.3.5 As sand and gravel is won from both land-won and marine-won sources,
it is relevant to consider all sand and gravel sales in comparison to
completions. Figure 1 shows that there is some correlation between
aggregate sales and housing completions in West Sussex.
Total sand and gravel sales (land-won and marine-won) were falling
during 2008 and 2009, recovering in 2010 and 2011, which was also
the case in housing completions.
In later years (2014 to 2018) housing completions have steadily
increased, as have sales of aggregates.
There is not a perfect correlation, likely due to the fact that West
Sussex exports significant amounts of both land-won sand and gravel
extracted in West Sussex, and marine sand and gravel landed in
West Sussex.
2.3.6 The general fall in land-won aggregate sales has been replicated in
neighbouring authorities, with Hampshire and Surrey also showing a
downward trend in sales up until 2012; however there have been
increases since. See Table 2 and Figure 2.
In the South East, the overall trend of sales is a year-on-year
general decline in sales, so that by 2017 they were 46% less than in
2007 9. Despite the increasing levels of economic growth recorded
between 2004 and 2007, sales in the South East fell 18% during the
same period. This indicates that the link between sales of
aggregates and economic growth is not clear cut or straightforward.
Sales have increased since 2015, and in 2017 a total of 6.18mt of
land-won sand and gravel were sold, the highest since 2008, and
15% higher than the 10-year average of sales.
With regard to East Sussex, due to the very small number of sand
and gravel sites, there are zero returns for over half of the 10-year
period and the rest of the figures are confidential; therefore no
figures are reported.
9 SEEAWP (2017) South East Aggregates Monitoring Report 2017.
8Table 1: Sales of land-won sand and gravel in West Sussex 2009-2018
Year Sales (tonnes)
2009 287,000
2010 301,000
2011 284,000
2012 284,000
2013 276,692
2014 238,577
2015 244,594
2016 420,000
2017 348,196
2018 430,478
3-year average (2015-2017) 399,318
10-year average 311,433
(283,306 soft sand;
28,128 sharp sand and gravel 10)
Note: Sales data is based on estimates using operator returns, supplemented,
where necessary, by estimates based on past rates and information from site
visits. The figures for soft sand and sharp sand and gravel have been
amalgamated due to reasons of confidentiality.
Figure 1: Sales of sand and gravel in West Sussex compared to housing completions
2009-2018
10 Figures may not add up to 93% and 7% exactly due to rounding.
9Table 2: Sales of land-won sand and gravel in adjoining authorities 2009-2018
Year Hampshire Surrey
2009 1,050,000 850,000
2010 980,000 880,000
2011 830,000 660,000
2012 750,000 620,000
2013 850,000 790,000
2014 880,000 978,000
2015 830,000 740,000
2016 918,000 730,000
2017 963,000 799,000
2018 1,145,000 908,000
3-year average (2016-2018) 719,766 812,000
10-year average (2009-2018) 919,600 795,000
Figure 2: Sales of land-won sand and gravel in adjoining authorities 2009-2018
10Other Relevant Information affecting Aggregate Supply and Demand
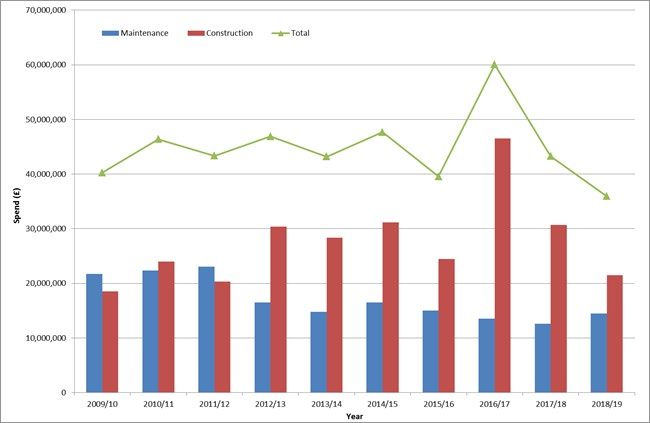
2.3.7 The Authorities have carried out an assessment of the likely demand for
aggregates over the JMLP plan period based on anticipated levels of
construction of homes and the maintenance and construction of roads.
No other major infrastructure projects are anticipated in or near West
Sussex that might influence the demand for aggregate. Scenarios were
developed taking into account two growth factors (housing = 28.8%,
construction of roads = 28.2%). ‘Appendix B: Effect of Housing and
Road Construction on Aggregate Supply and Demand’ explains how
these factors have been derived. This includes assumptions regarding
the level of different aggregate supply related to these uses.
2.3.8 Sharp sand and gravel, soft sand, and crushed rock are considered
separately as they are used for different purposes. This is consistent
with paragraph 207 of the NPPF which states that “Minerals planning
authorities should plan for a steady and adequate supply of aggregates
by … calculating and maintaining separate landbanks for any aggregate
materials of a specific type or quality which have a distinct and separate
market”.
2.3.9 Further other relevant local information includes the fact that mineral
resources, including soft sand, are constrained by the SDNP designation.
Sharp Sand and Gravel
2.3.10 Based on the 10-year average split of sales (93% soft sand and 7%
sharp sand and gravel), the 10 years’ annual sales data for sharp sand
and gravel is 28,128 tonnes. The national PPG states that three-year
average annual sales should also be factored into consideration of a
sales trend. The three-year average annual sales figure for sharp sand
and gravel in West Sussex is 83,758 tonnes. It must be noted that
sales of sharp sand and gravel includes incidental sales from a soft sand
site.
2.3.11 Existing reserves are provided by a single existing permission at
Kingsham gravel site which has an estimated remaining yield of
795,000 tonnes.
2.3.12 Forecast demand scenarios have been established below based on the
following assumptions using the data presented in ‘Appendix B: Effect of
Housing and Road Construction on Aggregate Supply and Demand’.
Assumption 1: Housing is projected to grow by 28.8% in West
Sussex.
Assumption 2: Spending on road maintenance/improvements is
expected to increase by 28.2% in West Sussex.
Assumption 3: Up to 88% of sand and gravel may be used in homes.
Assumption 4: Up to 37% of sand and gravel may be used on road
maintenance/improvements.
2.3.13 The annual demand values associated with each of these scenarios is
set out in Table 3. The table also shows the extent of any predicted
shortfall having regard to the existing reserves.
112.3.14 The calculated maximum average annual demand (demand forecast
scenario 3) is 35,581 tonnes, which suggests that a total of
498,138 tonnes of land-won sharp sand and gravel would need to be
supplied to 2033.
The minimum calculated landbank for sharp sand and gravel, based
on the current reserves against demand forecast scenario 3, is
23 years (calculated by dividing the reserve figure of 795,000 tonnes
by the annual maximum demand figure of 35,581 tonnes).
Therefore, using the 10-year average, there is no theoretical
shortfall of land-won sharp sand and gravel reserves in West
Sussex over the remaining plan period to 2033.
2.3.15 However, national PPG (paragraph 064) states that, in addition to
considering the 10-year average, MPAs should also consider average
annual sales over the previous three years when identifying the general
trend of demand.
Using the three-year sales average of 83,758 tonnes per annum, the
landbank for land-won sharp sand and gravel would be 9.5 years
(that is, the reserve figure of 795,000 tonnes divided by
83,758 tonnes).
Therefore, using a three-year average, the requirement would
be 1,172,617 tonnes (three-year average x 14 years)
resulting in a theoretical shortfall of 377,617 tonnes over the
remaining plan period to 2033; that is, the requirement of
1,172,617 tonnes less the reserve of 795,000 tonnes.
2.3.16 The adopted Joint Minerals Local Plan contains a criteria-based policy
(Policy M1) that allows proposals for the extraction of sharp sand and
gravel on unallocated sites to come forward where they are required to
maintain a steady and adequate supply of land-won sharp sand and
gravel and to maintain at least a seven-year landbank. In determining
the need for such proposals, consideration will be given by the County
Council to both the 10-year and three-year average calculations of
demand.
12Table 3: Sharp sand and gravel demand forecast scenarios 2019-2033 (tonnes)
Annual Demand Value Demand Forecast Scenario 1 Demand Forecast Scenario 2 Demand Forecast Scenario 3
Assumptions applied None (10-year average only) 1, 2, 3, and 4 1 and 2
10-year average 22,663 22,663 22,663
Additional demand for housing n/a 5,744 6,527
Additional demand for roads n/a 2,365 6,391
Total annual requirement 22,663 30,772 35,581
Total requirement over Plan period (2019-2033) 317,285 430,803 498,138
Current reserves 795,000 795,000 795,000
Shortfall (positive)/surplus (negative) -477,715 -364,197 -296,862
13Soft Sand
2.3.17 Based on the 10-year average split of sales (93% soft sand and 7%
sharp sand and gravel), the 10 years annual sales data for soft sand is
288,718 tonnes. The three-year average for annual soft sand sales in
West Sussex is 315,560 tonnes.
2.3.18 Existing reserves are provided by several sites (see Table 6) and
currently amount to 2,300,437 tonnes.
2.3.19 Forecast demand scenarios for land-won soft sand have been
established using the following key assumptions based on data
presented in ‘Appendix B: Effect of Housing and Road Construction on
Aggregate Supply and Demand’.
Assumption 1: Housing is projected to grow by 28.8% in West
Sussex.
Assumption 2: Up to 88% of sand and gravel may be used in the
construction of residential dwellings.
2.3.20 As road maintenance or improvement works do not involve the use of
soft sand, these activities have been excluded from calculations of
demand forecasts for soft sand. These demand forecasts build on the
10-year average of 288,718 tonnes, which are set out in Table 4.
2.3.21 The annual demand values associated with each of these scenarios is
set out in Table 4. The table also shows the extent of any predicted
shortfall having regard to the existing reserves.
2.3.22 Table 4 suggests that additional supplies of between 1.74mt and 2.91mt
of soft sand are needed over the JMLP plan period (to 2033). The
maximum landbank, based on the current reserves against the 10-year
average, is eight years (calculated by dividing the reserve figure of
2,300,437 tonnes by the 10-year average of 288,718). The landbank
based on the highest forecast annual demand (demand forecast
option 3) is 6.2 years (2,300,437 divided by 371,869).
2.3.23 National PPG (paragraph 064) states that MPAs should also consider
average annual sales over the previous three years, to identify the
general trend of demand. Based on the three-year average of soft sand
sales (315,560 tonnes), and current reserves, the landbank is currently
7.3 years. The requirement over the plan period would theoretically be
4,417,835 tonnes (three-year average x 14), and therefore the shortfall
would be 2,117,398 tonnes.
2.3.24 At present, there are seven permitted soft sand sites in the Plan Area,
as set out in Table 6. These sites have a total reserve of
2,300,437 tonnes.
2.3.25 In light of the estimated shortfalls in soft sand supplies it is considered
appropriate to consider the possibility of permitting further reserves of
soft sand if proposals come forward. The Soft Sand Review of the JMLP
considers potential allocations for soft sand reserves, which has been
submitted for examination on its soundness and legal and procedural
compliance. Any future LAAs will replace this LAA as the latest position
in terms of supply and demand of soft sand.
14Table 4: Sharp sand and gravel demand scenarios 2019-2033 (tonnes)
Annual Demand Value Demand Forecast Demand Forecast Demand Forecast
Scenario 1 Scenario 2 Scenario 3
Assumptions applied None 1 and 2 1
(10-year average only)
10-year average 288,718 288,718 288,718
Additional demand for housing n/a 73,173 83,151
Total annual requirement 288,718 361,891 371,869
Total requirement over Plan period (2019-2033) 4,042,059 5,066,478 5,206,172
Current reserves 2,300,437 2,300,437 2,300,437
Shortfall 1,741,622 2,766,041 2,905,735
15Imports and Exports of Land-won Sand and Gravel
2.3.26 West Sussex imports and exports land-won aggregates from/to
surrounding MPAs, as well as further afield, and it is important to
understand the current and potential future issues affecting cross-
boundary movements of land-won sand and gravel between West
Sussex and other neighbouring and more distant mineral planning
authorities.
2.3.27 A national four-yearly aggregate minerals survey is conducted by the
Department of Communities and Local Government (CLG) and the
British Geological Survey (BGS) which includes analysis of the
movements (imports and exports) of aggregates for each MPA in
England and Wales. A survey was not undertaken in 2013, and instead
took place in 2014 – see Aggregate Minerals Survey for England and
Wales 2014. The data presented below comes from the latest national
survey (2014) and from data obtained from the BGS. A further survey
has not taken place; therefore the 2014 data is the best available in
terms of understanding the movement of minerals.
2.3.28 Due to confidentiality restrictions, import and export data figures were
provided by BGS as a percentage range of total supply to each MPA, to
provide an indication of the relative importance of each supplying MPA.
Table 5 shows that in 2014 up to 55,000 tonnes of sand and gravel were
imported into West Sussex, whilst up to 275,600 tonnes of sand and
gravel was exported from West Sussex. Therefore, for land-won sand
and gravel, West Sussex is a net-exporter. Table 5 also shows that
aggregate may be transported considerable distances to and from West
Sussex.
Current Supply of Land-Won Sand and Gravel
2.3.29 Land-won sand and gravel is currently supplied from seven sites in West
Sussex, six of which were operating before the designation of the South
Downs National Park, which now forms part of the plan area and covers
a substantial part of the sand and gravel mineral resource. These sites
are presented in Table 6 and shown in Appendix A: LAA Map. The total
permitted reserve of land-won sand and gravel in West Sussex was
3,095,437 tonnes.
16Table 5: Origin/destination of land-won sand and gravel imported/exported to/from West Sussex, 2014
Origin/Destination Imports to West Sussex (tonnes) Exports from West Sussex (tonnes)
Berkshire Up to 1,000 Up to 12,000
Buckinghamshire and Milton Keynes 0 7,900-79,000
East Sussex and Brighton & Hove 0 2,600-29,000
Hampshire and Isle of Wight 1,000-10,000 Up to 17,600
Oxfordshire Up to 1,000 0
Kent and Medway Up to 1,000 0
Surrey 10,000-20,000 7,600-84,000
South East Region Sub-total 11,000-33,000 18,100-221,600
Cambridgeshire Up to 1,000 0
Dorset Up to 1,000 0
Essex 30,000-40,000 0
Wilshire and Swindon 0 Up to 5,400
Unknown, in the South West Unknown 24,300-48,600
Outside South East Region Sub-Total 30,000-42,000 24,300-54,000
Overall Total Imports/Exports 41,000-55,000 42,400-275,600
(excluding West Sussex consumption) 11
Source: Data obtained from the British Geological Survey and was based on the 2014 Aggregate Minerals Survey.
Note: Ranges are provided due to confidentiality restrictions.
11 There is also some (between 15,400 and 154,000 tonnes) of land-won sand and gravel that was consumed in the South East, however the final
destination for its consumption is recorded as “unknown”. It is presumed that some of this would have been consumed in West Sussex, whilst some
consumed in other areas around the South East.
17Table 6: Permitted sand and gravel quarries in West Sussex (2019)
Soft Sand
Location Site Operator Status
SDNP West Heath Quarry, West Harting, Petersfield CEMEX UK Operations Active – Sand extraction
SDNP Heath End Quarry, Station Road, Heath End, Petworth 12 Dudman Group Ltd. Active – Sand extraction.
SDNP Minsted Sandpit, Minsted Lane, Stedham Dudman Group Ltd. Inactive
West Sussex Rock Common Sandpit, Washington, Pulborough Dudman Group Ltd. Active – Sand extraction.
West Sussex Sandgate Park Quarry, Water Lane, Sullington, Storrington CEMEX UK Operations Active – Sand extraction.
West Sussex Washington Sand Pit, Hampers Lane, Sullington Britaniacrest Recycling Ltd. Active – Sand extraction.
West Sussex Chantry Sand Pit, Chantry Lane, Storrington Dudman Group Ltd. Inactive
Sharp Sand and Gravel
Location Site Operator Status
West Sussex Land at Kingsham, South of Chichester, Chichester Dudman Group Ltd. Active – Sand and gravel
extraction.
Note: In accordance with the PPG, mineral sites that are subject to a stalled review of their planning conditions have not
been included in the assessment of existing reserves.
12 Continued extraction permitted on appeal – 6 September 2016.
18Potential Constraints to Future Land-won Supply
2.3.30 West Sussex has a number of environmental and landscape
designations, including the South Downs National Park (SDNP) which is
afforded the highest level of protection by national policy. These
designations can restrict, and may continue to restrict, opportunities for
future minerals development, particularly in regard to land-won
extraction. Consideration of future supply from within the SDNP will be
considered through the soft sand review of the JMLP.
2.3.31 In accordance with the national PPG, it is important that the effects of
environmental constraints are taken into account, as ‘other relevant
local information’, when considering options for meeting aggregate
demand through the Plan period. This is especially pertinent to
consideration of the future supply of soft sand as the majority of the
resource in West Sussex is located within the SDNP.
2.3.32 Floodplains, Source Protection Zones (SPZs), secondary and principal
aquifers, groundwater depth, geology, and smaller abstractions are also
constraints that need to be taken into consideration when identifying
suitable sites for mineral extraction.
2.3.33 Minerals development should not have a significant impact on
communities if they are designed, managed, and located appropriately.
However, concerns may still be raised about the potential impacts of
noise and dust, as well as associated lorry movements, particularly at
the planning application stage. Such issues need to be addressed to
ensure that minerals development does not significantly impact the
amenity of local communities.
2.3.34 Soft sand has specific applications for which concreting and other
aggregate materials are unsuitable and is most commonly used in
mortar. The South Downs Soft Sand Study (2012) states that the
Crown Estate “believe that there is potential for marine sources to
provide viable ‘soft’ sand as an alternative to land-based quarrying”.
There are sources of marine-won aggregate being used, as a
replacement, or through blending, to create mortar.
In 2014, in England and Wales, 1.05mt of marine-won aggregate
was used in mortar. Of this, 72,000 tonnes were sold in the South
East.
The SEEAWP South-East England Aggregates Monitoring Report 2017
sets out that some 50,710 tonnes of marine soft sand was sold from
South East wharves (Table 8).
Evidence collated via the annual Aggregate Monitoring Surveys
shows that during the three-year period 2016-2018, an annual
average of around 39,773 tonnes of aggregate sold from West
Sussex wharves was sold as soft sand. Not all of this was recorded
as marine-won however, with the three-year average of marine-won
soft sands being 23,278 tonnes per annum, and remainder being
land-won sands.
Historically the aggregate available on the South Coast have not
been considered to be suitable for soft sand. The West Sussex Joint
19Minerals Local Plan safeguards sufficient wharf capacity in West
Sussex (see Table 21 in the JMLP).
Land–Won Sand and Gravel Summary
Past to current demand:
Sales of land-won sand and gravel have generally fallen during the
last 15 years, from a high of 784,000 tonnes in 2004 to as low as
238,577 tonnes in 2014. Sales had fluctuated, with 420,000 tonnes
sold in 2016, but only 348,196 tonnes sold in 2017, and an increase
in 2018, up to 430,478 tonnes.
Average sales of land-won sand and gravel over the last 10 years is
311,454 tonnes.
Average sales of soft sand over the last 10 years is
288,718 tonnes.
Average sales of sharp sand and gravel over the last 10 years are
22,663 tonnes.
Other relevant local information:
For sharp sand and gravel, based on the calculated maximum annual
demand (demand forecast scenario 3), there are sufficient levels of
permitted reserves to 2033.
For soft sand, when applying a rolling 10-year average and other
relevant local information, an additional 1.74mt to 2.91mt are
needed over the Plan period (to 2033). For soft sand, when applying
the three-year average, shortfalls would be lower, at an additional
2.12mt being required over the plan period.
Imports and exports (of land-won and marine-won sand and
gravel):
In 2014 up to 0.23mt of sand and gravel was imported into West
Sussex.
In 2014, up to 1.82mt of sand and gravel was exported from West
Sussex.
As such, West Sussex is a net exporter of sand and gravel.
Supply:
In 2018, the total permitted reserve of land-won sand and gravel
was 3,095,437 tonnes.
There are no allocations for sharp sand and gravel in the Joint
Minerals Local Plan (2018).
The soft sand review of the Joint Minerals Local Plan is being
progressed, and the authorities are proposing the allocation of three
sites, with a combined yield of circa 2.68mt.
202.4 Marine-Won Sand and Gravel
2.4.1 A steady and significant supply of marine-won sand and gravel is landed
at wharves in West Sussex. This is a major source of primary aggregate
and also a principal alternative source to land-won aggregate.
Marine-won sand and gravel landed in the South East of England is
primarily used as a replacement for sharp sand and gravel, and is not
considered a viable substitute for soft/building sand at this time.
2.4.2 The Joint Minerals Local Plan (2018) safeguards wharves from
development which may prevent or prejudice their operation, and to
ensure that a steady and adequate supply of minerals can be
maintained.
2.4.3 Although marine-won aggregates were landed at Littlehampton in the
past, this activity ceased in 2004 when the aggregate processing plant
was removed. The full potential of Railway Wharf, Littlehampton would
only be realised if the operator re-established a marine aggregate
processing plant, and if navigation/silting problems on the River Arun
were resolved to allow continued access for small dredgers. The wharf
at Littlehampton is currently used to import crushed rock by sea, for use
in the adjacent Coated Roadstone Plant. This leaves Shoreham as the
only port used for landing marine-won sand and gravel in the County.
2.4.4 National marine policy is contained within the Marine Policy Statement
(MPS) which sets out a framework for preparing marine plans and
taking decisions affecting the marine environment. The South Marine
Plan (SMP) was adopted in July 2018 and covers an area which is the
second busiest in England for marine aggregate extraction, with a total
area that is licensed for aggregate extraction of 155.47km2. The SMP
contains policies to ensure that aggregate extraction licensed areas are
protected for that use, whilst those areas with high aggregate potential
are also protected.
2.4.5 Mineral rights for marine-won sand and gravel are owned by the Crown
Estate, who issue licences for dredging activity. Marine-won sand and
gravel landed in West Sussex is dredged from the channel in the ‘South
Coast’ region which is the largest dredging region in terms of permitted
tonnages. There are currently 15 production licences allowing the
extraction of 8.63 million tonnes per year, and an estimate of 29 years
of production permitted.
Use of Marine-Won Aggregate
2.4.6 Marine-won aggregates from the SMP areas are predominantly of a
similar nature of sharp sand and gravel. They are used for producing
concrete, transport infrastructure, replenishing beaches, and improving
coastal defences, as well as being exported to neighbouring European
countries 13. As marine- and land-won aggregates are geologically
similar, they can be easily substituted for one another in many uses.
2.4.7 A publication on marine sands in mortars and screeds from the British
Marine Aggregate Producers Association (BMAPA) states that the main
difference between the majority of land-based sands and marine sands
13 Crown Estate (2018). Marine Aggregates Extraction 2017 – 20th Annual Report
21are the presence of chloride and shell. The publication states that there
is occasionally resistance by specifiers and purchasers to resist the use
of marine-won sands due to their potential to include low levels of
chlorides but concludes that marine sands show no aesthetic problems
associated with sand source 14.
2.4.8 The Marine Sand and Gravel Resources map produced by BGS and the
Crown Estate shows the current and potential marine sand and gravel
resources, as well as current licensed areas; see Offshore Mineral
Resource Maps on BGS’ website. This indicates that there are some
areas of ‘fine sand’ within the South Marine Plan onshore and offshore
areas, but that the currently licensed areas are in areas of coarse sand
and coarse aggregate. The accompanying report states that the map
delineates areas within which potentially workable minerals may occur
but that this takes no account of planning constraints that may limit
their working and that the economic potential of individual sites can only
be proved by a detailed evaluation programme 15.
2.4.9 Research undertaken provided the Authorities anecdotal evidence that
suggests mortar manufacturers in the south east may be using
marine-won sand in their mortar products in place of land-won soft
sand. The use of marine-won sand in mortar is commonplace in other
parts of England, however there is no detailed evidence of this taking
place in the south east.
Pattern of Previous Landings and Sales and Current Demand for
Marine-won Aggregate
2.4.10 Landings of marine-won aggregate at wharves in West Sussex have
increased steadily over the last 10 years with a particularly marked
increase observed since 2010 (Table 7).
2.4.11 Landings of marine-won aggregate at wharves in West Sussex make a
significant contribution to overall aggregate supplies in West Sussex and
neighbouring authorities (particularly East Sussex and Brighton & Hove).
14 British Marine Aggregate Producers Association
15British Geological Survey (2013) The Mineral Resources of the English Channel and Thames
Estuary
22Table 7: Landings and sales of marine-won sand and gravel at West Sussex wharves
2009-2018
Year Landings of marine-won Sales of marine-won sand and
sand and gravel (tonnes) gravel from wharves (tonnes)
2009 755,018 872,267
2010 877,799 899,944
2011 1,203,574 1,213,356
2012 1,052,976 1,470,023
2013 1,029,108 1,616,136
2014 1,090,138 1,626,551
2015 1,173,304 1,639,146
2016 1,254,255 1,809,675
2017 1,307,447 1,340,189
2018 1,318,508 1,347,922
3-year average 1,293,403 1,499,262
10-year average 1,106,153 1,383,521
2,000,000
1,800,000
1,600,000
1,400,000
1,200,000
1,000,000
800,000
600,000
400,000
Landings of marine dredged sand and gravel (tonnes)
200,000
Sales of marine dredged sand and gravel from wharves
(tonnes)
0
2009 2010 2011 2012 2013 2014 2015 2016 2017 2018
Figure 3: Landings and sales of marine-won sand and gravel at West Sussex wharves
2009-2018
23Future Demand for Marine-Won Sand and Gravel
2.4.12 Forecasts of future demand for marine-won aggregate are based on
landings data (provided by the Crown Estate) as this removes the
element of double counting, whereby some operators of wharves are
buying aggregate from other wharf operators and reporting their sales.
Landings data therefore provides a more accurate picture of future
demand.
2.4.13 Different scenarios on future demand have been derived based on
different mixes of the following assumptions.
Assumption 1: Housing is projected to grow by 28.8% in West
Sussex.
Assumption 2: Spending on road maintenance/improvements is
expected to increase by 28.2% in West Sussex.
Assumption 3: Up to 88% of sand and gravel may be used in homes.
Assumption 4: Up to 37% of sand and gravel may be used on road
maintenance/improvements.
Other Relevant Local Information
2.4.14 A large amount of marine-won sand and gravel is exported to Brighton
& Hove and East Sussex, where housing growth is predicted to grow by
an estimated 61.75%. However, for the purposes of forecasting
demand, the projected growth of housing figure for West Sussex
(26.8%) has been used because it is considered more relevant,
particularly when compared to other neighbouring areas, where the
average is less than 30%, but the actual number of homes is
considerably higher. These forecasts build on the 10-year average of
annual landings (1,003,747 tonnes) and are set out in Table 8.
2.4.15 The demand forecast based on landings data shows that demand could
be as high as 1,736,660 tonnes per annum. If this is compared to the
estimated capacity at wharves in West Sussex, there would significant
additional capacity available. The wharves do however also import
crushed rock; therefore, total annual capacity requirements for wharves
are discussed later in this report.
24Table 8: Demand forecast scenarios for marine-won sand and gravel based on landings 2019–2033 (tonnes per annum)
Annual Demand Value Demand Forecast: Demand Forecast: Demand Forecast:
Scenario 1(B) Scenario 2(B) Scenario 3(B)
Assumptions applied None (10-year average only) 1, 2, 3, and 4 1 and 2
10-year average 1,106,153 1,106,153 1,106,153
Additional demand for housing n/a 280,343 318,572
Additional demand for roads n/a 115,416 311,935
Total annual requirement 1,106,153 1,501,912 1,736,660
25Imports and Exports
2.4.16 The East Sussex and Brighton & Hove LAA (2018) states that some 60%
of the total marine sand and gravel consumed in East Sussex and
Brighton & Hove in 2011 was supplied from wharves at Shoreham
Harbour in West Sussex which means development in these areas is
heavily dependent on landings of marine-won sand and gravel at these
wharves. Imports and exports of marine-won sand and gravel also
occur between West Sussex and Hampshire.
Current Supply of Marine-Won Sand and Gravel
2.4.17 The mineral wharves in West Sussex are primarily used for landing
marine-won sand and gravel; however, they also land a modest
proportion of crushed rock. The number of wharves within Shoreham
Harbour has reduced in number in recent years. The JMLP safeguards a
number of wharves, including one for its potential capacity. Capacity of
West Sussex wharves is 2,070,000tpa, a reduction in capacity following
the closure of one wharf which relocated from the Western Harbour Arm
in Shoreham to the Eastern Harbour Arm (to Brittania Wharf), which
falls within the Brighton & Hove authority area.
Marine-Won Sand and Gravel Summary
The South Marine Plan areas are the busiest in England for marine
aggregate extraction.
8.63mt of material is permitted for extraction per annum from
licences within the ‘South Coast Region’.
Pattern of previous landings and sales and current demand for
marine-won aggregate:
Landings and sales on marine-won sand and gravel in West Sussex
have increased steadily over the last 10 years with a marked
increase since 2011.
The 10-year average of annual marine-won sales is
1,383,521 tonnes and 1,106,153 tonnes of landings.
For the purposes of assessing demand, landings data has been used
because this eliminates an element of double counting that has been
identified.
Other relevant local information:
The demand forecast based on landings data shows that demand
could be as high as 1,736,660 tonnes per annum.
Imports and exports:
Marine-won aggregates make a significant contribution to aggregate
supply in West Sussex and neighbouring authorities (particularly East
Sussex and Brighton & Hove) due to declining supplies from
land-won sources in the area.
Wharf capacity:
The capacity at wharves in West Sussex has fallen from
2,274,000 tonnes per annum down to 2,070,000 tonnes per annum
26since the adoption of the JMLP. This is following the closure of one
wharf, which has relocated to another part of Shoreham Harbour (in
Brighton & Hove).
Based on maximum landings of marine-won sand and gravel from
West Sussex wharves between 2009 and 2018 (1,318,508 tonnes),
there would be a theoretical minimum surplus capacity of
751,492 tonnes.
Marine-won landings ceased in Littlehampton in 2005, although
crushed rock landed at the wharf continues to serve the adjacent
coated roadstone plant.
2.5 Sand and Gravel Imported by Rail
2.5.1 A relatively small amount of sand and gravel is imported into West
Sussex by rail which could be either from marine-won or land-won
sources (sharp sand and gravel, or soft sand). Evidence from
stakeholder engagement in 2008/09 showed that most of the sand and
gravel that came into one of the Crawley depots was bagged for
builders’ merchants or collected from the depot by building contractors.
The vast majority of materials are delivered to fairly local destinations
within a 20-mile radius due to the haulage costs.
Pattern of Previous Sales and Current Demand for Sand and Gravel
Imported by Rail
2.5.2 Table 11 and Figure 4 show that sales of sand and gravel from railheads
within West Sussex have fluctuated over the last 10-year period,
peaking at 225,303 tonnes in 2009 and generally declining thereafter.
There has been a steady increase since 2014, from 41,521 tonnes to
83,947 in 2017. The 10-year average annual sales of sand and gravel
from railheads is 116,922 tonnes and the three-year average is
89,529 tonnes.
27Table 9: Imports of sand and gravel to West Sussex railheads 2009-2018
Year Sales of sand and gravel from railheads (tonnes)
2009 225,303
2010 195,599
2011 88,845
2012 140,466
2013 146,585
2014 41,521 16
2015 63,019
2016 76,961
2017 83,947
2018 107,678
3-year average 89,529
10-year average 116,922
250,000
Sales of sand and gravel from railheads
200,000
150,000
Tonnes
100,000
50,000
0
2009 2010 2011 2012 2013 2014 2015 2016 2017 2018
Year
Figure 4: Imports of sand and gravel to West Sussex Railheads 2009-2018 (tonnes)
16 The fall in imports of sand and gravel in 2014 can be attributed to the fact that one railhead
became inactive during 2014 and therefore reported nil returns. The imports to Chichester rail
sidings were also previously reported as being sand and gravel but information provided the
operator shows imports of both sand and gravel and crushed rock.
28Future Demand for Sand and Gravel Imported by Rail
2.5.3 Two demand forecasts have been created taking account of the 10-year
average of sales (116,992) and other relevant local information set out
in the following assumptions.
Assumption 1: Housing is projected to grow by 28.8% in West
Sussex.
Assumption 2: Spending on road maintenance/improvements is
expected to increase by 28.2% in West Sussex.
Assumption 3: Up to 88% of sand and gravel may be used in homes.
Assumption 4: Up to 37% of sand and gravel may be used on road
maintenance/improvements.
2.5.4 The demand forecast scenarios are set out in Table 10.
2.5.5 Table 10 indicates that future demand for sand and gravel being
imported by rail to West Sussex railheads may be as high at
183,678 tonnes per annum.
29You can also read