Assessment of the Supermarkets and Grocery Stores Sector in Australia: A Case Study of Woolworths and Coles using DEA and VAIC
←
→
Page content transcription
If your browser does not render page correctly, please read the page content below
Please do not remove this page

Assessment of the Supermarkets and Grocery
Stores Sector in Australia: A Case Study of
Woolworths and Coles using DEA and VAIC™
Van Kampen, Toine; Kirkham, Ross
https://research.usc.edu.au/discovery/delivery/61USC_INST:ResearchRepository/12132822630002621?l#13137209350002621

Van Kampen, T., & Kirkham, R. (2020). Assessment of the Supermarkets and Grocery Stores Sector in
Australia: A Case Study of Woolworths and Coles using DEA and VAIC™. Journal of New Business Ideas &
Trends, 18(1), 1–11.
https://research.usc.edu.au/discovery/fulldisplay/alma99482293102621/61USC_INST:ResearchRepository

Document Type: Published Version

USC Research Bank: https://research.usc.edu.au
research-repository@usc.edu.au
Copyright © 2020 JNBIT. Reproduced with permission of the publisher.
Downloaded On 2021/06/03 07:18:33 +1000

Please do not remove this page
Van Kampen & Kirkham – Volume 18 Issue 1 (2020)

Journal of New Business Ideas & Trends
2020, 18(1), June, pp. 1-11.
”http://www.jnbit.org”

  Assessment of the Supermarkets and Grocery Stores
  Sector in Australia: A Case Study of Woolworths and
              Coles using DEA and VAIC™

Toine Van Kampen
KPMG, Australia

Ross Kirkham
University of the Sunshine Coast, Australia

Abstract
Purpose – The purpose of this study is to examine the level of efficiency in the retail Supermarket
and Grocery Stores sector.
Design/methodology/approach –Financial data from the annual reports of two companies
registered on the Australian Stock Exchange (Woolworths and Coles) was extracted for the four
years 2016 to 2019. Two models were used, DEA and VAIC™ to analyse the financial data to
determine elements to assess the level of efficiency each company was achieving.
Findings – There was some degree of diversity identified as existing between the two companies.
The results from the DEA and VAIC™ produced similar outcomes however, the two financial ratios
(ROA and CFOROA) produce somewhat contrasting results in terms of differentiating between the
performance of the two companies.
Research limitations/implications – Whilst there are no industry or sector standards
available the findings stand as relevant for the purpose of comparison between the two main
players in the sector. These companies both have a high degree of diversity, however they share
very similar forms of diversity in regards to specific segments.

Keywords: Intellectual capital; financial statement analysis; value added intellectual coefficient
model (VAIC™); data envelopment analysis (DEA); Supermarkets and Grocery Stores.

JEL Classifications: M14
PsycINFO Classifications: 3650
FoR Codes: 1501
ERA Journal ID #: 40840

© JNBIT Vol.18, Iss.1 (2020)                                                                           1
Van Kampen & Kirkham – Volume 18 Issue 1 (2020)
Introduction
In the current financial and economic climate, it is essential for investors and indeed
management to monitor the financial performance of companies and this is especially pertinent in
the retail industry. The retail industry has been confronted by many competitive challenges in the
past. The most recent being online retailing which has allowed the entry of new innovative global
retailers into what was previously a closed market. This intensified competition may be beneficial for
consumers, but it is an extensive challenge for the retail industry.
As of 2011 there were almost 140 000 retail businesses in Australia, accounting for 4.1 per cent
of GDP and 10.7 per cent of employment (Productivity Commission Report, 2011). Australia also
appeared to be lagging behind a number of comparable countries with regards to the development of
online retailing. The Productivity Commission (2011) estimated that at the time online retailing
represented 6 per cent of total Australian retail sales and this was broken down into 4 per cent
domestic online ($8.4 billion) and 2 per cent from overseas ($4.2 billion).
The retail industry is comprised of a diverse number of sectors which reflect the nature of
goods sold and the retail format encompassed by the various business structures. In this regards the
most significant type of retail operation that plays a vital role in the domestic market would have to
be represented by the category of Supermarkets and Grocery Stores. This sector is one of the most
competitive in Australia. Supermarkets and grocery stores are involved in retailing a range of
groceries and food products, including fruit and vegetables, bread, cigarettes, canned goods,
toiletries, dairy goods, delicatessen items and cleaning goods (IBISWorld report, 2020). With the
seemingly explosion of ALDI stores the sector has significantly altered the industry's operating focus,
with smaller supermarket chains closing or being taken over. ALDI's presence has caused the two
established giants of the sector, Woolworths and Coles, to engage in cutting prices and expanding
their private-label product ranges in response. As a result the companies that now hold the largest
market share in the Supermarkets and Grocery Stores in Australia are effectively, Woolworths Group
Limited, Coles Group Limited, Aldi Stores (A Limited Partnership) and Metcash Limited (IBISWorld
report, 2020).
For the purpose of this study, the evaluation of the performance of the two leading companies
in the Supermarkets and Grocery Stores, Woolworths Group Limited, Coles Group Limited, will focus
on the performance efficiency of the organisations.
Literature review
Research into the retail industry and specifically the supermarket and grocery store sector has
involved the use of rather diverse methods and studies have examined performance and efficiency
using a disparate range of variables and issues. Efficiency of the retail supermarkets has been
examined using data envelopment analysis, Sellers-Rubio and Mas-Ruiz (2006) examined the
performance of 100 Spanish supermarket chains over the period 1995 to 2001 they used number of
employees, number of outlets and capital to operationalise the inputs and to operationalise the
outputs they used sales and profits they found high levels of inefficiency. In a similar study,
Athanassopoulos and Ballantine (1995) used DEA to compare the efficiency of supermarket chains
operating in the United Kingdom using capital employed, fixed assets, number of employees, number
of outlets and sales area to operationalise the inputs and total sales to operationalise the output.
Barros (2006) used a two stage approach, involving the use of DEA and a Tobit regression model, to
examine the efficiency in Portuguese hypermarkets and supermarkets. The inputs were
operationalised as labour, and capital while the outputs were operationalised as sales, operational
results and value added. The findings were that the efficiency of hypermarkets and supermarkets was
high compared to the levels found in other sectors and that larger retail groups were generally more
efficient than the smaller retailers. In a study involving a variation on the DEA model Vaz, Camanho
and Guimarães (2010) examined supermarket store in Portugal and operationalised the inputs using
the number of different products on sale, the value of the products for sale, the value of products
stolen, spoiled or disposed after expiry date.
Taking a different approach, Kämäräinen, Småros, Holmström and Jaakola (2001) examined
the cost effectiveness of the relatively new phenomena of e-grocery stores and the focus being on the
© JNBIT Vol.18, Iss.1 (2020) 2Van Kampen & Kirkham – Volume 18 Issue 1 (2020)
operational expediency in terms of use of automation and number of distribution centres to meet
demand. They reported that full capacity of distribution centres was efficiently utilised due the
fluctuation in demand and that this lead to low investment in automation due to the diminishing
financial attractiveness of such operations. This was supported by the study undertaken by
Tanskanen, Yrjölä & Holmström (2002) they focused on approaches to achieving profitability in the
internet grocery retailing identifying issues such as supply chain management and in particular to the
need to concentrate on the sales per geographic area.
In contrast research has also been undertaken to examine the performance of retail
supermarkets and grocery stores in terms of the use of intellectual capital. A case study undertaken
by Lueg, Nedergaard and Svendgaard (2013) examined the use of intellectual capital as a competitive
tool in a large Danish retail chain that consisted of two segments one retail food and groceries with
the other being garden centres and hardware. The case study revealed the need to concentrate on
different business strategies for the different segments with emphasis on customers, employees,
technology and processes. As an extension to the relevance Watson, Stanworth, Healeas, Purdy and
Stanworth (2005) explored the implications of intellectual capital in the approaches employed by
organisations in the UK involved in franchising their retail shops. They pointed to there being a
relationship between the head office structure, communication strategy, and a willingness to accept
franchisee recommendations for innovative changes.
Method
Source of Data
The financial data used in this study was derived from the annual financial reports of
Woolworths Group Limited and Coles Group Limited, both are publicly listed companies and the data
was publicly available on the internet. The annual financial reports are for the four financial years
from 2016 to 2019. The demographic data concerning the retail side of the two companies being
examined are presented in Table 1.
Table 1:
Demographic Data of Retail Stores
Coles Woolworths
Supermarkets Coles (807 stores); Coles Express and Woolworths (995 stores);
Coles Online Woolworths Online
Department Stores Kmart and Target Big W
Home Improvement Bunnings Warehouse
Office Supplies Officeworks
Liquor Supplies First Choice; Liquorland and Vintage BWS; Dan Murphy’s; Langtons
Cellars and Cellarmaster
In this study two models to assess the efficient performance are used. The first is the data
envelopment analysis method (DEA) initially conceived by Farrell (1957) for single input/output
analysis and extended by Charnes, Cooper and Rhodes (1978) to accommodate multiple input/output
analysis. The second is the value added intellectual coefficient model (VAIC™) developed by Pulic
(1998, 2000, 2004).
DEA Model
In simple terms the DEA approach uses linear programming methods to calculate the scores of
the variables to construct an optimal scale of the level of efficiency (Norman & Stoker, 1991).
Following on from the prior research identified in the literature review the variables for this study
will be operationalise in the following manner: inputs - number of outlets; wages; and inventory; and
outputs – sales; and profits.
A key consideration in the application of a DEA model is the selection of inputs and outputs
(Coelli, 1996): the outputs should reflect the business goals, and the inputs should be the required
© JNBIT Vol.18, Iss.1 (2020) 3Van Kampen & Kirkham – Volume 18 Issue 1 (2020)
resources for achieving those goals (Charnes Cooper, Lewin & Seiford, 1994). A constraint in any
empirical study can be the availability of data and this particularly true in this situation because the
data is primarily derived from the annual financial reports. However, there is evidence that supports
the use of financial information to generate a multi-factor financial performance model that
effectively acknowledges trade-offs amongst various financial measures (Zhu, 2000). It is this
approach that is employed where the data for each company is derived from the consolidated
financial statements of companies.
The outputs used are sales revenues and earnings, which are frequently stated as strategic
objectives. Note that the earnings metric used was neither net profit (bottom line), as this can be
subject to tax differences and the effect of extraordinary items, nor was it operational profit, which
can be subject to the effect of different types of amortization/depreciation policies as well as
management strategies in relation to real estate ownership. Rather, the EBITDA was used to measure
of operating performance because it is not subject to the limitations of net profit and operational
profit.
As for inputs, the chosen variables also are a reflection of the strategic, financial, and
operational decisions that contribute to the outputs considered (sales revenues and EBITDA).
Strategic decisions are often attributable to the investments made, such as the type and amount of
fixed assets, the types of contracts and the mode of ownership, and all of these can be inherent in the
fixed assets. Further, financial decisions tend to define the capital structure and subsequently, impact
on the shareholder’s equity. Finally, operational decisions are intrinsically linked to both the cost of
the service provided and the working capital requirements such as inventory and accounts receivable,
hence these types of decisions encapsulate the current assets. In summary, the variables selected to
operationalise inputs are the current assets, net fixed assets, shareholders’ equity and cost of goods
and services. The DEA model is reflected in the overview presented in Figure 1.
Figure 1:
Overview of the DEA Model
Note: EBITDA stands for Earnings Before Interest Tax Depreciation Amortisation
The DEAP package available from the University of Queensland (Coelli, 2019) was the software
used to compute the DEA model for this study. The efficiency index initially assumes a constant
returns-to-scale (CRS), in which an increase in the inputs would be followed by the same
proportional increase in the outputs for all subjects, ignoring the firms’ scale or size (Charnes et al.,
1978) commonly referred to as the technical efficiency (TE). However, as this study is interested in
the change in productivity over time the DEA – Malmquist index (Malmquist, 1953) is used. The use
of DEA efficiency scores to calculate the Malmquist index is recognized as being appropriate for
measuring productivity changes over time (Berg et al., 1992).
VAIC™ Model
The next model is the VAIC™ which is aimed at measuring the total value creation efficiency of
a company. Inherent in the model is the, Intellectual Capital Efficiency (ICE), and this highlights the
efficiency of intellectual capital (IC) within a company. The VAIC™ method is based on the premise
that value creation is effectively derived from two sources: physical capital resources and intellectual
© JNBIT Vol.18, Iss.1 (2020) 4Van Kampen & Kirkham – Volume 18 Issue 1 (2020)
capital resources. To this extent, the VAIC™ model is concerned with providing an indication of the
total efficiency of value creation from all resources employed and embedded in this model is the
notion that ICE is a reflection of the efficiency of value otherwise created by the IC employed. This in
effect means that the better a company’s resources have been used it can be expected that the higher
the company’s value creation efficiency level will be reflected in the outcome of the model (Pulic,
2000).
The VAIC™ model is a reasonably simple process (Schneider, 1998) which utilises publicly
available data (Andriessen, 2004), that in turn is derived from a standardised source (Williams,
2001), which has been externally audited (Firer and Williams, 2003), and as a consequence this
makes the data and the results far more objective and verifiable (Pulic,1998, 2000).
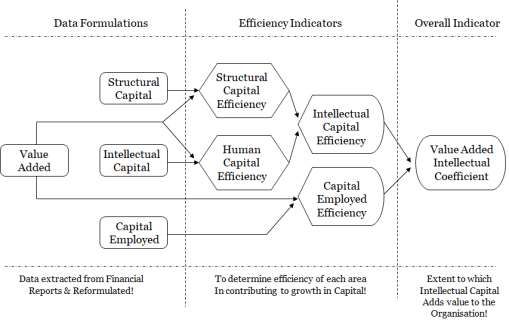
The VAIC™ model is concerned with assigning values through data formulas to the establish in
the first instance: value added (VA), structural capital (SC), intellectual capital (IC), and capital
employed (CE), and this is then followed by determining the efficiency indicators of: structural
capital efficiency, human capital efficiency, intellectual capital efficiency, and capital employed
efficiency, with the final outcome being the overall indicator of the VAIC index. The result is intended
to provide a measure of the extent to which a company creates added value (Pulic,1998, 2000). The
concept is basically explained by the following overview as presented in Figure 2.
Figure 2:
Overview of the VAIC™ Model
Source: Laing, Dunn & Hughes-Lucas (2010)
The VAIC™ model construction involves the calculation of seven key elements and each stage
has its pertinent variables expressed in the formulas as the model progresses to the ultimate
identification of the Value Added Intellectual coefficient (VAIC™). The formulas and the sources of
the pertinent variables required to operationalise them are presented in a step by step approach in
Table 2.
© JNBIT Vol.18, Iss.1 (2020) 5Van Kampen & Kirkham – Volume 18 Issue 1 (2020)
Table 2:
VAIC™ Calculations by Steps
Steps Title Variables Source Comment
Formula Operationalised
1 Value Added OP = Operating Profit; Profit & Loss Employee costs are added back to
(VA) EC = Employee Costs; Statement; operating profit because these costs are
VA = OP + EC + D + A D = Depreciation; Notes to now treated as part of the intellectual
A = Amortisation Financial capital (i.e. a form of asset);
Statements
2 Intellectual Capital SC = Structural Capital Profit & Loss
(IC) HC = Human Capital Statement;
IC = EC + SC SC = VA – HC Notes to
Financial
Statements
3 Human Capital Efficiency Fiat measure Human Capital Efficiency is an indicator of
(HCE) (derived) the efficiency of human capital resources
HCE = VA / HC to add value.
4 Structural Capital Efficiency Fiat measure
(SCE) (derived)
SCE = SC / VA
5 Intellectual Capital Efficiency Fiat measure “… ICE reflects the efficiency of value
(ICE) (derived) created by the IC (Intellectual capital)
ICE = HCE + SCE employed.” (Kujansivu & Lonnqvist, 2007,
276)
6 Capital Employed Efficiency CE = Book-value of Net Balance Capital Employed Efficiency indicates how
(CEE) Assets Sheet much of the added value is generated from
CEE = VA / CE Statement; the capital employed.
Notes to
Financial
Statements
7 Value Added Intellectual Fiat measure “VAIC™ measures how much new value
coefficient (VAIC™) (derived) has been created per invested monetary
VAIC = ICE + CEE unit in each resource. A high coefficient
indicates a higher value creation using
the company’s resources, including its
intellectual capital.” (Pulic, 2004, 65)
“ … VAIC™ does not present the
monetary value of IC (Intellectual
capital). Instead, it considers different
efficiency factors related to IC, and in
so doing, evaluates how effectively the
organisation’s IC adds value to the
organisation.” (Kujansivu & Lonnqvist,
2007, 276)
Source: Laing, Dunn & Hughes-Lucas (2010)
Results and Analysis
DEA Results
An output orientated Malmquist DEA analysis was performed to analyse the productivity
change over time. However, as all the indices are relative to the previous year the results begin with
year 2, which in this case is 2017. The DEA-Malmquist index summary of annual means is presented
in Table 3.
Table 3:
DEA-Malmquist Index Summary of Annual Means
Year effch techch pech sech tfpch
2017 1.000 0.931 1.000 1.000 0.931
2018 1.000 0.879 1.000 1.000 0.879
2019 1.000 0.801 1.000 1.000 0.801
Mean 1.000 0.869 1.000 1.000 0.869
The analysis for the annual means indicates that for the year 2017, the total factor
productivity change (tfpch) was 0.931 or 93.1% from the previous year (2016). However, in the next
year (2018) it declined to 0.879 or 87.9% and this decline continued with the year 2019. The
© JNBIT Vol.18, Iss.1 (2020) 6Van Kampen & Kirkham – Volume 18 Issue 1 (2020)
interpretation on this point is that in the year 2017 the technological change (techch) contributed
93.1% to the growth in the output variables. In terms of the following two years even though they
produced lower percentages the technological change (techch) did contribute to the output variables
but at a lower amount – 2018 only 87.9% and 2019 only 80.1%.
Focusing on the company means, the results are presented in Table 4 below. With regards to
the pure technical efficiency (pech) and the scale efficiency (sech) both have a value of 1.00 or 100%
respectively with no change in any of the years indicating that the productivity index is dependent
upon the appropriate utilization of the input variables.
Table 4:
DEA-Malmquist Index Summary of Company Means
Company effch techch pech sech tfpch
Woolworths 1.000 0.937 1.000 1.000 0.937
Coles 1.000 0.806 1.000 1.000 0.806
Mean 1.000 0.869 1.000 1.000 0.869
[Note that all Malmquist index averages are geometric means]
Based upon the total factor productivity value, the rank of each company can be determined
according to the largest value then in descending order, see Table 5. Table 5 provides an indication of
the extent to which the companies where optimally utilizing the input variables.
Table 5:
DEA-Malmquist Index Ranking of the Companies
Company tfpch value Rank
Woolworths 0.937 1
Coles 0.806 2
In effect the total factor productivity change (tfpch) of Woolworths (0.937 or 93.7%) is higher
than that of Coles (0.806 or 80.6%) and subsequently Woolworths ranks ahead of Coles.
VAIC™ Results
The financial statements and associated reports of two companies, referred to as Woolworths
Ltd and Coles Ltd were used for the calculations. For the purpose of contrast the return on assets
(ROA) was also calculated for each of the four years. This traditional ratio purports to show how
efficiently assets (in the normal terms of assets in the balance sheet) have been used to generate
income or profits. This is generally interpreted, on the basis that “the higher the ratio the more
efficient the use of assets” in effect greater efficiency is achieved by using less assets to derive higher
profits through greater sales. As raised by Kirkham (2012) the advent of the cash flow statement has
given rise to new ratios that can provide supplementary evidence for traditional ratios and
subsequently, the cash flow from operations return on assets (CFOROA) was developed to provide a
complimentary view of the ROA ratio results. In essence the CFOROA shows the efficiency with the
assets have been used to generate cash flows from operations.
Woolworths VAIC™ Results
The efficiency indicators for Woolworths Ltd are presented in Table 6 and deal with the four
years from 2016 to 2019. The key indicators for the analysis are the intellectual capital efficiency
(ICE) and the value added intellectual coefficient (VAIC™).
© JNBIT Vol.18, Iss.1 (2020) 7Van Kampen & Kirkham – Volume 18 Issue 1 (2020)
Table 6:
VAIC™ calculations for Woolworths Ltd
2016 2017 2018 2019
HCE 1.1317 1.1803 1.1956 1.2008
SCE 1.8837 1.8472 1.8364 1.8328
ICE 3.0153 3.0275 3.032 3.0336
CEE 4.044 2.9092 2.5181 2.8419
VAIC 7.0593 5.9368 5.5501 5.8755
ROA 5.12% ↑ 9.19% ↑ 10.34% 9.50%
CFOROA 12.26% ↑ 12.70% 12.93% 12.58%
↑ The arrows are used to emphasise a dramatic change in the values from one year to the next (i.e. whether there was
an increase ↑ or decrease )
The intellectual capital efficiency (ICE) shows a slight but steady growth over the four year
period. As expected there was a correlation between this and the human capital efficiency (HCE),
which had also steadily increased over the same time period. This suggests that a reliance on human
capital exists and that staff play a significant role, which would be consistent with the retail business.
In addition, in 2016 intellectual capital efficiency (ICE) created 3.0153 monetary units new
value for every one unit invested (i.e. a ratio of 3.0153 : 1) and by 2019 this had risen to 3.0336 (i.e. a
ratio of 3.0336 : 1). This is due to the value creator (i.e. the resources) being the denominator in this
ratio (Pulic, 2004). The result in 2019 is rather a small increase of 0.61% from the base year of 2016.
Interestingly, the capital employed efficiency (CEE) had a negative trend over the period, and in
terms of comparison it was 57.29% of the VAIC™ in 2016 and only 48.37% in 2019. The indication
being that the intellectual capital (ICE) was more responsible for the value being added to the
business.
Note that the value added intellectual coefficient (VAIC™) had gone through a number of
changes over the four year period. By contrast the intellectual capital efficiency (ICE), had
experienced small, but more importantly, incremental growth over the same period.
The return on assets (ROA) had a dramatic increase in the second year (2017) with a further
increase in 2018 this was followed by a reduction in 2019. This indicates that the company had used
the assets efficiently to generate income. The CFOROA followed a similar trend and in keeping with
the ROA this indicates that there was a positive efficient use of assets at least until the final year,
when there was a noticeable decrease. These trends are different in comparison with those of the ICE
which had slight but continued growth and VAIC™ which fluctuations in efficiency over the years.
Coles VAIC™ Results
The efficiency indicators for Coles Ltd are presented in Table 7 and deal with the four years
from 2016 to 2019. The key indicators for the analysis are the intellectual capital efficiency (ICE) and
the value added intellectual coefficient (VAIC™).
The intellectual capital efficiency (ICE) for Coles had steadily grown over the four year period.
However, the correlation between the human capital efficiency (HCE) and intellectual capital
efficiency (ICE) is not consistent in this set of results. This suggests that the reliance on human
capital whilst it may be important it is not a key element of the performance, at least not in this
company.
© JNBIT Vol.18, Iss.1 (2020) 8Van Kampen & Kirkham – Volume 18 Issue 1 (2020)
Table 7:
VAIC™ calculations for Coles Ltd
2016 2017 2018 2019
HCE 1.4313 1.4089 1.675 1.588
SCE 1.6987 1.7098 1.597 1.6297
ICE 3.13 3.1187 3.272 3.2177
CEE 1.2091 1.2525 ↑ 1.3858 ↑ 1.7475
VAIC 4.3391 4.3711 4.6578 4.9652
ROA 3.64% 3.52% ↑ 5.62% ↑ 12.77%
CFOROA 8.29% ↑ 10.45% ↑ 11.37% ↑ 26.41%
↑ The arrows are used to emphasise a dramatic change in the values from one year to the next (i.e. whether there was
an increase ↑ or decrease )
The result of the intellectual capital efficiency (ICE) in 2016 infers that the company created
3.13 monetary units new value for every one unit invested (i.e. a ratio of 3.13 : 1) which by 2019 had
risen to 3.2177 (i.e. a ratio of 3.2177 : 1). The trend over the period represents an increase of 2.1%
from the base year of 2016. Interestingly, the capital employed efficiency (CEE) had consistently
increased over each of the following years. It had gone from representing 27.87% of VAIC™ in 2016
to 35.9% in 2019. This a lower relationship than was found to have existed in Woolworths. The
interpretation in this scenario is that the intellectual capital (ICE) was not as responsible for the value
being added to the business.
The value added intellectual coefficient (VAIC™) had steadily grown over the four years. The
correlation of the intellectual capital efficiency (ICE), whilst it had a slight decline in 2017 and 2019 it
had a slight increase in 2018.
The return on assets (ROA) initially decreased in 2017 only to recover in subsequent years with
dramatic increases in 2018 and 2019. This indicates that the company had used the assets efficiently
to generate income. The cash flow from operations return on assets (CFOROA) over the four years
was consistently growing and especially in the final year where it soared to 26.41%.
Comparing the VAIC™ Ratios
In comparing these results against the findings of Kujansivu & Lonnqvist (2007) it is evident
that both Woolworths Ltd and Coles Ltd achieved levels of ICE or VAIC™ that were above their
equivalent industry standard. In view of the nature of both companies, which encompassed
predominantly retail – supermarkets and grocery stores, the most equivalent industry would be the
Wholesale and Retail industry which had an average VAIC™ in 2003 of 5.2 and the ICE of 2.5.
However, it should be noted that retail activities are not the total operations of either company and to
that extent the benchmark for the purpose of determining the overall performance is advisory only.
Discussion and Interpreting VAIC™ Ratios
Industry norms are widely held to be the most appropriate basis for making meaningful
interpretation of any ratio (Gibson 2009, 186). Prior research using the VAIC™ model has also
focused on producing industry standards which are then used as benchmarks against which
comparisons are made, see for example, Kujansivu and Lonnqvist (2007). However, the lack of an
industry standard does not preclude analysis nor the making of meaningful interpretations. Indeed
interpretations of ratios and trend analysis of financial data have traditionally relied upon very
simple and intuitive conventions which have been applied to interpret ratios derived from financial
reports. These general rules or standards are commonly found in the textbooks, which deal with the
calculation and analysis of financial ratios (Trottman & Gibbins 2009; Hoggett et al., 2009).
© JNBIT Vol.18, Iss.1 (2020) 9Van Kampen & Kirkham – Volume 18 Issue 1 (2020)
Discussion and Concluding remarks
This study highlights the different perspectives that emerge from the use of more than one
method of evaluating the performance efficiency of organisations. The two selected methods produce
similar outcomes however, the two financial ratios produce somewhat contrasting results in terms of
differentiating between the two companies, for the sake of simplification the summary of the results
is presented in Table 8. An interesting point to note is that whilst both the DEA and VAIC are derived
from financial data they are providing insights beyond the mere financial data.
Table 8:
Summary of Results
Method of
Evaluation First Place Second Place
DEA Woolworths Ltd Coles Ltd
VAIC Woolworths Ltd Coles Ltd
ROA Coles Ltd Woolworths Ltd
CFOROA Coles Ltd Woolworths Ltd
There are a number of limitations that come with a study that breaks ground by employing two
different methods of evaluation and more particularly is reliant upon the annual reports of
consolidated companies. Firstly, because the financial reports are for the consolidated operations of
the companies they encompass more than just mere supermarkets and grocery stores, however, since
diversification is a common strategic approach the consolidated figures reflect upon the strategic
management decisions are justifiable as indicators of performance efficiency from an overall
perspective. Secondly, there were instances where the figures for specific variables were not provided
as line items and had to be derived from a reconstruction, for example wages was not a line item in
the income statement and was combined with payments to suppliers in the cash flow statement
requiring a reconstruction of the accounts to derive an approximation of the wages expense.
References
Althin, R. (2001). Measurement of Productivity Changes: Two Malmquist Index Approaches. Journal of
Productivity Analysis, 16, 107–128.
Barros, C. P. (2006). Efficiency measurement among hypermarkets and supermarkets and the identification of
the efficiency drivers: A Case Study. International Journal of Retail & Distribution Management, 34(2/3),
135-154.
Berg, S,. Førsund, F. & Jansen, E. (1992). Malmquist Indices of Productivity Growth during the Deregulation of
Norwegian Banking, 1980–89. Scandinavian Journal of Economics, (Supplement), 211–228.
Charnes, A., Cooper, W. & Rhodes, E. (1978), Measuring the Efficiency of Decision Making Units, European
Journal of Operational Research, 2(6), 429-444.
Charnes, A., Cooper, W., Lewin, A. & Seiford, L. (1994), Data Envelopment Analysis: Theory, Methodology and
Applications, Kluwer Academic Publishers: Boston.
Chen, Y., Ali, A.I., (2004). DEA Malmquist productivity measure: new insights with an application to computer
industry. European Journal of Operational Research, 159, 239–249.
Coelli, T. (2019). DEAP Version 2.1 Software, Centre for Efficiency and Productivity Analysis (CEPA), School of
Economics, University of Queensland, https://economics.uq.edu.au/cepa/software
Coelli, T.J., (1996). A guide to DEAP Version 2.1. CEPA Working Paper 96/08. Centre for Efficiency and
Productivity Analysis, Department of Economics, University of New England, Australia, 1–50.
Farrell, M. (1957), The Measurement of Productive Efficiency, Journal of the Royal Statistical Society, Series A,
120(3), 253-290.
Firer, S. and Williams, S.M. (2003), Intellectual capital and traditional measures of corporate performance,
Journal of Intellectual Capital, Vol. 4 No. 3, pp. 348-360.
© JNBIT Vol.18, Iss.1 (2020) 10Van Kampen & Kirkham – Volume 18 Issue 1 (2020)
IBISWorld report (2020) Supermarkets and Grocery Stores in Australia G4111,
https://www.ibisworld.com/au/industry/supermarkets-grocery-stores/1834/ May 2020
Kämäräinen, V., Småros, J., Holmström, J., & Jaakola, T. (2001). Cost‐effectiveness in the e‐grocery business.
International Journal of Retail & Distribution Management. 29(1), 41-48.
Kirkham, R. (2012). Liquidity Analysis Using Cash Flow Ratios and Traditional Ratios: The Telecommunications
Sector in Australia, Journal of New Business Ideas & Trends, 10(1), 1-13.
Laing, G. K., Dunn, J. & Hughes-Lucas, S., (2010). Applying the VAIC™ model to Australian hotels, Journal of
Intellectual Capital, 11(3), 269-283.
Lueg, R., Nedergaard, L., & Svendgaard, S. (2013). The use of intellectual capital as a competitive tool: a Danish
case study. International Journal of Management, 30(2), 217-231.
Malmquist, S. (1953). Index Numbers and Indifference Surfaces. Trabajos de Estadistica, 4, 209–242
Norman, M & Stoker, B. (1991), Data Envelopment Analysis: The Assessment of Performance, John Wiley &
Sons Ltd: Chichester, UK.
Productivity Commission Report (2011) https://www.pc.gov.au/inquiries/completed/retail-industry/report
Pulic, A. (1998), “Measuring the performance of intellectual potential in knowledge economy”, paper presented
at the 2nd World Congress on Measuring and Managing Intellectual Capital, McMaster University,
Hamilton.
Pulic, A. (2000), “VAIC™ – an accounting tool for IC management”, International Journal of Technology
Management, Vol. 20 Nos 5-8, pp. 702-714.
Pulic, A. (2004), Intellectual capital – does it create or destroy value?, Measuring Business Excellence, Vol. 8 No.
1, pp. 62-68.
Schneider, U. (1998), The Austrian approach to the measurement of intellectual potential, available at:
http://users.austro.net/measuring-ip/OPapers/Schneider/Canada/ theoreticalframework.html
Sellers‐Rubio, R., & Mas‐Ruiz, F. (2006). Economic efficiency in supermarkets: evidences in Spain.
International Journal of Retail & Distribution Management. 34(2/3), 155-171.
Tanskanen, K., Yrjölä, H., & Holmström, J. (2002). The way to profitable internet grocery retailing–six lessons
learned. International Journal of Retail & Distribution Management. 30(4), 169-178.
Vaz, C. B., Camanho, A. S., & Guimarães, R. C. (2010). The assessment of retailing efficiency using network data
envelopment analysis. Annals of Operations Research, 173(1), 5-24.
Watson, A., Stanworth, J., Healeas, S., Purdy, D., & Stanworth, C. (2005). Retail franchising: an intellectual
capital perspective. Journal of Retailing and Consumer Services, 12(1), 25-34.
Williams, S.M. (2001), Is intellectual capital performance and disclosure practices related?, Journal of
Intellectual Capital, 2(3), 192-203.
Zhu, J. (2000), Multi-factor performance measure model with an application to Fortune 500 companies,
European Journal of Operational Research, 123, 105-124.
© JNBIT Vol.18, Iss.1 (2020) 11Reproduced with permission of copyright owner. Further reproduction
prohibited without permission.You can also read