Asset Mapping in North Beach
←
→
Page content transcription
If your browser does not render page correctly, please read the page content below
Note: This report is a non-funded student project from spring
semester 2011 Urban Studies Senior Seminar class. Information
contained herein does not reflect formal research results nor has it
been reviewed.

     Asset Mapping in North Beach

                                                                       Annyse Acevedo, Justin Giarritta,
                                                                       Nikolara Jansons and Tan Le

                                                                       May 23, 2011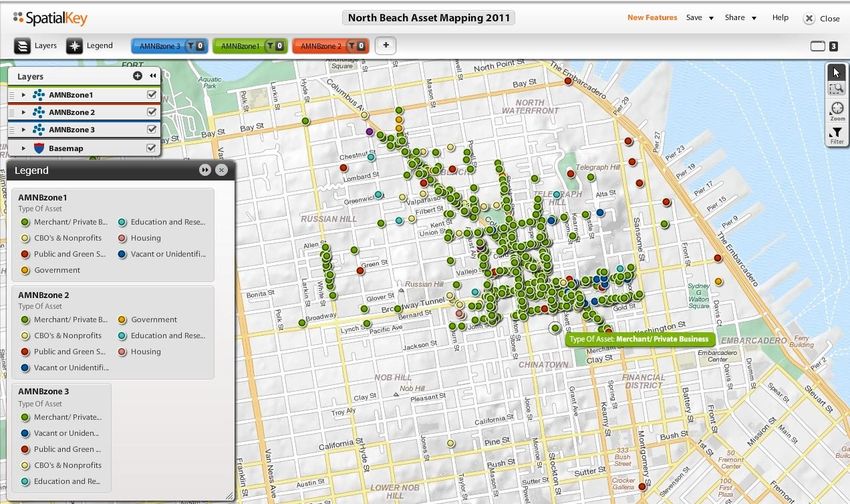
Natural disasters, such as Hurricane Katrina, have pushed many cities

throughout the country to reevaluate the importance of emergency planning and

community input after disasters occur. But, more importantly, cities have realized the

importance of preparing themselves, on the local level, before any disaster takes

place. In San Francisco, there are several city agencies that come together to create

the emergency preparedness plan, whether it is the Department of Emergency

Management, General Services Agency, or the Human Services Agency--whose main

goal is the welfare of our most vulnerable citizens. However, sustainability at the

community level has not become the goal for just one specific city agency. This

however has spurred a partnership of community groups and government agencies to

create a program, the Neighborhood Empowerment Network, to tackle this goal.

      The Neighborhood Empowerment Network grew out of a city hall initiated

dialogue with community members in 2006 that focused on ways the city government

could better partner in meeting the community‟s needs. Issues that were discussed

during this dialogue were: “Make the programming and services we need easier to

find.” “Invest in building our capacity to participate in the stewardship of our

community.” “Develop technical resources that we can easily leverage to achieve our

goals.” “Coordinate your delivery of services and programs more effectively at the

community level.” And, “Ask us what we want and then start „the work.‟”

      This network is not a city agency but a program managed by the General

Services Agency. It is built of residents and a variety of community organizations,

including San Francisco State University‟s Institute for Civic Engagement. Their vision

                                                                                          2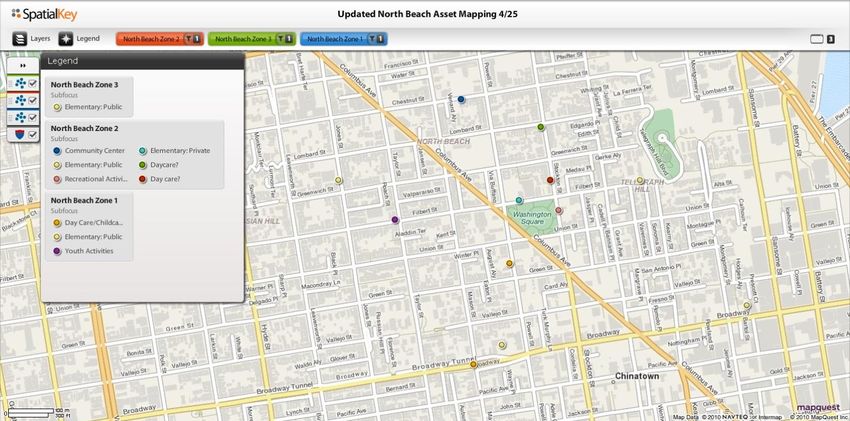
is “every resident has the right to live in a safe, clean, healthy, inclusive and

economically resilient community.”

       The concept of resiliency can be defined in a disaster context as “the ability to

survive future natural disasters with minimum loss of life and property, as well as the

ability to create a greater sense of place among residents; a stronger, more diverse

economy; and a more economically integrated and diverse population” (Vale &

Campanella, 2005).

       Hurricane Katrina opened a window of opportunity for creating more resilient

communities throughout the world. The more organized a community is with high

levels of social capital, the better the chances of recovery from a major disaster,

man-made or natural. And, in San Francisco, emergency planning and preparedness is

a way of life. But, this is only one way of getting a neighborhood to become more

resilient.

       In 2009, the Neighborhood Empowerment Network and San Francisco State‟s

ICCE launched a new partnership, NEN University (NENu). This alliance of academic

and governmental organizations mission is to partner and coordinate with

neighborhood stakeholders in order to better deploy their collective assets to improve

the lives of San Franciscans. This partnership would also help address the critical

issues defined by residents living in the San Francisco neighborhoods.

       NENu‟s mission is to develop socially responsible citizens who will have positive

impacts in their communities by creating partnerships between San Francisco State

faculty, staff, and students and community partners. NENu has worked within

                                                                                          3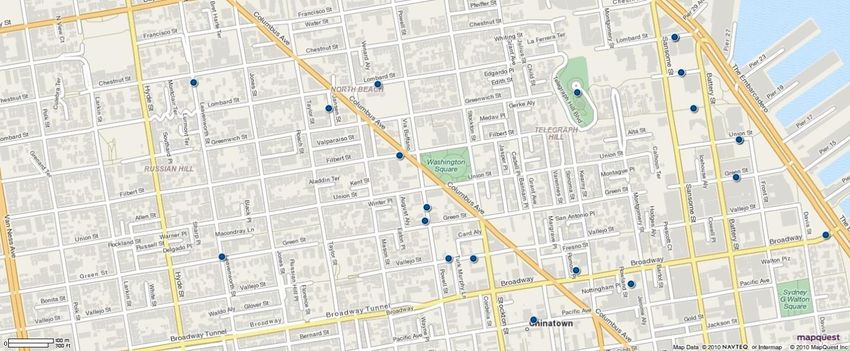
different communities in San Francisco to assess the resources available to the area.

In more recent years, the neighborhood of North Beach has become the study area.

      It is important to have a basic understanding of the history of North Beach and

to understand why it has certain resources and lacks others. Out of all of the districts

in San Francisco, North Beach is one of the oldest, as it was established in the 1800s.

The name “North Beach” came from its location on the northeastern tip of the San

Francisco peninsula where it was built on landfill.

      The area is known as “Little Italia,” as Italian settlers came to San Francisco as

part of the Gold Rush frenzy after the 1840s. North Beach is bordered by Russian Hill

to the northwest, Chinatown and the Financial District to the south and the “Barbary

Coast” or the red light district to the east. The neighborhood is rich in culture,

traditional Italian cuisine and has many historical landmarks.

      North Beach served as a gateway for immigrants and settlers from South

America, Europe and the Australian penal colonies. It was not until the late 1800s that

North Beach became the center for Italian families. Families lived on top of their

shops and near their fishing boats or produce stalls. In 1900, there were 7,508

foreign-born Italians in San Francisco; the majority of them lived in North Beach

(Scherini, pp. 19). Notable residents from the North Beach neighborhood include: Joe

DiMaggio, Amadeo Peter Giannini (Founder of the Bank of Italy; now known as the

Bank of America) and the beat writers Jack Kerouac, Allen Ginsberg and Lucien Carr.

      The rich history and historical landmarks of the neighborhood provide many

reasons for tourists to explore the area. Some historical landmarks include

Washington Square Park, which is located in the heart of North Beach. Across the
                                                                                           4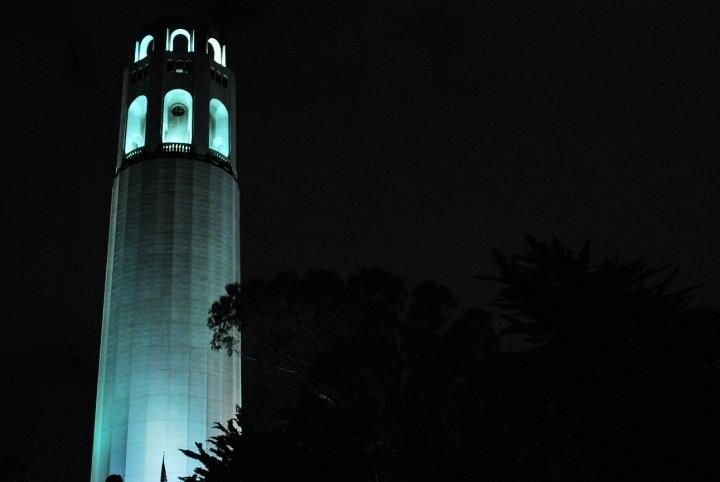
street on Filbert Street is the Church of Saints Paul and Peter, also known as “The

Italian Cathedral of the West.”

         Early signs of North Beach‟s resiliency were seen after the 1906 earthquake:

Giannini set up a makeshift desk and offered loans solely on “a face and name” the

day after the earthquake hit. He did not believe adhering to the six-month bank

moratorium would have been beneficial to North Beach or to San Francisco, stating

“there will be no city or people left to serve” (Bonamici, 2005).

         From the 1940s, the Italian population dispersed and spread throughout the

city. The Chinese population began to spill over into North Beach from Chinatown,

which leads into our approach for our project. Even though this is one of the most

popular tourist attractions within the city, it is still a functioning neighborhood where

people live, work and raise families. The neighborhood is more than just Columbus

Street and Broadway and with the use of asset mapping, we will help residents

discover the services provided throughout the entire area of North Beach.

         According to the US Census in 2000, most residents in the neighborhood were

18 years and over, but less than 65 years of age. Only 2.9% of the population in North

Beach‟s zip code area, 94133, was under the age of five. The Asian population was

the highest for the neighborhood, at 55.3%, while Whites were second highest, at

39.6%.

         Under the guidelines and strategies of NEN‟s vision statement and mission, “to

empower residents with the capacity and resources to build strong resilient

communities,” our project, in collaboration with ICCE, through NENu, is to analyze

the community of North Beach to determine the resilience capacity of the
                                                                                          5
neighborhood. We helped to locate essential businesses and services throughout the
North Beach neighborhood which will help residents become more community
oriented. The goal is to help residents have an idea of where they would be able to
turn after a natural or man-made disaster.
In addition, the purpose is to create more of a community-based neighborhood
by locating businesses that residents may not have known about or aware of in the
area. The more knowledge of businesses and services residents may have at their
disposal, the better the chance they will spend their money and reinvest back into
their neighborhood.
Aside from locating essential businesses and services in order to create a
snapshot of North Beach, we will also took on the task of identifying issues that are
presently impeding the development of overall community growth. We did this by
identifying and addressing red-zone issues brought to light by the North Beach
Resiliency Steering Committee which is made up of neighborhood leaders, residents,
and merchants, non-profit and faith-based representatives. Red-zone issues identified
by the steering committee were: Land Use, Social Capital, Public Safety, Family
Services, Government, and Human Services.
One of the land use concerns are cellular phone antennas - their visual
appearance and change to the skyline. There is also apprehension about the proposed
Pot Club in Aquatic Park and the potential effects on the community. Graffiti
abatement and determent should also be addressed. Social capital issues are lack of
connectivity amongst community members and organizations. There is a desire to tap
into local mental health professionals‟ knowledge and experience to address
6homelessness, mental health and substance abuse by individuals. Residents would like
to better access community resources, safety and encourage civility.
There is also distress over the closure of Clubhouse and Joe DiMaggio Park, a
beloved community resource. The neighborhood is also concerned with the lack of
housing, eviction and the threat of suburbanization. Finally public transportation and
disaster preparedness should also be addressed in North Beach.
In order to help the residents discover the services provided, NEN and the ICCE
have developed a detailed approach to figure this out. The goal is to map the assets
of the entire neighborhood, distinguish the resources that thrive in the community
and identify the areas in which improved resources are needed. The asset mapping
undertaken for our clients is a detailed, itemized list of the resources for the North
Beach neighborhood. This fieldwork was done in the context of the North Beach
Resiliency Initiative‟s “Red Zone Issues.”
Asset mapping is being introduced as an important tool in finding crucial
services in neighborhoods and other social settings. Griffin and Farris defined asset
mapping as a drawing of a map of what is valuable in communities (Dorfman, 1998)
and the fundamental component to mapping would be compiling a list of existing
resources that can be used by all stakeholders.
The goal is to walk each neighborhood block and write a detailed explanation
of each business located there. Schools, bars, medical offices, dry cleaners, delis and
vacant lots are all examples of different types of assets we mapped. We did not focus
on residential buildings for this project. We detailed our findings by address, cross
street, focus and sub-focus. The more information we could obtain from a business,
7the better our end result will be to truly explain what North Beach offers and also
lacks.
Once the asset mapping portion of this project was completed, the data was
entered into a software database, SpatialKey that is similar to ArcGIS. According to
Mike Connor, Vice President of Product Management, the idea is to look for ways to
bring the City and County of San Francisco out of the dark ages of information
analysis. SpatialKey has been utilized by non-profits around the world to help analyze
and map information quickly. Invisible Children, a non-profit working in Uganda,
utilizes SpatialKey to help answer the question of “How do we reduce and fix the
impact of pulling children into war in the Sudan?”
ACLED Mapping uses SpatialKey to bring together complex information,
knowledge and insight to people on the ground in conflicted areas of Africa. With
SpatialKey, information can be entered and viewed quickly with a minimum
knowledge of the program. Research has been done on both asset mapping and the
importance of neighborhood resilience. One research study states asset mapping gives
a different perspective on what is commonly known about an area and its physical and
socio-economical characteristics (Outreach Partnerships, 1999). Erenstein et al.‟s
research in regards to poverty states asset mapping indicates where and on what
development initiatives should focus on. The benefits to asset mapping seem to be
plentiful. However, asset mapping can be seen as only a tool, not an end product.
Erenstein et al. described a limitation of asset mapping as the difference between
explanatory and interpretational approaches. For our purposes, this can be the
8difference between a “novelty & gifts” sub-focus and a “clothing & accessories” sub-
focus.
Asset mapping is commonly used in the mental and public health areas, but it is
slowly being adopted as a tool for community and public services. It has been used in
tracking poverty, natural capital and ecosystem services and even helped high school
counselors in finding outside neighborhood resources for their students. In Lexington,
Kentucky, community members conducted community asset mapping to help connect
children with disabilities to resources. This project will use asset mapping to help
strengthen the resiliency in the North Beach neighborhood.
The response and help (and lack thereof) the local and federal governments
gave to victims of Hurricane Katrina allowed communities across the country to start
becoming more resilient:
The urgency of residents to get back to their homes coupled with pressure by
business owners to return to normalcy builds quickly after a disaster and is
amplified by a substantial inflow of capital for reconstruction...furthermore, by
involving and consulting residents in all phases of planning, the pre-disaster
recovery planning process helps create a knowledgeable constituency that is
more likely to support redevelopment policies and programs that take effect
once a disaster strikes (Berke & Campanella, 2006).
Our research will find that asset mapping is an important tool to locating and
identifying key resources in the neighborhood. And, by asset mapping, we will show
that creating a strong resiliency plan for North Beach will benefit the residents in the
long run as well as in the present.
9The Urban Studies and Planning program has taught each group member how to
take an analytical approach to this project. Researching and field work have paved
the way for this project to be tackled. We have learned that in order to get good and
accurate results, we need to get good data. This idea has been key to gathering and
inputting data. According to Mike Connor the better the address data we can record,
the better the data will be in creating maps in SpatialKey. Through the USP program,
we have also learned about professional mannerisms and proper attire when meeting
with clients, how to communicate effectively with one‟s supervisor and gained
familiarity with professional meetings.
The purpose of this project is to help the North Beach community develop
connections with their neighbors and business owners. The data that is gathered will
not only show what North Beach offers and lacks, but also will address key “Red Zone
Areas” that have proven to be hot topics in the neighborhood. Through asset mapping,
our goal is to encourage resiliency in order to survive future natural and man-made
disasters and preserve the neighborhood for future generations. And, through
SpatialKey, our goal is to give a visual image to what we have learned through asset
mapping.
The importance of creating neighborhood resiliency stretches beyond just
emergency preparedness. By reacquainting oneself with their neighborhood, they not
only reinvest into their community, but build a stronger relationship with all parties
involved.
10Methodology
For our project, our North Beach boundaries were delineated by our client,
NEN, and differed slightly from the census boundaries. We conducted research for the
background report which includes history, definitions, problem issues and
methodologies. Red zone issues, data collection and entry as well as asset mapping
and SpatialKey were also included.
For our data collection, we used Google maps to delineate streets within three
zones of North Beach. As we asset mapped each street we used Google maps at the
end of the day to mark which ones we had visited and to identify to the rest of the
group, which ones still needed to be mapped. This helped aid communication and
keep track of the dates the streets were mapped. We were given blank gridded sheets
to record the data on as well as an asset list to categorize the different locations. The
asset types were broken down into categories such as Government or
Merchant/Private Business, then a Focus such as Faith Based or Food and Beverage.
And finally a Sub-focus, further breaking it down into categories such as Market:
Grocer or Pub/Bar.
Once all the data was entered into Excel and corrected for spelling and
categorical errors, we uploaded it to SpatialKey which visualized the information. We
spent some time examining the layers of data and comparing them to the Red Zone
Issues, trying to parse some knowledge out of the visual information. Highlighting
Focuses and Sub-focuses, we were able to glean some insight into the North Beach
community and its many assets.
11Figure 1
Introduction: SpatialKey
Asset mapping is a process to physically show where certain assets are located.
To do so, we collaborated with a location-based program called SpatialKey.
SpatialKey is a web-based program developed by Universal Mind, a digital solutions
agency that develops rich internet applications. SpatialKey is the next generation
location intelligence solution that enables interactive analysis and reports to be
created and shared by business decision makers in minutes. The program was
developed recently in 2008, providing a new and easy way to create your own
12customized maps with any data. The program allows excel, Geographic Information
System (GIS) and CSV files to be imported for a visual location and interactions within
the desired location. Unlike GIS, SpatialKey is a quick, self-taught program that can
easily be implemented in a few hours. You do not need to be specialists as it is a web-
based program, ready to be utilized at home or workplace once subscribed.
What SpatialKey allows you to do is to customize your own map. SpatialKey has
worked with many organizations such as Invisible Children and the Armed Conflict
Location and Event Data (ACLED). For example, Invisible Children used SpatialKey to
measure and locate the force of child soldiers in Central Africa. SpatialKey can be for
business owners, political statistics, and organizations that are trying to use visual
data to make critical decisions. ACLED used SpatialKey in a similar mission to analyze
locations of armed conflicts and to investigate the relationship between conflict and
refugee camps in Central Africa. These are just two case studies that show that
SpatialKey is a diverse program that any data can be evaluated to make key decisions.
In our case, we used SpatialKey to locate assets in North Beach. After
physically collecting data into excel spreadsheets, we were able to transfer our excel
datasheets into SpatialKey, which collaborates with Google Maps to locate our assets.
Figure 1 provides a visual of the SpatialKey program and what it is able to provide.
After evaluating our data, here are a few findings and recommendations for North
Beach involving vacant store fronts, lack of public and green spaces and child
services.
13Vacant Store Fronts
Figure 2
When analyzing our data, we noticed a lot of vacant buildings and units. We
wondered why this must be. Some store fronts use to be retail, restaurants, and other
services, but we assume that it ran out of business during our current reccession.
Currently, there are 25 vacant lots. In order to make use and utilize these vacant
units, we reccommended that some of the vacant lots to be used for future
community centers or centers for child services. In case of an emergency, some of
these locations can be utilized as meeting centers for organizations and/or neighbors.
Not only should these lots be used for the community, it also provides the opportunity
for new local businesses. Although the reccession is taking its toll on most business
owners already, North Beach is an option for new business owners in San Francisco.
14Public and Green Spaces
Figure 3
Public and green spaces are vital in a neighborhood for families and children.
We noticed that North Beach is lacking in this department. Currently, there are seven
parks in Washington Square, Joe DiMaggio Park, Faye Park, Michelangelo Park, Ina
Coolbrith Park, Chestnut and Kearny Open Space, and Pioneer Park. Although there
may be seven parks, only two out of the seven has playgrounds in Michelangelo Park
and Joe DiMaggio Park. North Beach may not necessarily lack in green spaces, but lack
playgrounds for families and children to play.
An issue currently occurring with public and green spaces is the future closure
of Joe DiMaggio Park. The San Francisco Public Library System currently proposed a
plan to expand its current branch in North Beach on Joe DiMaggio Park‟s parcel. This
doesn‟t only eliminate a park in the neighborhood, but a community service as it
provides playgrounds, blacktop, and a community pool. If the proposal is
15implemented, it will eliminate one of the two playgrounds that currently exist in the
neighborhood besides the elementary school‟s yard.
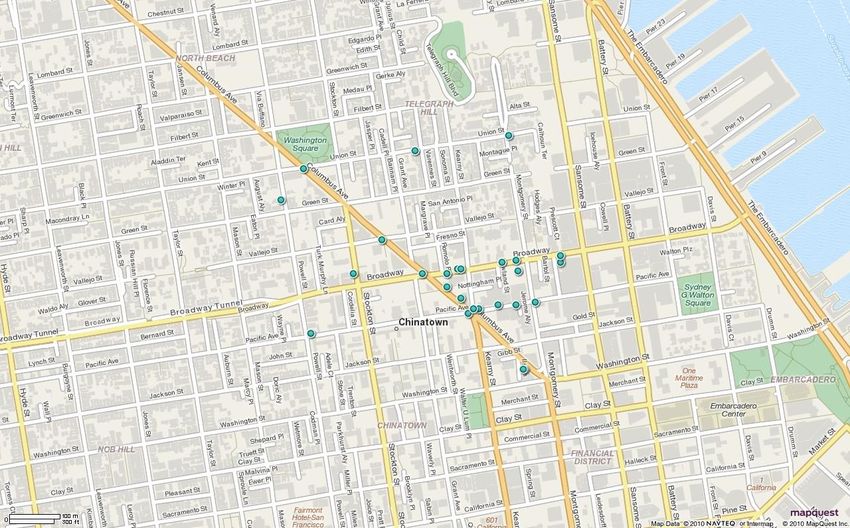
In Figure 3, the blue dots on this map locate all of the public and green spaces
which include parks, historical landmarks, and neighborhood stairs that lead to other
blocks uphill. Historical landmarks include the Coit Tower and Lombard Street, the
world‟s crookedest street. Although North Beach provides rich history and landmarks
in its neighborhood, the children have little to no after-school activities and parks
provided for their care
Children’s Services
Figure 4
As the neighborhood is already lacking in playgrounds for children in the
community, the neighborhood is also lacking in after-school programs and day cares.
Figure 4 displays all child services including elementary schools, day cares, and after-
16school programs available. There are currently five elementary schools, four day
cares, and three after-school programs such as the community center. For a
neighborhood that has a population of 2,500 and 10-15% is children, we expected
more to be done to provide for the future generation. North Beach may not be the
typical neighborhood to raise a family, but there are children in the neighborhood and
services such as after-school programs like Destination Art on 900 Filbert needs to be
provided.
The main purpose of illustrating our data through Spatial Key was to show
where certain assets are located within the community. Our Spatial Key maps each
show the different types of assets as a dot, and this helps to establish where residents
can go in order to utilize each asset. By looking at these maps, one can gain a true
understanding of the community, and can identify where certain assets are located,
but more importantly, being able to have these maps shows the weaknesses and holes
within an entire city, or in our case, the district of North Beach. Considering that our
main goal was to establish resiliency within the community, we wanted to use our
data, and our results from Spatial Key, to establish whether or not North Beach was
prepared in the case of an emergency.
By looking at our data, it is evident that commercial development has taken
over the heart of North Beach. The most prosperous types of development throughout
the area are Merchants and Private Businesses, as various forms of retail, food and
beverage establishments, entertainment venues, and other various services. Tourists
from all over the world come to North Beach to utilize these assets, especially those
17related to fine Italian cuisine, and the bars and clubs along Broadway. But our
assignment was not to investigate the obvious assets in which North Beach is known
for, but to explore the assets in which North Beach lacks, and the issues that are
constantly troubling the areas.
This is why we took a closer look at the red zone issues provided to us by NEN.
As previously stated, these are issues that The North Beach Resiliency Steering
Committee developed, as they attempted to find solutions to major challenges in the
North Beach Neighborhood. There is a long list of issues, but while asset mapping, we
limited our search to five major problems. One of the major issues we examined was
the placement of cell phone antennas, as we noticed several public notices regarding
the construction of these towers as we collected our data while asset mapping. There
is strong opposition for the development of these towers, not only because of their
non-flattering appearance and the change they would give to the skyline, but also
because of the fact that they want this development to occur within North Beach, an
area already affected by overcrowding and heavy density. The development of a
marijuana dispensary in Aquatic Park is another major concern for the community. Of
course any discussion regarding medical marijuana would cause a stir, but the fact
that they want to locate this dispensary in such an affluent part of San Francisco
would cause land value to decrease, and could bring about unnecessary crime.
Another issue regarding North Beach is the fact that they lack adequate green spaces,
but more specifically, the desire to close Joe DiMaggio Park. This is one of the more
popular green spaces located within North Beach, as it is very close to the major
18intersection of Lombard Street and Columbus Avenue. Because there is heavy tourist
traffic along both of these streets, many people will take the time to enjoy some time
at Joe DiMaggio Park. But the San Francisco Public Library System is currently fighting
to build its new library at the current premises of the park, which would completely
demolish the current green space and the popular playground. Relocating the current
library, located within two blocks of the new projected site, is counter-productive in
North Beach‟s desire to preserve green space, in order to have places for children to
play. We noticed also that children are not very well addressed in North Beach.
Besides the few schools we located throughout asset mapping, we were unable to
locate childcare providers in the neighborhood. Unless each household has their own
private maid or butler, this is a huge problem, as parents would have to exit North
Beach in order to have a place for their children to stay while they went to work.
Lastly, we do not feel that the homeless are properly served in the community. There
were no homeless services, and this means that the homeless of North Beach must
survive on the streets, even when they are hungry and the weather is unfavorable.
These are red zone issues that we felt were the most important for the community of
North Beach, and should properly be addressed and analyzed in order to form official
solutions.
Aside from the issues NEN wanted us to examine, we took initiative and
examined other problems that North Beach faces. After taking a deep look at our
maps, it became evident that North Beach lacks decent emergency service coverage.
Besides one centralized police station and only a few single truck firehouses, there is
19not enough coverage for North Beach to depend on in any case of an emergency. If
North Beach was needed to respond in any case of an emergency, we feel that they
would need to rely on other surrounding districts to help with the efforts. If the
disaster were to only affect North Beach, surrounding neighborhood services would be
able to help with the efforts, but the disasters in which North Beach needs to be
concerned about are far larger. San Francisco is located right on top of the San
Andreas Fault, the most active fault line in California, and our efforts to asset map
North Beach is in some sort, an attempt to prepare the neighborhood in case of a high
magnitude earthquake or a tsunami off the bay. If North Beach is going to be a
resilient neighborhood in the case of any disaster, it is important for the people to
have knowledge of the services they are provided, and the understanding that there is
actually adequate help in the area.
Having proper help is important, but just as important are the shelters that
would serve evacuees during an emergency. We developed a map on Spatial Key to
show where residents may go, and although we felt there were enough locations to
serve the number of people, we wanted to take it another step further and address if
these sites were truly adequate. In this map, we focused in on all public and private
schools, churches, and any form of lodging. These may be large places for people to
go, but what might happen to those injured during the disaster? Our research showed
that there was no major medical center or hospital in North Beach, and if there is no
proper medical equipment for those in critical condition, then North Beach should
have huge concerns in the case of a disaster.
20Along with a lack of emergency services in the area, the transportation issue is
also a major conflict. Although asset mapping and Spatial Key cannot illustrate the
transportation problems in the, it was an evident problem that we discovered simply
by walking on the streets of North Beach. This is an area that is extremely dense, and
one of the most populated areas within San Francisco without the metro line present.
Therefore, buses get overcrowded, and sidewalks remained packed. Although the new
Central Subway Line is supposed to make its way to North Beach in the near future,
the congestion needs in the area needs to be currently addressed, as MUNI should look
to add more buses to the already overflowing 30 and 45 bus lines that currently serve
Stockton Street through North Beach. Along with the inadequate public
transportation, North Beach is not even in the least friendly towards private
automobiles, as the roads are not large enough to serve motor vehicles. Not to
mention, the lack of both paid and unpaid parking is a problem that North Beach
faces. The fact that parking is hard to find in North Beach allows for more cars to be
on the road, and is not only negative because of carbon-dioxide emissions, but also
because streets would be packed in the case of an emergency. Inadequate and
overcrowded transportation causes chaotic commutes everyday through North Beach,
and if a disaster struck, and residents needed to evacuate North Beach, it is very
unlikely the current bus system would be ready to do the public that service.
Ultimately, residents of North Beach should know where to turn to in any case,
but more definitely in the case of an emergency. They should also be active with
community politics. Although we saw notices taped to street poles about the cell
21phone tower, and heard from NEN about the development of pot clubs and the closure
of Joe DiMaggio Park, it did not seem like the public was all that aware of the
problems. The people deserve to know this too, and this information needs to be
properly provided to the community. In the case of an emergency, residents need to
know where to turn to, and they need to know where they cannot turn to. When
people come together, they can achieve great things. And if the people of North
Beach came together in support of their own safety, maybe they can get the better
coverage that they deserve, or a possible hospital / medical complex, and maybe
even have a larger say in the results of these red zone issues. Having this information
in direct contact of the North Beach residents really digs deep down into resiliency at
its heart, and is the ultimate goal of our research.
Although many regard North Beach as a prosperous community that provides
entertainment to people from all around the world, it is still a neighborhood that
faces several uphill battles just like any other community. Just like any city in the Bay
Area, and just like any district in San Francisco, there are always going to be issues at
hand that could jeopardize that certain area or cause unrest. But asset mapping has
helped us learn ways in which we could better North Beach, and how we could
provide answers to the current red zone issues, and other problems in general. People
need to understand that North Beach is a community that like all others, are trying to
be resilient and improve upon itself for the best of times, and the worst of times. But
until the data is collected and analyzed, it may be hard to fully understand their
potential.
22North Beach still needs the proper attention and citizen action to tackle its
own problems, and we hope that our asset mapping and work with Spatial Key will
allow the residents to have an illustrated idea of how they can be a part of the
change. Understanding North Beach as a resilient community has helped our study and
our collection of data could help the community, itself, recognizes its own resiliency.
23References
Banner, C. & Jopling, J. San Francisco: North Beach. 2011. SFGate.com. Retrieved 17
March. 2011.
Erenstein, O. , Hellin, J. , & Chandna, P. (2010). Poverty mapping based on livelihood
assets: A meso-level application in the indo-gangetic plains, India. Applied Geography,
30(1), 112-125.
Griffin, D., & Farris, A. (2010). School Counselors and Collaboration: Finding
Resources through Community Asset Mapping. Professional School Counseling, 13(5),
248-256. Retrieved from EBSCOhost.
Neighborhood Empowerment Network. (2011). Projects. Retrieved 18 March 2011.
< http://www.empowersf.org/projectss/ >.
Outreach Partnerships. Michican State University. No. 3, 1998-1999. Best Practices
Briefs. Putting the Pieces Together. http://www.empowersf.org/storage/documents-
to-download/polk-corridor-resiliency-project/CommunityMapping1.pdf
Scherini, Rose. The Italian American Community of San Francisco: A Descriptive Study.
Arno Press Inc. 1980.
US Census Bureau. 94133 Fact Sheet. American Fact Finder.
http://factfinder.census.gov/servlet/SAFFFacts?_event=&geo_id=86000US94133&_geo
Context=01000US%7C86000US94133&_street=&_county=&_cityTown=&_state=&_zip=9
4133&_lang=en&_sse=on&ActiveGeoDiv=&_useEV=&pctxt=fph&pgsl=860&_submenuId=
factsheet_1&ds_name=null&_ci_nbr=null&qr_name=null®=null%3Anull&_keyword=
&_industry=&show_2003_tab=&redirect=Y Retrieved 19 May 2011.
24You can also read