Astro2020 Science White Paper Potential for Solar System Science with the ngVLA: the Giant Planets
←
→
Page content transcription
If your browser does not render page correctly, please read the page content below
Astro2020 Science White Paper
Potential for Solar System Science with the
ngVLA: the Giant Planets
Thematic Areas:               3 Planetary Systems  Star and Planet Formation
 Formation and Evolution of Compact Objects          Cosmology and Fundamental Physics
 Stars and Stellar Evolution  Resolved Stellar Populations and their Environments
 Galaxy Evolution             Multi-Messenger Astronomy and Astrophysics

Principal Author:
Name: Imke de Pater
Institution: University of California, Berkeley
Email: imke@berkeley.edu
Phone: 510-642-5275

Co-authors:
Bryan Butler - National Radio Astronomy Observatory
R. J. Sault - University of Melbourne
Arielle Moullet - SOFIA
Chris Moeckel - University of California, Berkeley
Joshua Tollefson - University of California, Berkeley
Katherine de Kleer - California Institute of Technology
Mark A. Gurwell - Harvard-Smithsonian Center for Astrophysics
Srefanie Milam - NASA Goddard Space Flight Center

Abstract: Radio wavelength observations of solar system bodies are a powerful method of
probing the deep atmospheres of the giant planets, its rings, and magnetospheres. The ngVLA
will enable the highest sensitivity and resolution observations of this kind, with the potential to
revolutionize our understanding of these bodies.

                                                  1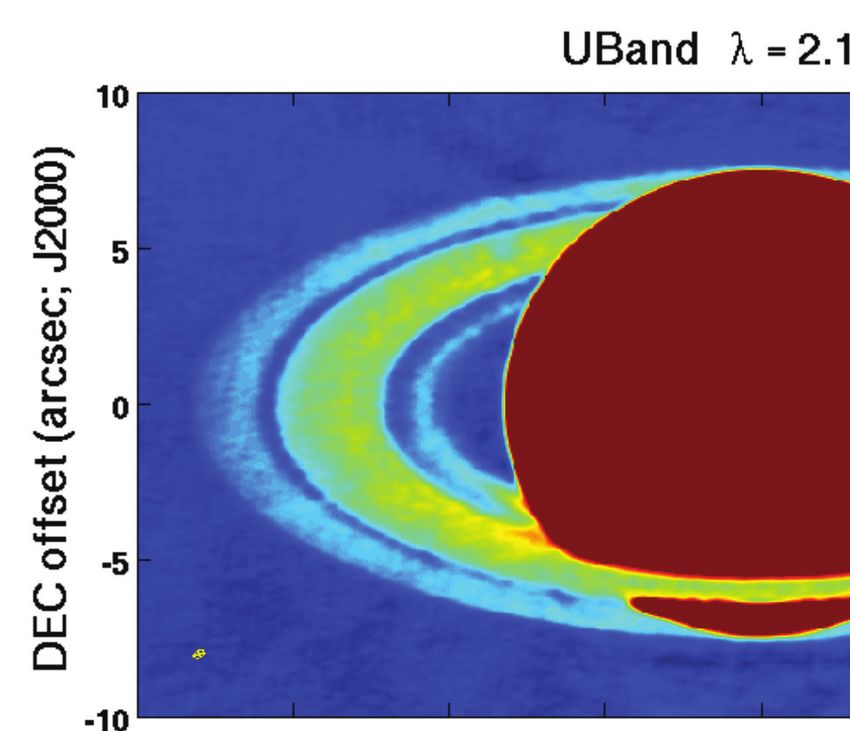
1 Introduction
Composition of a body is a key parameter for planetary formation models. Observations at radio
wavelengths provide unique information as they probe regions inaccessible by nearly all other
remote sensing techniques and wavelengths. For example, at radio wavelengths one can probe
depths up to many tens of bars in atmospheres of the giant planets, and their magnetic fields can
be probed through emissions by electrons in such fields. In order to extract the most information,
high spatial and high spectral resolution is essential, as well as sensitivity to large scale structure.
Since the atmospheres of our giant planets are highly time variable (rotation of the body itself,
winds, storms) excellent sensitivity and imaging characteristics on short timescales (minutes or
less) is highly desirable. These are attributes being planned for the ngVLA.
Observations of the giant planets in the frequency range of the ngVLA (1–116 GHz) are sensitive
to both thermal and non-thermal emissions. These emissions are received simultaneously, and can
be distinguished from each other by examination of their different spatial, polarization, time (e.g.,
for lightning), and spectral characteristics. Given the sensitivity and resolution of the ngVLA,
detailed maps of both of these types of emissions will be possible. Below we highlight recent
VLA results on Jupiter, and discuss how these will be improved with the ngVLA. We refer to
reader for more details to the review ”Potential for Solar System Science with the ngVLA” by de
Pater et al. (2018).
2 Giant Planet Deep Atmospheres
Understanding the coupling of gas abundances, temperature, and dynamics of the deep
atmospheres of the giant planets is vital to our understanding of these planets as a whole, and to
our understanding of extrasolar giant planets.
The atmospheres of the giant planets all emit thermal (blackbody) radiation. At radio wavelengths
sources of opacity are collision induced absorption (CIA) by hydrogen, and absorption by NH3 ,
H2 S, PH3 , and H2 O gases (opacity by clouds can probably be ignored; de Pater et al., 2019). For
near-solar composition atmospheres most of the atmospheric opacity has been attributed to
ammonia gas, which has a broad absorption band near 22 GHz. Indeed, for Jupiter and Saturn
NH3 gas indeed dominates, but not for Uranus and Neptune. The S/N ratio on these planets
appears to be considerably enhanced above the solar value, and spectra can be modeled well by
including opacity from H2 S gas, and selectively increase the H2 S abundance considerably (factors
of ∼ 10 and 30 for Uranus and Neptune, resp.) (e.g., de Pater& Mitchell, 1993, and references
therein).
The thermal emission from all four giant planets has been imaged with the VLA. To construct
high signal-to-noise images, one needs to be integrated over several hours, resulting in maps that
are smeared in longitude and only reveal brightness variations in latitude. In order to discern
longitudinal structures on radio maps, such as the Great Red Spot (GRS) on Jupiter, Sault et al.
(2004) developed an algorithm to essentially take out a planet’s rotation. This algorithm has
recently been applied to data of all planets obtained with the VLA after its upgrade. Below we
highlight results on Jupiter.
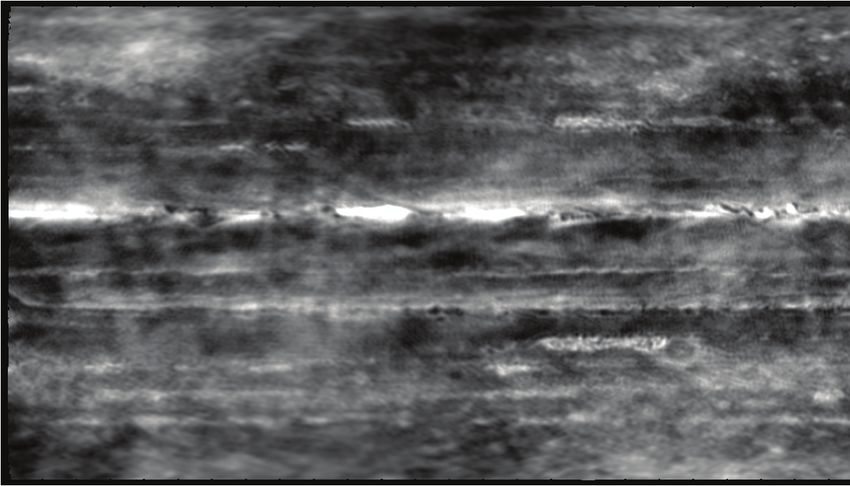
A longitude-smeared image of Jupiter is shown in Fig. 1a. This composite multi-wavelength radio
image of Jupiter reveals numerous bright bands across the disk. These bands are roughly
2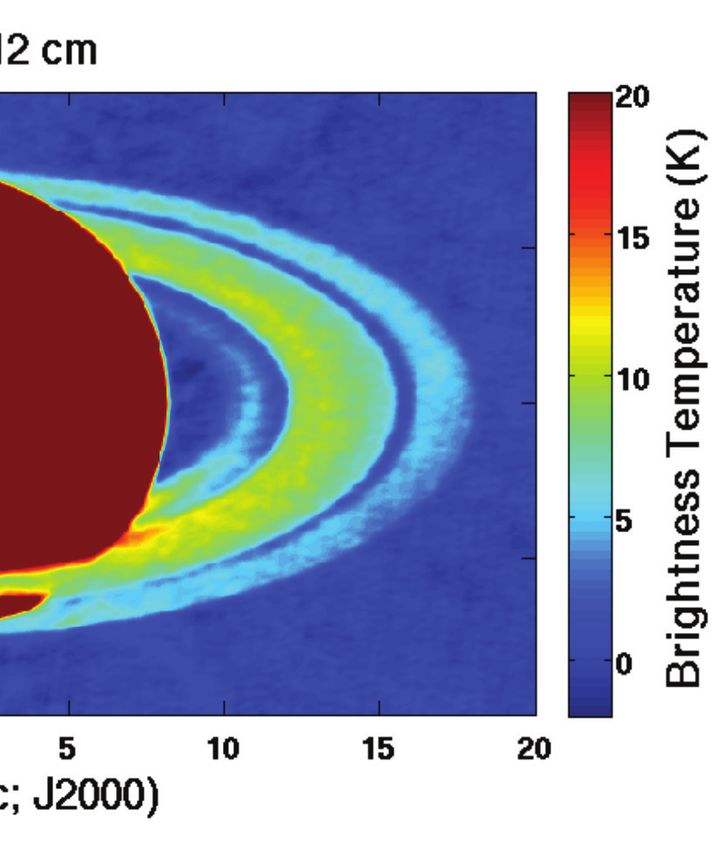
Ku band, Dec. 2013
                                                          Hot spots

                                                                                Plumes

                                                       Tiny plumes                                        GRS
a)
                                                                                BA
                                      b)                                                 Small vortices

Figure 1: a) Radio image of Jupiter constructed from VLA data taken between December 2013 and May
2014 at three wavelengths: 2 cm in blue, 3.5 cm in gold, and 6 cm in red. A uniform disk had been subtracted
to better show the fine banded structure on the planet. The pink glow surrounding the planet is synchrotron
radiation produced by spiraling electrons trapped in Jupiter’s magnetic field. This image is averaged from
several 10-hr observing sessions, so any longitudinal structure is smeared by the planet’s rotation. (de Pater
et al., 2016). b) Longitude-resolved map of Jupiter at a wavelength of 2 cm (Ku band, 12-18 GHz), from
panel a). As in panel a), bright features indicate a high brightness temperature, or low NH3 abundance, so
deeper warmer layers are probed. Much finescale structure can be discerned. The Great Red Spot (GRS) and
Oval BA are indicated, as well as hot spots (yellow arrows), ammonia plumes (red), small vortices (cyan),
and tiny ammonia plumes (orange). (Adapted from de Pater et al., 2019)

co-located with the brown belts seen at visible wavelengths. A longitude-resolved map is shown
in panel b. The image shows an incredible amount of detailed structure, including the GRS and
Oval BA, but also numerous small vortices, hot spots and plumes. The observed variations have
been attributed to spatial variations in NH3 gas, caused by a combination of atmospheric
dynamics and condensation at higher altitudes (de Pater et al., 2016).
Spectra of zones and belts from the longitude-smeared images, and spectra of individual features
on the longitude-resolved maps have been used together with radiative transfer calculations to
determine the altitude distribution of ammonia gas at these locations. These calculations show
that ammonia gas is brought up from the deep atmosphere to the cloud condensation levels in the
Equatorial Zone (EZ), and in particular in the large plumes (red arrows in Fig. 1b), and that the
dry air is descending in the hot spots and North Equatorial Belt down to 20 bar or deeper. The hot
spots coincide with hot spots seen at a wavelength of 5 µm; the plumes have been hypothesized to
form the counterpart of the equatorial Rossby wave (de Pater et al., 2016) theorized to produce
the 5 µm hot spots (e.g. Showman & Dowling, 2000).

3     Giant Planet Ring Systems
Images of Saturn’s microwave emission reveal, in addition to the planet itself, its rings. Using
data from the upgraded VLA, Fig. 2 shows the rings and planet in exquisite detail. The planet
itself is visible through its thermal emission, and displays zones and belts as on Jupiter. The
emission from the planet’s rings is dominated by Saturn’s thermal radiation reflected off the ring
particles. Only a small fraction of the radiation at centimeter wavelengths is thermal emission
from the rings themselves. Water ice comprises the bulk of Saturn’s rings, yet it is the small

                                                      3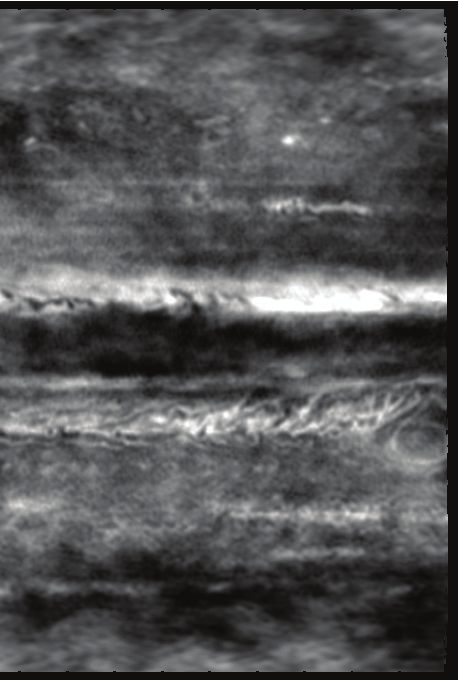
a) b)
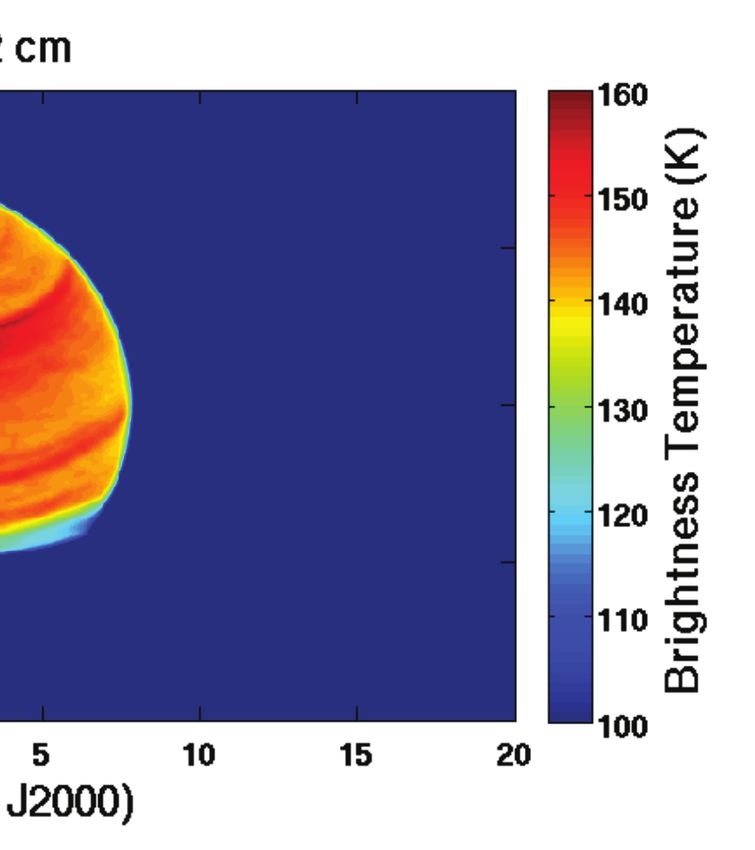
Figure 2: a) Radio image of Saturn at a wavelength of 2 cm (Ku band, 12–18 GHz). The color range is set
from 100K to 160K to highlight Saturn’s radio bands. b) The same image as in panel a), but here the color is
set from -3 K to 20 K to show the structure of the rings. The yellow ellipses on the lower left of each panel
indicate the synthesized beam sizes and corresponding position angles. (Zhang et al., 2019)
fraction of non-icy material that is key in revealing clues about the system’s origin and age. Using
the Monte Carlo Simrings package (Dunn et al., 2002) to fit multi-wavelength (0.7–13 cm) VLA
and 2-cm Cassini/RADAR data of the rings, Zhang et al. (2017; 2019) show that the non-icy
fraction of the rings varies from 0.1–0.5% in the B ring, to 1–2% in the C ring, and that the
particles overall are quite porous (75%-90%, depending on location in the rings). They further
showed that there is a band in the middle C ring where the intrinsic thermal emission is almost
constant with wavelength, and which has an anomalously high non-icy material fraction (6–11%).
This has been interpreted by the presence of large particles, composed of rocky cores covered by
porous, icy mantles. Assuming that the non-icy fraction is due to continuous impacts by
micrometeorites, the rings have been estimated to be no older than 200 Myr, while the middle C
ring might have been hit by a rocky Centaur 10–20 Myr ago.
4 Giant Planet Stratospheres
Several molecules are prevalent in the stratospheres of the giant planets, such as hydrocarbons
Cm Hn (formed e.g., via photochemistry from methane gas), H2 O, CO and HCN (resulting from
infalling materials, and/or brought up from the deep atmosphere). The distribution and line
profiles of these species will help distinguish between species (or fractions thereof) brought up
from the deep atmospheres versus those brought in from the outside. The data can also be used to
derive the wind profiles as a function of latitude and depth.
Prominent emission lines of CO and HCN were detected on Neptune in the early 1990s (Marten
et al., 1993), with abundances ∼ 1000 times higher than predicted from thermochemical models.
While HCN cannot have been brought up as such from Neptune’s deep interior (it would
condense), it is still unclear whether a fraction of the CO in Neptune’s stratosphere is brought up
from below, or if all of it has an external origin. Since the production of CO in Neptune’s interior
depends on the water abundance (CH4 + H2 O → CO + H2 ) and the vertical mixing rate, an
accurate measurement of CO constrains the water abundance in the planet’s interior. The CO 1-0
line is the most sensitive to a potential internal source through accurate measurements of the
wings of the line, which are seen in absorption (originate in the troposphere), in contrast to the
4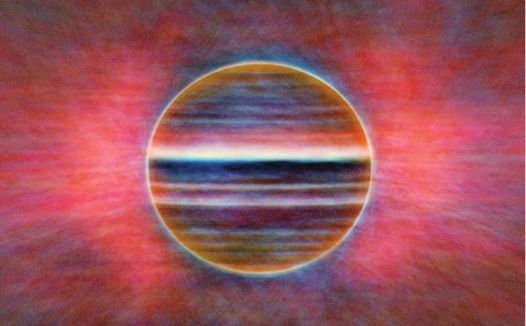
emission line at its center (originating in the stratosphere). One of the challenges is to observe the
entire line, which is several GHz wide, with a narrow emission peak . 10 MHz.

5    Jupiter’s Synchrotron Radiation
Synchrotron radiation has only been detected from Jupiter. It is emitted by high energy (∼ 1–100
MeV) electrons trapped in the planet’s radiation belts. The synchrotron emission morphology and
intensity is changing over time due to the planet’s rotation, as well as in response to impacts (e.g.,
the impact of comet Shoemaker-Levy 9; de Pater et al., 1995), changes in the solar wind ram
pressure, and any other phenomena (internal or external to the magnetosphere) that induce
changes in the energetic electron distribution in Jupiter’s magnetosphere.
Jupiter’s synchrotron radiation has been imaged at frequencies between 74 MHz and 22 GHz (de
Pater et al, 2003; de Pater & Dunn, 2003), usually in all 4 Stokes parameters to better constrain
the models (e.g., magnetic field geometry). Because the radio emission is optically thin and
Jupiter rotates in 10 h, one can use tomographic techniques to map the 3D radio emissivity. The
shape of Jupiter’s radio spectrum is determined by the intrinsic spectrum of the synchrotron
radiating electrons, the spatial distribution of the electrons and Jupiter’s magnetic field. Time
variability in the radio spectrum most likely reflects a change in either the spatial or intrinsic
energy distribution of the electrons. With the ngVLA we may begin investigating the cause of
such variability through its imaging capabilities at high angular resolution at different
wavelengths (quasi)-simultaneously, while at the same time being sensitive to short spacings.
Synchrotron radiation has not been detected from any of the other giant planets; a sensitive search
might reveal such radiation, or put stringent constraints on such emissions.

6    Potential of the ngVLA
To highlight the capabilities of the ngVLA, we have constructed a toy model of a planet with
typical features: banded structure indicating zonal features, and gaussian features such as (cold)
plumes and (warm) hotspots. We used Neptune as a sample case and superimposed structure on
the planet. The features are constructed to be smallest at the limb with increasing size and spacing
towards the center of the planet. The results are shown in Figure 3. Our toy model (panel a) is
shown after subtraction of a limb-darkened disk (disk-averaged brightness temperature ∼ 120 K);
it is populated with both bright and dark bands and spots, that have a contrast of ∼ 1% of the
background, or 1-2K. Panel b) shows the toymodel as it would be seen using the A configuration
for the VLA. Panel c) shows the structure imaged with the full array, where features that are 1K in
magnitude and about 0.01” in size can be distinguished. The banded structure can be seen across
all simulations, where the VLA substantially smears the bands and cannot pick up the fine-scale
structure at the limb. Only the ngVLA is able to pick up a substantial number of the small point
sources, including features as small as 0.01 arcsecs. This can be generalized to resolving
structures down to a size of order < 10km/AU, and with that an order of magnitude better than the
VLA and Juno in the case of Jupiter. In terms of sensitivity, the large collecting area of the
ngVLA results in the lowest RMS in the beam, as seen by the lack of structure off the disk.

                                                  5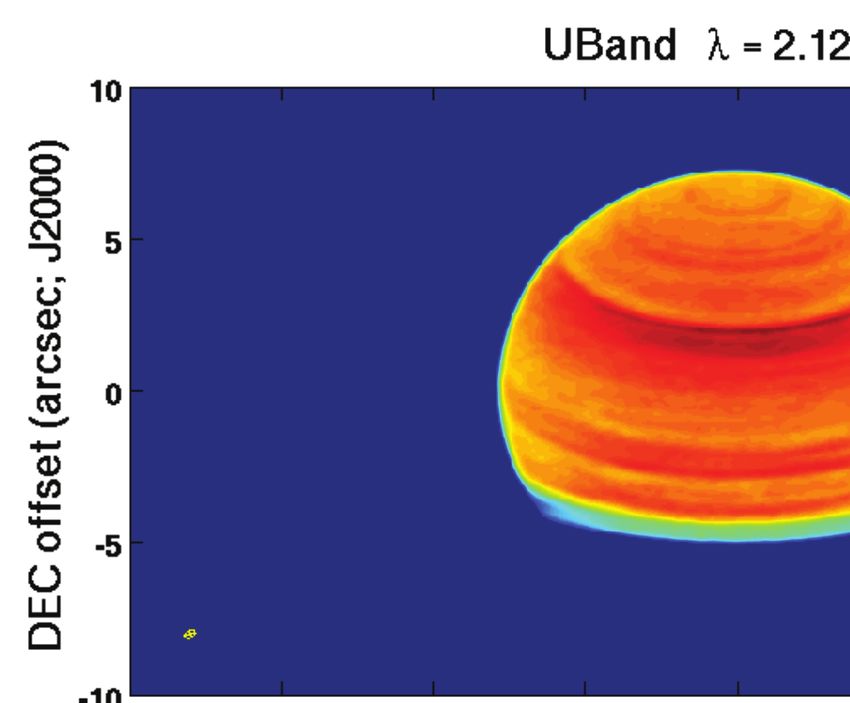
Arcseconds from center
                                                                                       b)

            Arcseconds from center

                                                                                                                Arcseconds from center
                                     Arcseconds from center                            Arcseconds from center                            Arcseconds from center

Figure 3: a) A toy model of Neptune after subtraction of a limb-darkened disk. Note the positive (bright)
and negative (dark) stripes in the southern hemisphere and spots near the center, and extending up into
the northern hemisphere up to ∼ 1/4 of a radius from the northern limb. outlined by the white disk. The
brightness temperature of the various features is of order 1-2 K. The beam size is shown as a white oval in the
bottom left of each simulation. b) Toymodel as seen with the VLA in its most extended (A) configuration.
c) Toy model as seen using the fully extended ngVLA array. (simulations by Moeckel & Tollefson)

7     Conclusions
      • Giant Planet Atmospheres: To determine the composition and unravel the dynamics in
planetary atmospheres we need to map the 3D distribution of gases in the troposphere (e.g., NH3 ,
H2 S, perhaps H2 O) through mapping at continuum wavelengths across the entire ngVLA band at
high spatial resolution (∼ 0.01”), and by mapping the stratosphere of the planets in particular
molecular line transitions (e.g., CO, HCN, H2 O) at high spatial and spectral resolution (∼ 0.01”
and ∼ 100 kHz) to spectrally resolve the emission core of the lines and spatially the limb of the
planets.
• Giant Planet Synchrotron Radiation: We distinguish two goals: 1) Map the 3D distribution of
Jupiter’s synchrotron radiation from 0.3-30 GHz. 2) Search for synchrotron radiation from the
other giant planets. Measurements of all four Stokes parameters are key to interpret the data in
terms of magnetic field geometry and electron (spatial + energy) distributions.
• Planetary Rings: High precision maps of rings at high spatial resolution and at different
frequencies (2-100 GHz) are needed to determine the thermal and scattered (planet) light
emission from the rings, which provides information on e.g., the particle size distribution and
composition of rings. The mass fraction of non-icy material in Saturn’s rings provides an estimate
of the age of the ring system. Polarization will help interpret the data.

                                                                                                     6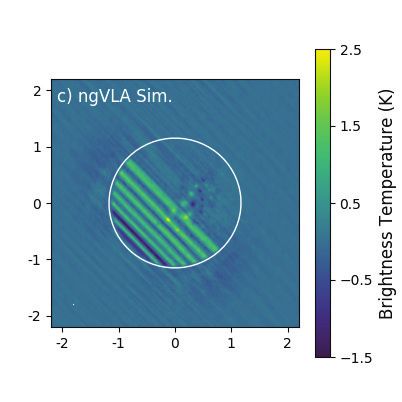
References
de Pater, I., Dunn, D.E., 2003. Icarus, 163, 449-455.
de Pater, I., Mitchell, D. L., 1993. J. Geophys. Res. Planets, 98, 5471-5490.
de Pater, I., et al., 1995. Science, 268, 1879-1883.
de Pater, I., et al., 2003. Icarus, 163, 434-448.
de Pater, I., et al., 2016. Science, 352, 1198-1201.
de Pater, I., et al., 2018. In Science with a Next-Generation VLA, ed. E. J. Murphy (ASP, San
Francisco, CA) (available on arXiv:1810.08521).
de Pater, I., et al., 2019. Icarus, 322, p. 168-191.
Dunn, D. E., Molnar, L. A., Fix, J. D., 2002. Icarus, 160, 132-160.
Marten, A. et al., 1993, Astrophys. J. 406, 285.
Sault, R.J., Engel, C., de Pater, I., 2004. Icarus, 168, 336-343.
Showman, A.P., Dowling, T.E., 2000. Science 289, 1737-1740.
Zhang, Z., et al., 2017. Icarus, 281, 297-321.
Zhang, Z., et al., 2019. Icarus, 317, 518-548.

                                                7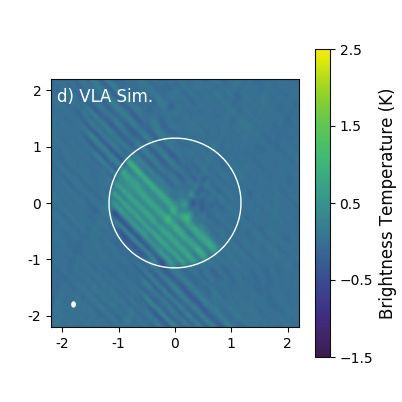

You can also read