Attrition in the European Child Cohort IDEFICS/I.Family: Exploring Associations Between Attrition and Body Mass Index - Lancaster EPrints
←
→
Page content transcription
If your browser does not render page correctly, please read the page content below
ORIGINAL RESEARCH
                                                                                                                                                 published: 15 August 2018
                                                                                                                                             doi: 10.3389/fped.2018.00212

                                                Attrition in the European Child
                                                Cohort IDEFICS/I.Family: Exploring
                                                Associations Between Attrition and
                                                Body Mass Index
                                                Malte Langeheine 1 , Hermann Pohlabeln 1 , Fabio Lauria 2 , Toomas Veidebaum 3 ,
                                                Michael Tornaritis 4 , Denes Molnar 5 , Gabriele Eiben 6,7 , Stefaan de Henauw 8 ,
                                                Luis A. Moreno 9 , Garrath Williams 10 , Wolfgang Ahrens 1,11† and
                                                Stefan Rach 1*† on behalf of the IDEFICS and I.Family Consortia
                                                1
                                                  Leibniz Institute for Prevention Research and Epidemiology–BIPS, Bremen, Germany, 2 Institute of Food Sciences, National
                                                Research Council, Avellino, Italy, 3 National Institute for Health Development, Tallinn, Estonia, 4 Research and Education
                                                Institute of Child Health, Strovolos, Cyprus, 5 Department of Pediatrics, Medical School, University of Pécs, Pécs, Hungary,
                                                6
                          Edited by:              Section for Epidemiology and Social Medicine, Sahlgrenska Academy, University of Gothenburg, Gothenburg, Sweden,
                                                7
                   Steven Hirschfeld,             Department of Biomedicine and Public Health, School of Health and Education, University of Skövde, Skövde, Sweden,
                                                8
  Uniformed Services University of the            Department of Public Health, Ghent University, Ghent, Belgium, 9 Growth, Exercise, Nutrition and Development, Research
       Health Sciences, United States           Group, Faculty of Health Sciences, University of Zaragoza, Instituto Agroalimentario de Aragón, Instituto de Investigación
                                                Sanitaria de Aragón and Centro de Investigación Biomédica en Red de Fisiopatología de la Obesidad y Nutrición, Zaragoza,
                        Reviewed by:
                                                Spain, 10 Department of Politics, Philosophy and Religion, Lancaster University, Lancaster, United Kingdom, 11 Faculty of
                      Daniel Rossignol,
                                                Mathematics and Computer Science, Institute of Statistics, University Bremen, Bremen, Germany
             Rossignol Medical Center,
                         United States
                        Dexter Canoy,           Attrition may lead to bias in epidemiological cohorts, since participants who are healthier
 University of Oxford, United Kingdom
                                                and have a higher social position are less likely to drop out. We investigated possible
                   *Correspondence:
                          Stefan Rach           selection effects regarding key exposures and outcomes in the IDEFICS/I.Family study,
                  rach@leibniz-bips.de          a large European cohort on the etiology of overweight, obesity and related disorders
               † Shared   last authorship       during childhood and adulthood. We applied multilevel logistic regression to investigate
                                                associations of attrition with sociodemographic variables, weight status, and study
                    Specialty section:          compliance and assessed attrition across time regarding children’s weight status and
          This article was submitted to
                   Children and Health,
                                                variations of attrition across participating countries. We investigated selection effects with
                a section of the journal        regard to social position, adherence to key messages concerning a healthy lifestyle, and
                  Frontiers in Pediatrics
                                                children’s weight status. Attrition was associated with a higher weight status of children,
            Received: 17 April 2018
                                                lower children’s study compliance, older age, lower parental education, and parent’s
            Accepted: 09 July 2018
          Published: 15 August 2018             migration background, consistent across time and participating countries. Although
                               Citation:        overweight (odds ratio 1.17, 99% confidence interval 1.05–1.29) or obese children (odds
 Langeheine M, Pohlabeln H, Lauria F,           ratio 1.18, 99% confidence interval 1.03–1.36) were more prone to drop-out, attrition only
 Veidebaum T, Tornaritis M, Molnar D,
  Eiben G, de Henauw S, Moreno LA,
                                                seemed to slightly distort the distribution of children’s BMI at the upper tail. Restricting
    Williams G, Ahrens W and Rach S             the sample to subgroups with different attrition characteristics only marginally affected
 (2018) Attrition in the European Child
                                                exposure-outcome associations. Our results suggest that IDEFICS/I.Family provides
   Cohort IDEFICS/I.Family: Exploring
   Associations Between Attrition and           valid estimates of relations between socio-economic position, health-related behaviors,
                      Body Mass Index.          and weight status.
                   Front. Pediatr. 6:212.
       doi: 10.3389/fped.2018.00212             Keywords: cohort attrition, child health, BMI, selection effects, cross country differences

Frontiers in Pediatrics | www.frontiersin.org                                          1                                                August 2018 | Volume 6 | Article 212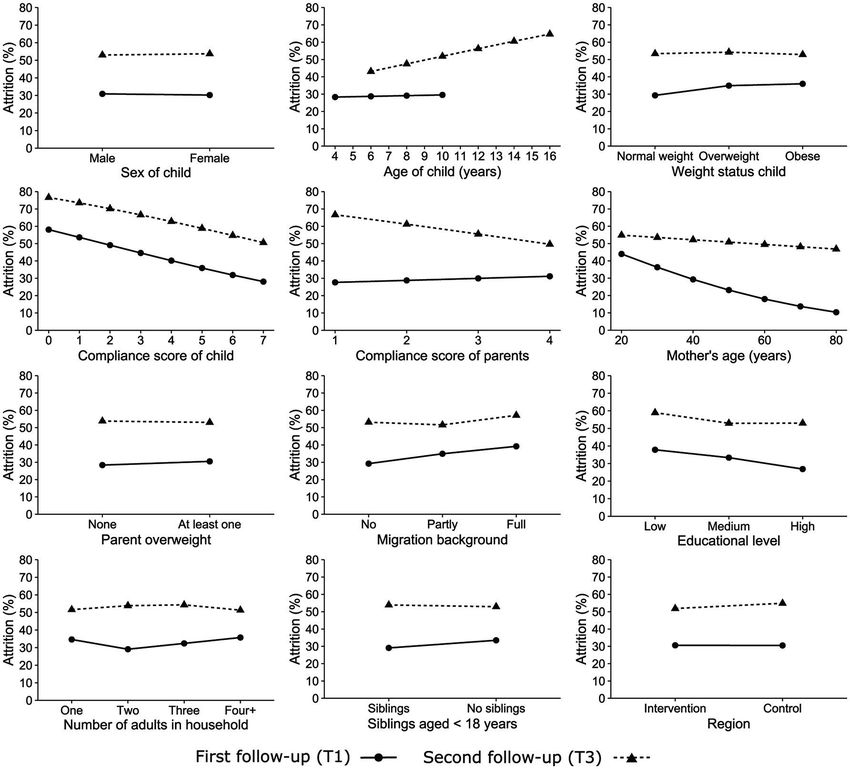
Langeheine et al.                                                                                                Cohort Attrition and BMI in IDEFICS/I.Family

INTRODUCTION
Epidemiological cohort studies are not only prone to non-
response at baseline, but also to drop-out of participants during
follow-up (1), called cohort attrition. Since non-response and
drop-out are more likely among less healthy and disadvantaged
study participants (2–4), it is especially important for cohort
studies to assess selection effects. IDEFICS (Identification and
prevention of dietary and lifestyle-induced health effects in
children and infants) (5) and I.Family (IDEFICS/I.Family cohort)
(6) is a large European prospective cohort including children
from eight countries (Belgium, Cyprus, Estonia, Germany,
Hungary, Italy, Spain, and Sweden) that has been investigating
dietary, behavioral and socioeconomic factors in relation to
non-communicable chronic diseases and disorders with a focus
on overweight and obesity (5, 6). In IDEFICS/I.Family, a total
of 16,228 children and their parents took part in up to three
physical examinations between 2007 and 2014 and completed
questionnaires on medical history, dietary behavior and other
aspects of children’s life. The present analysis complements the
IDEFICS/I.Family cohort profile (5, 6). We extend the attrition
analysis that included only the first follow-up examination (7)
                                                                             FIGURE 1 | Flow chart of the participation in the IDEFICS baseline
and we build on the observed selection effects at baseline                   examination (T0), the first IDEFICS follow-up examination (T1), and the second
(8) and the association between recruitment effort and drop-                 follow-up examination in the I.Family study (T3). The refreshment samples at
out (9). Here we investigate the association of cohort attrition             the first and the second follow-up (6) were excluded from this analysis.
with sociodemographic characteristics, weight status, and study
compliance in IDEFICS/I.Family (“study compliance” marks how
far child and parents undertook all the requested measures and
questionnaires). We also consider variations of attrition across            amendments. Approval was obtained by each of the centers
the first and second follow-up and between the participating                engaged in the fieldwork by its appropriate ethics committees.
countries, focusing on selection effects by children’s weight status.       To ensure that data collection and study parameters were
                                                                            similar between countries, a common manual of operations
METHODS                                                                     containing standard operating procedures for all examinations
                                                                            was developed, and site visits were conducted in all study centers
Analysis Group                                                              by a central quality control to ensure compliance.
In IDEFICS/I.Family, data were collected in each country in                     In total, 16,228 children participated in the IDEFICS baseline
two or more selected communities. The sociodemographic                      examination (T0), carried out between September 2007 and
profile and infrastructure of the communities were similar and              May 2008 (Figure 1). All children who took part in the
typical for their region. All children aged 2–9.9 years attending           baseline examination were invited to the first follow-up (T1)
kindergarten or primary school within each community                        between September 2009 and May 2010 where 11,041 children
were eligible. Parents of potential study subjects were either              participated. Baseline and first follow-up included identical
approached directly by mail or by letters delivered through                 examination modules.
teachers and caretakers in kindergartens and schools. They were                 A second follow-up examination (I.Family, T3) was conducted
asked for consent to examine their children as well as to answer a          between 2013 and 2014, again with similar examination modules
number of questionnaires. Children and parents were informed                (6). Children who participated at baseline, their siblings, and
about all aspects of the study. Parents gave their written informed         their parents were invited to take part in I.Family, and a total of
consent prior to inclusion into the study; children 12 years or             6,055 IDEFICS children were examined. Of the 11,041 children
older signed a simplified consent form. Immediately before each             examined at the first follow-up, 5,097 children took part in
examination, a study nurse informed each child orally about                 I.Family. In addition, 958 children took part in I.Family who
the module using a simplified preformulated text. Children were             participated at baseline, but not in the first follow-up. Due to
informed that they do not have to participate if they don’t want to         model constraints, these children were considered first follow-
and examinations were only performed if children assented and               up drop-outs, that is, only baseline data were included in the
parents consented. Consent could be given to single components              analysis. A complete-cases analysis reduced the sample size to
of the study while refusing others.                                         15,618 children at baseline, 10,314 children at the first follow-
    All procedures performed in IDEFICS/I.Family were in                    up, and 4,852 children at the second follow-up. This resulted in a
accordance with the ethical standards of the institutional                  total of 25,932 person-wave observations at baseline and the first
committee and the 1964 Declaration of Helsinki and its later                follow-up being included in the analysis. Baseline characteristics

Frontiers in Pediatrics | www.frontiersin.org                           2                                               August 2018 | Volume 6 | Article 212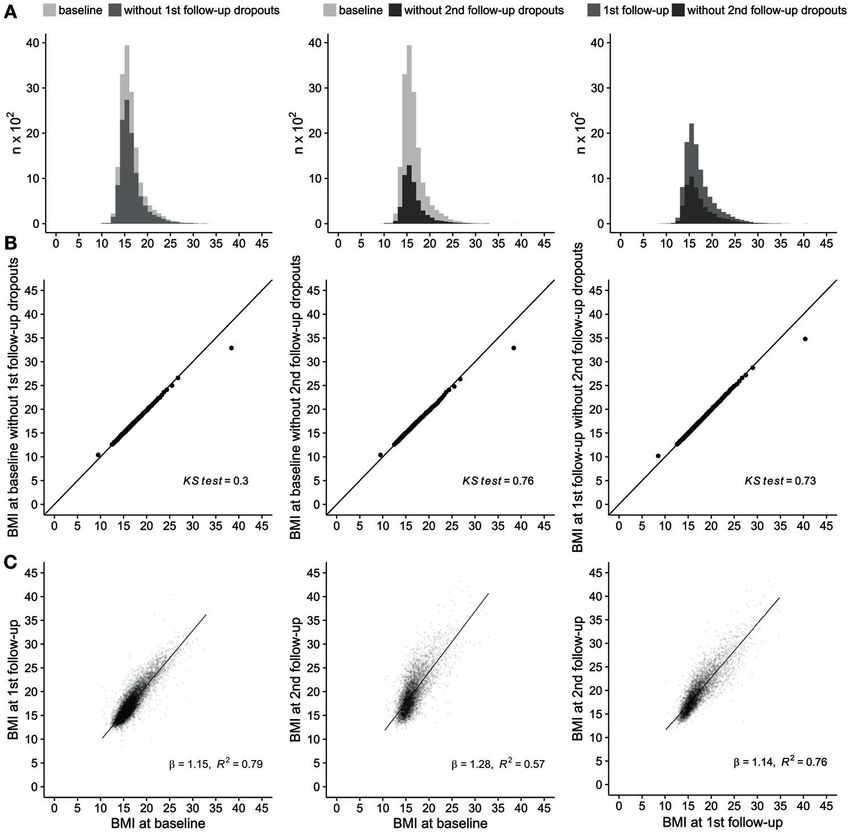
Langeheine et al. Cohort Attrition and BMI in IDEFICS/I.Family
TABLE 1 | Baseline characteristics of the IDEFICS/I.Family baseline sample and the subsamples that participated in the two follow-ups.
Participated at T1 Participated at T3
Baseline participants Yes No Yes No
Mean SD Mean SD Mean SD Mean SD Mean SD
Age child (years) 6.0 1.8 6.0 1.8 6.0 1.8 5.9 1.8 6.1 1.8
Compliance score of child 6.3 1.1 6.4 1.1 6.2 1.3 6.4 1.0 6.4 1.1
Compliance score parent(s) 3.5 0.8 3.5 0.8 3.5 0.8 3.5 0.7 3.4 0.8
Mother’s age (years) 35.2 5.3 35.5 5.3 34.5 5.4 35.7 5.2 35.4 5.3
n % n % n % n % n %
Sex of child
Male 7,928 50.8 5,418 50.6 2,510 51.1 2,511 50.8 2,907 50.4
Female 7,690 49.2 5,291 49.4 2,399 48.9 2,433 49.2 2,858 49.6
Weight status child
Normal weight 12,543 80.3 8,724 81.5 3,819 77.8 4,002 80.9 4,722 81.9
Overweight 1,963 12.6 1,275 11.9 688 14.0 611 12.4 664 11.5
Obese 1,112 7.1 710 6.6 402 8.2 331 6.7 379 6.6
Weight status parents
No parent overweight 3,943 25.2 2,836 26.5 1,107 22.6 1,355 27.4 1,481 25.7
At least one parent overweight 10,059 64.4 6,909 64.5 3,150 64.2 3,162 64.0 3,747 65.0
Missing 1,616 10.3 964 9.0 652 13.3 427 8.6 537 9.3
Migration background
No 12,906 82.6 8,972 83.8 3,934 80.1 4,149 83.9 4,823 83.7
Partly 1,384 8.9 939 8.8 445 9.1 475 9.6 464 8.0
Full 1,079 6.9 656 6.1 423 8.6 265 5.4 391 6.8
Missing 249 1.6 142 1.3 107 2.2 55 1.1 87 1.5
Educational level
Low education 7,335 47.0 5,387 50.3 1,948 39.7 2,582 52.2 2,805 48.7
Medium education 7,010 44.9 4,554 42.5 2,456 50.0 2,062 41.7 2,492 43.2
High education 1,073 6.9 651 6.1 422 8.6 251 5.1 400 6.9
Missing 200 1.3 117 1.1 83 1.7 49 1.0 68 1.2
Number of adults in household
One 1,255 8.0 763 7.1 492 10.0 332 6.7 431 7.5
Two 11,032 70.6 7,847 73.3 3,185 64.9 3,633 73.5 4,214 73.1
Three 1,081 6.9 740 6.9 341 6.9 372 7.5 368 6.4
Four or more 424 2.7 270 2.5 154 3.1 134 2.7 136 2.4
Missing 1,826 11.7 1,089 10.2 737 15.0 473 9.6 616 10.7
Siblings aged < 18 years
Yes 3,667 23.5 2,364 22.1 1,303 26.5 1,063 21.5 1,301 22.6
No 10,364 66.4 7,412 69.2 2,952 60.1 3,482 70.4 3,930 68.2
Missing 1,587 10.2 933 8.7 654 13.3 399 8.1 534 9.3
Region
Intervention 8,075 51.7 5,525 51.6 2,550 51.9 2,607 52.7 2,918 50.6
Control 7,543 48.3 5,184 48.4 2,359 48.1 2,337 47.3 2,847 49.4
Country
Spain 1,480 9.5 1,203 11.2 277 5.6 429 8.7 774 13.4
Hungary 2,496 16.0 1,218 11.4 1,278 26.0 468 9.5 750 13.0
Germany 2,008 12.9 1,165 10.9 843 17.2 637 12.9 528 9.2
Cyprus 2,111 13.5 1,589 14.8 522 10.6 862 17.4 727 12.6
Estonia 1,650 10.6 1,284 12.0 366 7.5 721 14.6 563 9.8
Belgium 1,884 12.1 1,236 11.5 648 13.2 242 4.9 994 17.2
Italy 2,241 14.3 1,543 14.4 698 14.2 873 17.7 670 11.6
Sweden 1,748 11.2 1,471 13.7 277 5.6 712 14.4 759 13.2
N 15,618 100 10,709 100 4,909 100 4,944 100 5,765 100
Note that percentages may not sum to 100% due to rounding. SD, standard deviation.
Frontiers in Pediatrics | www.frontiersin.org 3 August 2018 | Volume 6 | Article 212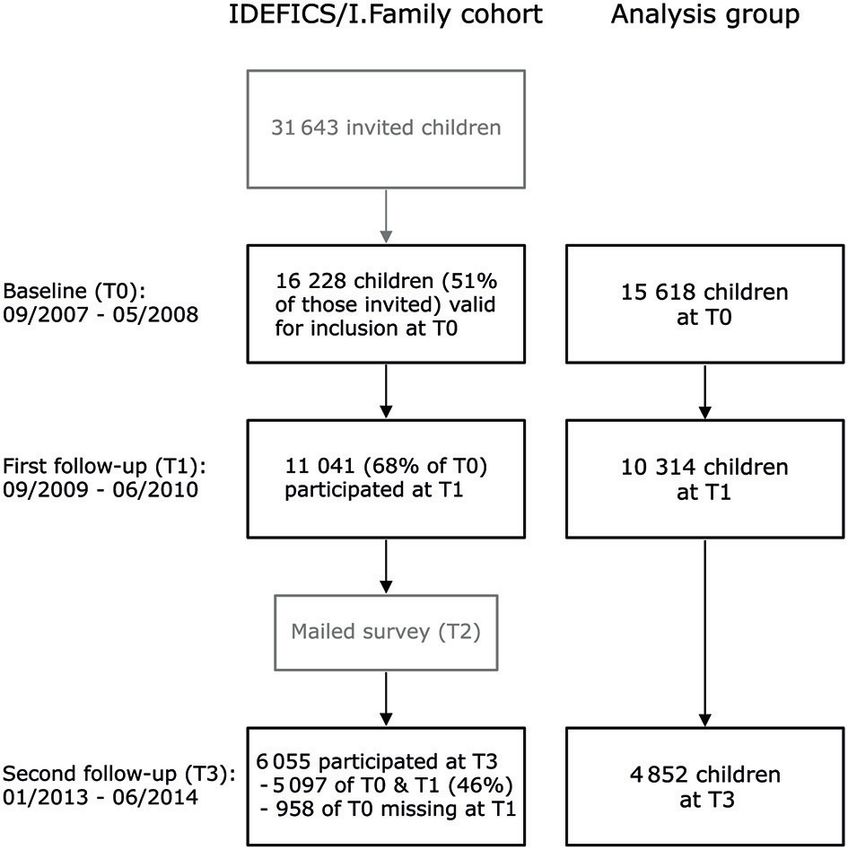
Langeheine et al.                                                                                                   Cohort Attrition and BMI in IDEFICS/I.Family

of the IDEFICS/I.Family baseline sample and the subsamples that           TABLE 2 | Number and percentage of children and parents participating in
participated in the two follow-ups are summarized in Table 1.             examination modules at baseline and at first follow-up.

                                                                                         Examination module                                  Participation
Outcome
The outcome cohort attrition was defined with respect to                                                                            Baseline         First follow-
                                                                                                                                     n (%)             up n (%)
participation in the first (T1) and the second (T3) follow-up
examination (0: participation vs. 1: dropout).                            Children       Blood pressure                              14,752             10,563
                                                                                                                                      (90.9)             (95.7)
Exposures                                                                                Bioelectrical impedance analysis            15,720             10,795
The social position of families was classified according to the                          (fasting state)                              (96.9)             (97.8)
International Standard Classification of Education (ISCED) (10)                          Waist-to-hip ratio                          15,551             10,731
using the highest educational attainment of mother or father                                                                          (95.8)             (97.2)
(low: ISCED levels 0–2; medium: ISCED levels 3–4; high: ISCED                            Skinfold thickness (subscapularis           15,160             10,567
                                                                                         and triceps)                                 (93.4)             (95.7)
levels 5 and higher). The household composition was described as
the presence of non-adult siblings besides the participating child                       Venous or capillary blood (fasting          12,855              8,528
                                                                                         state)                                       (79.2)             (77.2)
(yes vs. no) and the number of adults (age 18 or older) living
                                                                                         Morning urine                               13,945              8,845
in the household. The place of birth of parents served to define                                                                      (85.9)             (80.1)
the migration background (full migrant: both parents foreign-
                                                                                         Salivaa                                     14,273               188
born; partly migrant: one parent foreign-born; not migrant:                                                                           (88.0)              (1.7)
otherwise). Children’s age and mother’s age on the day of the
examination was recorded in years. For drop-outs at the first             Parents        General questionnaire (children             16,117             10,539
or second follow-up, children’s, and mother’s age was estimated                          parents)                                     (99.3)             (95.5)
by adding the mean duration between two examinations to the                              Food frequency questionnaire                15,199              9,963
                                                                                                                                      (93.7)             (90.2)
age at the previous examination. Because of collinearity and a
                                                                                         Medical history                             12,418              8,978
higher percentage of missing values, the father’s age was not
                                                                                                                                      (76.5)             (81.3)
considered in the analysis. The weight status was determined
                                                                                         24-h dietary recall                         11,671              5,520
using the body mass index (BMI). Children’s weight status                                                                             (71.9)             (50.0)
(thin and normal weight, overweight, obese) was categorized
according to Cole and Lobstein (11). Parent’s weight status (self-        a The
                                                                              collection of saliva at the first follow-up was restricted to children without a saliva
reported) was categorized as “no parent overweight,” “at least one        sample at baseline. Therefore saliva was defined as being available at first follow-up if a
                                                                          sample was available at baseline or first follow-up.
parent overweight,” and “missing.” Overweight was defined as
having a BMI ≥25. A score of study compliance was constructed
separately for children and parents based on the number of
key examination modules they participated in at baseline and              associations a more stringent criterion for statistical significance
at first follow-up (Table 2). This was done by counting the               (α = 0.01) was chosen. Data were transformed such that each
number of completed modules (0: module not completed; 1:                  unit of analysis represented a person-wave observation (13, 14).
module completed). For children, key modules were blood                   Variables included in the model were either time constant (e.g.,
pressure, bioelectrical impedance analysis (fasting state), waist-        sex of the child), or time-variant predictors (e.g., weight status
to-hip ratio, skinfold thickness (subscapularis and triceps),             of the child). Time-variant predictors were modeled as lagged
blood sample (fasting state), morning urine, and saliva. Parent’s         covariates, that is, information at baseline was regressed on
(respectively mother or father) provided key modules included             attrition at first follow-up and information at the first follow-up
the general questionnaire, food frequency questionnaire, medical          was regressed on attrition at the second follow-up. Sensitivity
history, and the 24-h dietary recall. At the first follow-up, the         analyses were carried out to check for non-independence of
collection of saliva was restricted to children without a saliva          siblings in the sample. Random sampling (n = 100) was used to
sample at baseline. Therefore saliva was defined as being available       select one child of each family and calculate a random intercept
at first follow-up if a sample was available at baseline or first         logistic regression model for each sample to obtain a mean
follow-up.                                                                odds ratio and a corresponding confidence interval for each
                                                                          predictor. The odds ratios of a logistic regression model with
Statistical Analysis                                                      all children and the mean odds ratios for the 100 samples did
The association between attrition and sociodemographic                    not differ substantially. To assess the variation of attrition across
variables, weight status, and study compliance was assessed               time in separate models all possible interaction terms between
by estimating odds ratios (ORs) and 99% confidence intervals              potential predictors of attrition and time point of follow-up
(CIs) using a multivariable multilevel logistic regression with           examination were calculated [time × (sex of child, age child,
respondents as the second-level variable and country as the third-        weight status child, compliance score of child, compliance
level to account for clustering (12). To avoid that meaningless           score parent(s), mother’s age, weight status parents, migration
associations become statistically significant just because of             background, educational level, number of adults in household,
the large sample size and to account for multiple testing of              siblings aged
Langeheine et al. Cohort Attrition and BMI in IDEFICS/I.Family
the countries was investigated by means of meta-analyses: to some of the recommendations were assigned accordingly. A
Country-stratified logistic regression models with attrition full description of the analysis is given in Kovac et al. (18).
as the dependent variable and the same predictors as in the Analyses were performed using R version 3.3.3 (http://www.r-
random intercept logistic regression model were fitted and a project.org/).
random-effects meta-analysis (RE model) (15) was calculated
for each predictor of the country-stratified logistic regression
models. To evaluate the heterogeneity of attrition between the RESULTS
countries, the percentage of variation that is due to heterogeneity,
I 2 (16), and forest plots were used. Selection effects on children’s The multilevel logistic regression model with cohort attrition
BMI across time were assessed with quantile-quantile plots as dependent variable (Table 3) revealed that children’s age in
(Q-Q plots) and Kolmogorov-Smirnov tests (KS test) (17). We years was positively associated with attrition (OR 1.05, 99% CI
explored the impact of selection effects on the cross-sectional 1.02–1.07). Compared to normal weight children, overweight
association of social position and weight status. Children’s weight (OR 1.17, 99% CI 1.05–1.29) or obese (OR 1.18, 99% CI 1.03–
status was converted into a binary variable (0: normal weight 1.36) children had a higher chance of attrition. Higher study
including thin vs. 1: obese including overweight) further referred compliance of children was associated with lower attrition (OR
to as overweight/obesity. Social position included educational 0.84, 99% CI 0.81–0.87), as was higher mother’s age (OR 0.98,
level (as described above) and income level (low, low/medium, 99% CI 0.97–0.99). Children with a partly (OR 1.13, 99% CI 1.00–
medium, medium/high, vs. high income). We estimated baseline 1.28) or full migrant background (OR 1.41, 99% CI 1.21–1.63)
associations and then estimated identical associations with had a higher chance of attrition, as had children of parents with
subsamples restricted to first follow-up participants (T1) and a low (OR 1.49, 99% CI 1.27–1.74) or medium (OR 1.19, 99% CI
second follow-up participants (T3) as well as associations at the 1.10–1.29) educational level.
first follow-up (T1) and the restricted sample of second follow-up Variations of attrition across time are depicted in Figure 2
participants (T3). In addition, we explored selection effects on as probabilities predicted from separate random intercept
the association between adherence to key messages of a healthy logistic regression models containing interaction terms between
lifestyle promoted by IDEFICS/I.Family and overweight/obesity potential predictors of attrition and time point of follow-up
published by Kovacs et al. (18). In this analysis we included total examination. Age of child was not associated with attrition at
screen time, moderate to vigorous physical activity (MVPA), the first follow-up but was positively associated with attrition
and sleep duration as measures of adherence [see (18) for at the second follow-up. Higher parent’s study compliance was
detailed information on instruments and operationalization]. associated with lower attrition at the second follow-up, but was
In accordance with Kovacs et al. (18), we calculated a binary not associated with attrition at the first follow-up. A higher age of
indicator for adherence on respective cut points for screen the mother was associated with lower attrition at first follow-up
time, MVPA, and sleep. We estimated the baseline association but not at the second follow-up.
of adherence and overweight/obesity and then estimated the To assess how well the model represented data of individual
identical association with subsamples restricted to first follow-up countries, we explored with forest plots whether single countries
participants (T1) and second follow-up participants (T3). differed notably from the overall pattern, that is, whether the
For the exposure-outcome association of adherence to key sign of a countries’ odds ratio for a given exposure variable
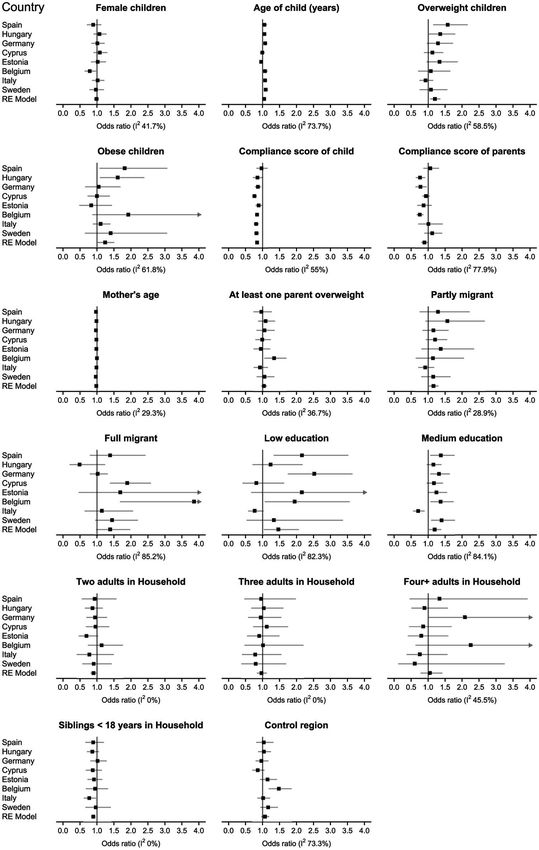
messages of a healthy lifestyle and overweight/obesity, as well differed from the pooled estimate (Figure 3). For 14 out of 17
as social position and overweight/obesity we estimated odds predictors, estimates for all countries were in line with the pooled
ratios and confidence intervals with multivariable multilevel estimate. Female children in Belgium had a lower chance of
logistic regression models. For the sake of comparability we attrition, whereas no association of sex was found for the pooled
used 95% confidence intervals in the analysis reproducing the estimate. A medium educational level was associated with a lower
association of adherence to key messages and overweight/obesity chance of attrition in Italy, while the pooled estimate indicated
published by Kovacs et al. (18) (described above). All other a higher chance of attrition for a low or high educational level.
analyses, as pointed out above, utilized 99% confidence Further, children from the control region in Belgium had a
intervals. higher chance of attrition while no association for the region was
To quantify a potential bias we calculated the percent change evident in the pooled estimate. Between countries, substantial
in point estimates (CPE = OR subsample /OR full sample × 100 – heterogeneity was observed for study compliance of children,
100). We considered a CPE of above 10% as indicator of weight status (overweight/obese; I 2 from 50 to 70%), age of the
a bias. For Table 6 we stratified overweight/obesity by the child, study compliance of parents, full migrant status, low or
combination of adherence to key messages regarding media medium education, and control region (I 2 from 70 to 100%).
consumption, physical activity and sleep. Children who did not Sensitivity analyses showed that exclusion of country-stratified
adhere to the recommendations of screen time and physical odds ratios identified as exceptions attenuated I 2 : Excluding
activity and sleep duration were assigned to the group – – – Belgium decreased I 2 to zero for the predictor female and
(1,666 children in T0 full sample). In contrast, children who decreased I 2 for the control region; excluding Italy decreased the
did adhere to all recommendations of screen time and physical I 2 of low education.
activity and sleep duration were assigned to the group + + + Since IDEFICS/I.Family was a multi-purpose cohort focusing
(263 children in T0 full sample). Children who adhered only on overweight and obesity, we further investigated selection
Frontiers in Pediatrics | www.frontiersin.org 5 August 2018 | Volume 6 | Article 212Langeheine et al. Cohort Attrition and BMI in IDEFICS/I.Family
TABLE 3 | Odds ratios with 99% confidence intervals for cohort attrition.
Cohort attrition
No Yes ORa (99% CI)
n % n %
Time
First follow-up (T1) 10,709 68.6 4,909 31.4 ref.
Second follow-up (T3) 4,852 47.0 5,462 53.0 2.62 (2.32–2.96)
Sex of childb
Male 7,883 60.1 5,244 39.9 ref.
Female 7,678 60.0 5,127 40.0 0.99 (0.93–1.07)
Age child (years)c 1.05 (1.02–1.07)
Weight status childc
Normal weight 12,418 60.9 7,978 39.1 ref.
Overweight 2,059 56.5 1,588 43.5 1.17 (1.05–1.29)
Obese 1,084 57.4 805 42.6 1.18 (1.03–1.36)
Compliance score of childc 0.84 (0.81–0.87)
Compliance score parent(s)c 0.93 (0.88–0.98)
Mother’s age (years)c 0.98 (0.97–0.99)
Weight status parentsc
No parent overweight 4,010 62.7 2,388 37.3 ref.
At least one parent overweight 10,074 60.2 6,660 39.8 1.05 (0.96–1.14)
Missing 1,477 52.8 1,323 47.2 1.23 (1.08–1.40)
Migration backgroundb
No 12,961 60.6 8,427 39.4 ref.
Partly 1,395 61.6 871 38.4 1.13 (1.00–1.28)
Full 905 53.8 778 46.2 1.41 (1.21–1.63)
Missing 300 50.4 295 49.6 1.35 (0.96–1.91)
Educational levelb
Low education 7,965 63.2 4,639 36.8 1.49 (1.27–1.74)
Medium education 6,656 57.9 4,837 42.1 1.19 (1.10–1.29)
High education 912 53.4 796 46.6 ref.
Missing 28 22.0 99 78.0 1.12 (0.77–1.62)
Number of adults in householdc
One 1,122 54.2 949 45.8 ref.
Two 11,401 61.5 7,149 38.5 0.89 (0.78–1.02)
Three 1,109 59.5 755 40.5 0.98 (0.82–1.18)
Four or more 414 57.3 308 42.7 1.02 (0.80–1.30)
Missing 1,515 55.6 1,210 44.4 1.02 (0.72–1.44)
Siblings agedLangeheine et al. Cohort Attrition and BMI in IDEFICS/I.Family
FIGURE 2 | Predicted probabilities of separately modeled interactions of the predictors and time in the random intercept logistic regression. Time variant variables are
age of child (years), weight status of child, compliance score of child and of parents, mother’s age (years), and parent’s overweight.
effects of children’s BMI. BMI distributions for all children and at baseline vs. BMI at second follow-up) and ß coefficients
the corresponding BMI distributions for children that did not of linear regression models were used to evaluate selection
drop out at a particular follow-up are displayed in Figure 4, effects of BMI across time (Figure 4C). The correlation
column 1–3. The histograms of BMI at baseline and BMI at between children’s BMI at different time points was
baseline without the children that dropped out at the first follow- consistent across time, both in the shape of the scatter
up differed in the number of observations per bin but the Q-Q plot and the ß coefficients (baseline vs. first follow-up:
plot as well as the KS test (2 sided P-value of 0.30) (Figure 4B, ß = 1.15, R2 = 0.79; first follow-up vs. second follow-up:
column 1) indicated equal distributions. Similar results were ß = 1.14, R2 = 0.76; baseline vs. second follow-up: ß = 1.28,
obtained for the distribution of BMI at the first follow-up and R2 = 0.57).
the resulting distribution when second follow-up drop-outs were We explored the impact of selection effects due to the
excluded (KS test: 2 sided P-value of 0.73) (Figure 4B, column association between childhood overweight and social position
2) as well as for the distribution of BMI at baseline and the [e.g., (19); for a review, (20)] at baseline and both follow-ups.
corresponding distribution without second follow-up dropouts To this end, we estimated associations between BMI and social
(KS test: 2 sided P-value of 0.76) (Figure 4B, column 3). variables in the complete baseline sample and compared them
Density scatter plots with children’s BMI at baseline to associations between the same variables in two subsamples
plotted against BMI at the first follow-up (respectively restricted to participants of the first follow-up and participants
BMI at first follow-up vs. BMI at second follow-up; BMI of the second follow-up, respectively (Table 4). We repeated this
Frontiers in Pediatrics | www.frontiersin.org 7 August 2018 | Volume 6 | Article 212Langeheine et al. Cohort Attrition and BMI in IDEFICS/I.Family FIGURE 3 | Odds ratios for attrition (with 99% confidence intervals, CI) from country-stratified logistic regression models (ordered by baseline response) with attrition as dependent variable and same predictors as in the random intercept logistic regression model (Table 3) as well as a pooled estimate of a random-effects meta-analyses (RE model), and I2 (%) as a measure of heterogeneity between the countries. I2 values above 50% indicating substantial heterogeneity were observed for 9 out of 17 variables. Arrows at the upper limit of a CI: SD, standard deviation confidence interval extends past four. Frontiers in Pediatrics | www.frontiersin.org 8 August 2018 | Volume 6 | Article 212
Langeheine et al.                                                                                                                 Cohort Attrition and BMI in IDEFICS/I.Family

 FIGURE 4 | Effect of cohort attrition on the distribution of children’s body mass index (BMI). (A) Histograms of children’s BMI at baseline for different subgroups show
 no evidence for differences in distributions. Left: full baseline sample vs. baseline sample without attrition at first follow-up; middle: full baseline sample vs. baseline
 sample without attrition at second follow-up; right: first follow-up sample vs. first follow-up sample without attrition at second follow-up. (B) Quantile-quantile plot (Q-Q
 plot) and Kolmogorov-Smirnov test (KS test, 2 sided P value) of children’s baseline BMI for different subgroups show no evidence for differences in distributions.
 Results of KS tests (all p ≥ 0.3) also indicate insufficient evidence to reject the null hypothesis that the respective distributions are the same. Left: full baseline sample
 vs. baseline sample without attrition at first follow-up; middle: full baseline sample vs. baseline sample without attrition at second follow-up; right: first follow-up
 sample vs. first follow-up sample without attrition at second follow-up. (C) Scatter plot and results of linear regressions (ß coefficients and R2 ) between children’s BMI
 at different time points indicate that the correlation was consistent across time. Left: full baseline sample vs. baseline vs. first follow-up, middle: baseline vs. second
 follow-up; right: first follow-up vs. second follow-up.

procedure with data from the first follow-up for all participants                          level. Apart from medium income, CPE of income level was well
of the first follow-up and a subsample restricted to all participants                      above 10%.
of the second follow-up (Table 4).                                                             A lower educational level was associated with a higher chance
    At all time points, a lower income level was associated with                           of overweight/obesity at baseline and first follow-up. Restricting
a higher chance of overweight/obesity. Restricting the baseline                            the association of educational level and overweight/obesity did
association (T0) of income level to T1 participants marginally                             not affect the trend of this association, with a CPE for the baseline
affected odds ratios indicated by a CPE of
Langeheine et al. Cohort Attrition and BMI in IDEFICS/I.Family
TABLE 4 | Association between overweight/obesity and social position (odds ratios with 99% confidence intervals).
Baseline association First follow-up association
T0 full sample T1 subsample % change in T3 subsample % change in T1 full sample T3 subsample % change in
ORa (99% CI) ORa (99% CI) OR (T1 vs. T0) ORa (99% CI) OR (T3 vs. T0) ORa (99% CI) ORa (99% CI) OR (T3 vs. T1)
Income levelc
Low 1.43 (1.12–1.82) 1.34 (1.00–1.81) −6.3 1.55 (1.02–2.38) 8.4 1.47 (1.13-1.92) 1.79 (1.22-2.63) 21.8
Low/medium 1.38 (1.09–1.74) 1.36 (1.02–1.80) −1.5 1.33 (0.87–2.03) −3.6 1.43 (1.12–1.84) 1.77 (1.23–2.57) 23.8
Medium 1.36 (1.10–1.68) 1.30 (1.01–1.68) −4.4 1.51 (1.04–2.19) 11.0 1.39 (1.12–1.73) 1.53 (1.11–2.11) 10.1
Medium/high 1.25 (1.00–1.57) 1.18 (0.90–1.55) −5.6 1.29 (0.86–1.92) 3.2 1.16 (0.92–1.48) 1.40 (0.98–1.98) 20.7
High ref. ref. ref. ref. ref. ref. ref. ref.
Educational levelb
Low 1.55 (1.21–1.97) 1.60 (1.18–2.17) 1.6 1.78 (1.12–2.84) 9.0 1.72 (1.27–2.32) 1.69 (1.06–2.69) −8.2
Medium 1.22 (1.06–1.40) 1.24 (1.05–1.47) 3.2 1.33 (1.04–1.70) 14.8 1.22 (1.04–1.43) 1.12 (0.88–1.41) −1.7
High ref. ref. ref. ref. ref. ref. ref. ref.
Age child (years)c 1.24 (1.20–1.29) 1.25 (1.20–1.31) 0.8 1.23 (1.16–1.31) −0.8 1.18 (1.14–1.23) 1.19 (1.12–1.26) 0.9
Sex of childb
Male ref. ref. ref. ref. ref. ref. ref. ref.
Female 1.21 (1.07–1.36) 1.20 (1.04–1.39) −0.8 1.14 (0.92–1.40) −5.8 1.11 (0.97–1.27) 1.14 (0.93–1.38) 2.7
Regionb
Intervention ref. ref. ref. ref. ref. ref. ref. ref.
Control 0.94 (0.84–1.06) 0.95 (0.82–1.10) 1.1 0.89 (0.72–1.09) −5.3 0.97 (0.84–1.11) 0.89 (0.73–1.09) −8.3
N 13,855 9,604 4,461 9,068 4,340
OR, odds ratio; CI, confidence interval; ref., reference category.
a Odds ratios and confidence intervals for overweight/obesity adjusted for country.
b Time invariant variable using information from baseline (T0).
c Time variant variable using information from baseline (T0), first follow-up (T1) or second follow-up (T3).
TABLE 5 | Association between overweight/obesity and adherence to key messages concerning a healthy lifestyle (odds ratios with 95% confidence intervals).
Baseline association
T0 full sample T1 subsample % change in T3 subsample % change in
ORa (95% CI) ORa (95% CI) OR (T1 vs. T0) ORa (95% CI) OR (T3 vs. T0)
Total screen timeb 0.76 (0.70–0.83) 0.79 (0.71–0.88) 4.0 0.80 (0.68–0.93) 5.3
N 15,084 10,374 4,791
MVPA >60 min per dayc 0.70 (0.58–0.84) 0.69 (0.55–0.86) −1.4 0.86 (0.61–1.20) 22.9
N 7,447 5,219 2,421
Sleep durationd 0.85 (0.74–0.96) 0.82 (0.70–00.96) −3.5 0.90 (0.72–1.14) 5.9
N 10,495 7,370 3,562
OR, odds ratio; CI, confidence interval.
a Odds ratios and confidence intervals for overweight/obesity of single models adjusted for age, sex, and country.
bLangeheine et al. Cohort Attrition and BMI in IDEFICS/I.Family
participants (Table 6). However, the majority of CPEs for a
OR (T3 vs. T0)
% Change in
restricted subsample of T3 participants were well above 10%.
−9.6
−7.1
16.3
11.0
70.4
19.1
54.2
ref.
DISCUSSION
TABLE 6 | Odds ratios with 95% confidence intervals for overweight/obesity stratified by the combination of adherence to key messages regarding media consumption, physical activity, and sleep.
0.66 (0.48–0.92)
0.72 (0.40–1.30)
1.01 (0.62–1.64)
0.92 (0.47–1.78)
0.75 (0.49–1.15)
0.74 (0.29–1.90)
0.39 (0.16–0.95)
ORc (95% CI)
In line with earlier research our results suggest that higher
attrition at the follow-ups was associated with a higher weight
ref.
status of children, lower children’s study compliance, older age,
lower parental education, and parent’s migration background
T3 subsample
(2, 3, 21, 22). For a multi-purpose cohort focusing on overweight
and obesity, the observed association between weight status and
Obeseb
attrition was perhaps to be expected. For instance, children
128
356
96
16
35
13
56
6
6
with higher BMI might have felt more uncomfortable having
their weight measured (in underwear) at baseline, causing
them to refuse participation in follow-ups. Or participation
Normala
1,635
498
444
150
296
89
54
36
68
in IDEFICS/I.Family might not have met the expectations of
children and/or parents concerning a health study, leading them
to leave the cohort that “did not work out for them.” However,
OR (T1 vs. T0)
while selection effects on children’s BMI did occur, they appeared
% Change in
to only slightly distort the distribution at the upper tail, mainly
−1.4
−9.7
−6.6
−9.5
25.9
3.2
2.1
ref.
above the 99% percentile.
We found that older children were less likely to take part in
the second follow-up as compared to younger ones. In contrast Baseline association
to studies on adults, the consent of both parents and children
0.72 (0.58–0.91)
0.56 (0.36–0.87)
0.85 (0.61–1.17)
0.68 (0.42–1.10)
0.65 (0.49–0.87)
0.49 (0.24–0.98)
0.38 (0.21–0.66)
ORc (95% CI)
was required for inclusion into this study, and it has been
shown that this makes recruitment particularly challenging (23).
ref.
In particular it remains unclear to which degree the opinion
+ Adherence (–: non-adherence) to key messages: TV (total screen time), PA (physical activity), and sleep (sleep duration).
of parents and/or children were decisive for participating. It
T1 subsample
is reasonable to assume that, as they get older, children act
c Odds ratios and confidence intervals for overweight/obesity of single models adjusted for age, sex, and country.
more autonomously and hence have more say regarding whether
Obeseb
259
215
120
749
28
77
24
10
16
or not to participate. As children transit into puberty, they
might find epidemiological studies less interesting or might get
increasingly uncomfortable with getting examined in underwear.
Normala
Unfortunately, although puberty status was part of the study
3,341
933
834
174
367
117
671
164
81
protocol at the second follow-up, it was not included at baseline
and at first follow-up, rendering it impossible to investigate links
between puberty status and attrition.
0.73 (0.61–0.88)
0.62 (0.44–0.90)
0.91 (0.70–1.18)
0.54 (0.35–0.82)
0.63 (0.50–0.80)
0.48 (0.27–0.83)
0.42 (0.28–0.66)
ORc (95% CI)
Furthermore, the association between children’s age and
attrition might also be influenced by residential mobility, which
ref.
has been shown to be highly associated with attrition as it
can lead to invalid contact data (14, 22, 24). In most of the
T0 full sample
OR, odds ratio; CI, confidence interval; ref. reference category.
participating countries, the transition from primary to secondary
school happens when children are between 10 and 12 years
Obeseb
1,125
377
317
132
180
44
30
16
29
old (except for Estonia’s and Sweden’s single structure school
systems) and for many of the children, this transition took place
between the first and second follow-up. Hence many families
Normala
might have used this opportunity to relocate, possibly leading
1,289
1,168
4,695
227
550
166
938
123
234
to dropouts if the family moved out of the study region or their
contact data became invalid.
a Normal weight including thin.
b Obese including overweight.
As participants were free to decide whether or not to take
Sleep
part in individual study modules, we used the study compliance
+
+
+
+
–
–
–
–
of both parents and children as proxy-measures of motivation.
The fact that both parent’s and children’s study compliance
PA
+
+
+
+
–
–
–
–
clustered among high values indicates that once people made
the decision to take part they completed the study program
TV
as a whole. Nevertheless, children’s participation was noticeably
+
+
+
+
N
–
–
–
–
Frontiers in Pediatrics | www.frontiersin.org 11 August 2018 | Volume 6 | Article 212Langeheine et al. Cohort Attrition and BMI in IDEFICS/I.Family
lower for the collection of the invasive biosamples. Parents were 10%, potentially caused by a sharp decline in the number of
more likely to complete all modules that took place in the study observations for the subgroups.
center (general questionnaire, food frequency questionnaire, and
medical history), and less likely to complete the take-home STRENGTHS AND LIMITATIONS
questionnaires (24–h dietary recall). This could be due to the
fact that the latter questionnaires were more time consuming and Strengths of our study include the large sample size from an
involved setting aside additional time for the study. international population and the highly standardized procedures
Unfortunately, it cannot be ruled out that parents of children for data collection that were enforced by a central quality control.
with certain diagnoses covered by the medical questionnaire As noted previously, interpretation of our results would have
might have been more reluctant to complete it to avoid benefitted if information about puberty status would have been
stigmatization. Previous results from the cohort published gathered at each time point and more centers would have
elsewhere showed that, for instance, the prevalence of ADHD collected paradata.
in the cohort was somewhat lower as compared to the whole
population (25). CONCLUSION
Heterogeneity analyses revealed that countries differed
considerably in how well the overall model captured the influence Potential bias in cohort studies induced by attrition may vary
of different predictors on attrition. However, although the according to exposure and outcome (28) and even a high level
heterogeneity between the countries was high in terms of I², a of attrition may have a limited effect on estimates of associations
closer look using country stratified forest plots revealed that for between exposure and outcome (2, 28, 29). Our results, however
many predictors all countries showed similar trends. For some suggest that the IDEFICS/I.Family cohort gives valid estimates of
predictors, high heterogeneity estimates appeared to be caused the associations of interest.
by single outliers because excluding these outliers improved I²
considerably. While there are plausible explanations for some of AUTHOR CONTRIBUTIONS
the deviations from the general trend, for others there are none.
For instance, Italy’s estimates for the influence of educational HP, FL, TV, MT, DM, GE, SdH, LM, GW, and WA contributed to
level probably deviated because of the small proportion of parents data collection; ML, HP, WA, and SR designed and implemented
with high educational level in their sample. However, it is not the research; ML, HP, WA, and SR analyzed and interpreted the
clear why female children in Belgium were more likely to take data; ML, and SR drafted the manuscript. All authors discussed
part in the follow-ups, whereas no such association was obvious the results, critically commented on the manuscript, and gave
for other countries. Similarly, we cannot explain why attrition their final approval to the submitted version of the manuscript.
differed for control and intervention regions in Belgium, but
not in other participating countries. Often such inconsistencies ACKNOWLEDGMENTS
can be explained by investigating paradata recorded during
recruitment [i.e., information about the process of the data The baseline data collection and the first follow-up work as
collection (26)] with dedicated documentation systems [e.g., (9, part of the IDEFICS Study [www.idefics.eu] were financially
27)]. Unfortunately paradata were only available for the German supported by the European Commission within the Sixth RTD
study cohort (9), rendering an analysis for the whole cohort Framework Programme Contract No. 016181 (FOOD). The most
impossible. The collection of paradata might thus be especially recent follow-up was conducted in the framework of the I.Family
crucial in multicenter cohort studies, where documentation is study [www.ifamilystudy.eu] which was funded by the European
often difficult to coordinate between different survey teams Commission within the Seventh RTD Framework Programme
operating over long periods of time. Contract No. 266044 (KBBE 2010-14). The research presented
Analysis of selection effects on cross-sectional exposure- here incorporates data from both projects. Additional resources
outcome associations revealed few effects on point estimates were invested by all participating partners. GE acknowledges
when restricting the full sample at baseline (T0) to participants the Swedish Research Councils (VR and Forte) for support
of the first follow-up (T1). Results on CPEs after restricting the of the IDEFICS and I.Family studies. The authors gratefully
exposure-outcome associations to a subsample of second follow- acknowledge the work of the IDEFICS consortium.
up participants (T3) were mixed. In particular in the detailed We are grateful to Florence Samkange-Zeeb for critically
analysis of adherence and overweight/obesity CPEs exceeded reviewing an earlier version of the manuscript.
REFERENCES Epidemiology (2013) 24:1–9. doi: 10.1097/EDE.0b013e31827
623b1
1. Lynn P. Methods for Longitudinal Surveys. In: Lynn P, editor. Methodology of 3. Vinther-Larsen M, Riegels M, Rod MH, Schiøtz M, Curits T, Grønbæk M. The
Longitudinal Surveys. Hoboken, NJ: Wiley (2009). p. 1–20. Danish Youth Cohort: characteristics of participants and non-participants
2. Howe LD, Tilling K, Galobardes B, Lawlor DA. Loss to follow-up and determinants of attrition. Scand J Public Health (2010) 38:648–56.
in cohort studies: bias in estimates of socioeconomic inequalities. doi: 10.1177/1403494810374222
Frontiers in Pediatrics | www.frontiersin.org 12 August 2018 | Volume 6 | Article 212Langeheine et al. Cohort Attrition and BMI in IDEFICS/I.Family
4. Melton LJ, 3rd, Dyck PJ, Karnes JL, O’Brien PC, Service FJ. Non-response bias 20. Knai C, Lobstein T, Darmon N, Rutter H, McKee M. Socioeconomic
in studies of diabetic complications: the rochester diabetic neuropathy Study. patterning of childhood overweight status in Europe. Int J Environ Res Public
J Clin Epidemiol. (1993) 46:341–8. doi: 10.1016/0895-4356(93)90148-T Health (2012) 9:1472–89. doi: 10.3390/ijerph9041472
5. Ahrens W, Bammann K, Siani A, Buchecker K, De Henauw S, Iacoviello 21. Lange M, Butschalowsky HG, Jentsch F, Kuhnert R, Schaffrath
L, et al. The IDEFICS cohort: design, characteristics and participation Rosario A, Schlaud M, et al. Die erste KiGGS-Folgebefragung (KiGGS
in the baseline survey. Int J Obes. (2005) (2011) 35(Suppl. 1):S3–15. Welle 1). Studiendurchführung, Stichprobendesign und Response.
doi: 10.1038/ijo.2011.30 Bundesgesundheitsblatt (2014) 57:747–61. doi: 10.1007/s00103-014-
6. Ahrens W, Siani A, Adan R, De Henauw S, Eiben G, Gwozdz W, et al. Cohort 1973-9
Profile: The transition from childhood to adolescence in European children– 22. Behr A, Bellgart E, Rendtel U. Extent and determinants of panel attrition
how I. Family extends the IDEFICS cohort. Int J Epidemiol. (2017) 46:1394–5j. in the european community household. Eur Soc Rev. (2005) 21:489–512.
doi: 10.1093/ije/dyw317 doi: 10.1093/esr/jci037
7. Hense S, Pohlabeln H, Michels N, Mårild S, Lissner L, Kovacs E, et al. 23. Fletcher AC, Hunter AG. Strategies for Obtaining Parental Consent
Determinants of attrition to follow-up in a multicentre cohort study in to Participate in Research. Family Relations (2003) 52:216–21.
children-results from the IDEFICS study. Epidemiol Res Int. (2013) 2013:1–9. doi: 10.1111/j.1741-3729.2003.00216.x
doi: 10.1155/2013/936365 24. Lepkowski JM, Couper MP. Nonresponse in the Second Wave of Longitudinal
8. Regber S, Novak M, Eiben G, Lissner L, Hense S, Sandström TZ, et al. Household Surveys. In: Groves RM, Dillman DA, Eltinge JL, Little RJA,
Assessment of selection bias in a health survey of children and families editors. Survey Nonresponse. New York, NY: John Wiley (2002). p. 257–72.
- the IDEFICS Sweden-study. BMC Public Health (2013) 13:418–28. 25. Pohlabeln H, Rach S, De Henauw S, Eiben G, Gwozdz W, Hadjigeorgiou
doi: 10.1186/1471-2458-13-418 C, et al. Further evidence for the role of pregnancy-induced hypertension
9. Langeheine M, Pohlabeln H, Ahrens W, Rach S. Consequences of an extended and other early life influences in the development of ADHD: results
recruitment on participation in the follow-up of a child study: results from from the IDEFICS study. Eur Child Adoles Psychiatry (2017) 26:957–67.
the german IDEFICS cohort. Paediatric Perinatal Epidemiol. (2017) 31:76-86. doi: 10.1007/s00787-017-0966-2
doi: 10.1111/ppe.12328 26. Groves RM, Heeringa SG. Responsive design for household surveys: tools
10. UNESCO. International Standard Classification of education ISCED 2011. for actively controlling survey errors and costs. J R Stat Soc Ser A (2006)
Montreal, QC: UNESCO Institute for Statistics (2012). 169:439–57. doi: 10.1111/j.1467-985X.2006.00423.x
11. Cole TJ, Lobstein T. Extended international (IOTF) body mass index cut- 27. Reineke A, Pigeot I, Ahrens W, Rach S, on behalf of the IDEFICS and I.
offs for thinness, overweight and obesity. Pediatric Obes. (2012) 7:284–94. Family consortia. MODYS–a modular control and documentation system
doi: 10.1111/j.2047-6310.2012.00064.x for epidemiological studies. In: Bammann K, Lissner L, Pigeot I, Ahrens
12. Snijders TAB, Bosker RJ. Multilevel Analysis: An Introduction to Basic and W, editors. Instruments for Health Surveys in Children and Adolescents.
Advanced Multilevel Modeling. London: Sage (1999). Heidelberg: Springer (2018).
13. Allison PD. Event History Analysis. Regression Models for Longitudinal Event 28. Greene N, Greenland S, Olsen J, Nohr EA. Estimating bias from loss to follow-
Data. Beverly Hills, CA: Sage (1985). up in the Danish National birth cohort. Epidemiology (2011) 22:815–22.
14. Watson D. Sample Attrition between Waves 1 and 5 in the European doi: 10.1097/EDE.0b013e31822939fd
Community Household Panel. Eur Soc Rev. (2003) 19:361–78. 29. Powers J, Tavener M, Graves A, Loxton D. Loss to follow-up was used to
doi: 10.1093/esr/19.4.361 estimate bias in a longitudinal study: a new approach. J Clin Epidemiol. (2015)
15. Riley RD, Higgins JP, Deeks JJ. Interpretation of random effects meta-analyses. 68:870–6. doi: 10.1016/j.jclinepi.2015.01.010
BMJ (2011) 342:d549. doi: 10.1136/bmj.d549
16. Higgins JPT. Measuring inconsistency in meta-analyses. BMJ (2003) 327:557– Conflict of Interest Statement: The authors declare that the research was
60. doi: 10.1136/bmj.327.7414.557 conducted in the absence of any commercial or financial relationships that could
17. Wang J, Tsang WW, Marsaglia G. Evaluating Kolmogorov’s distribution. J Stat. be construed as a potential conflict of interest.
Software (2003) 8:1-4. doi: 10.18637/jss.v008.i18
18. Kovacs E, Hunsberger M, Reisch L, Gwozdz W, Eiben G, De Bourdeaudhuij Copyright © 2018 Langeheine, Pohlabeln, Lauria, Veidebaum, Tornaritis, Molnar,
I, et al. Adherence to combined lifestyle factors and their contribution Eiben, de Henauw, Moreno, Williams, Ahrens and Rach. This is an open-access
to obesity in the IDEFICS study. Obes Rev. (2015) 16(Suppl. 2):138–50. article distributed under the terms of the Creative Commons Attribution License (CC
doi: 10.1111/obr.12349 BY). The use, distribution or reproduction in other forums is permitted, provided
19. Ahrens W, Pigeot I, Pohlabeln H, De Henauw S, Lissner L, Molnar D, the original author(s) and the copyright owner(s) are credited and that the original
et al. Prevalence of overweight and obesity in European children below publication in this journal is cited, in accordance with accepted academic practice.
the age of 10. Int J Obes. (2014) 38(Suppl. 2):S99–107. doi: 10.1038/ijo. No use, distribution or reproduction is permitted which does not comply with these
2014.140 terms.
Frontiers in Pediatrics | www.frontiersin.org 13 August 2018 | Volume 6 | Article 212You can also read